. 2018;14(12):2117-2138.
doi: 10.1080/15548627.2018.1505153. Epub 2018 Sep 6.

The pro-oxidant adaptor p66SHC promotes B cell mitophagy by disrupting mitochondrial integrity and recruiting LC3-II

Affiliations

The pro-oxidant adaptor p66SHC promotes B cell mitophagy by disrupting mitochondrial integrity and recruiting LC3-II

Anna Onnis et al. Autophagy. 2018.

Abstract

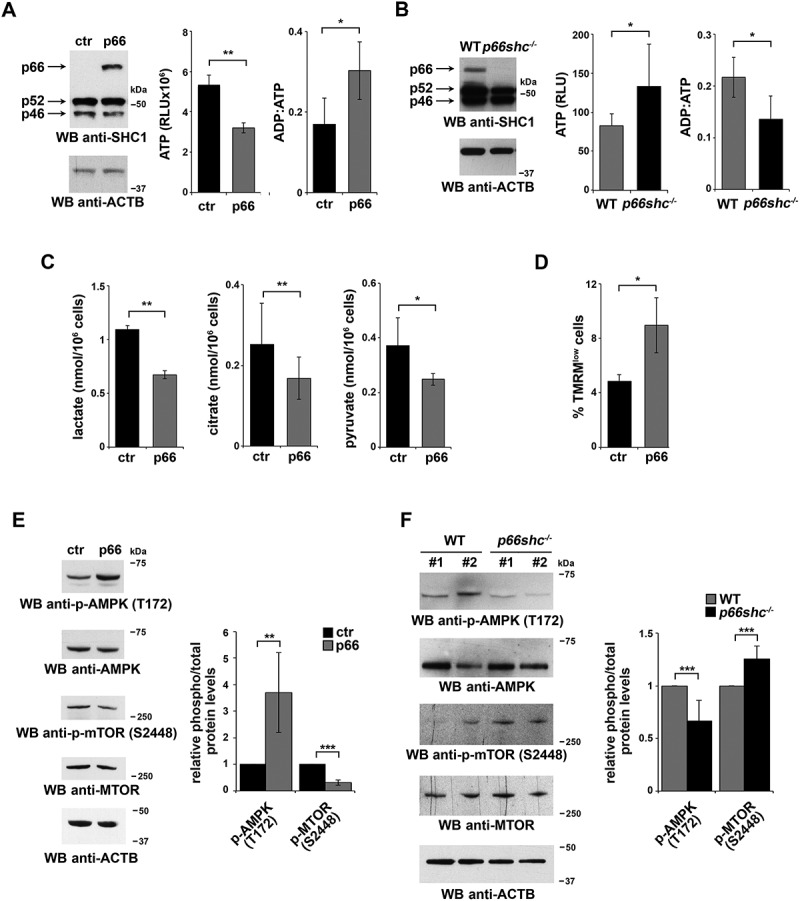
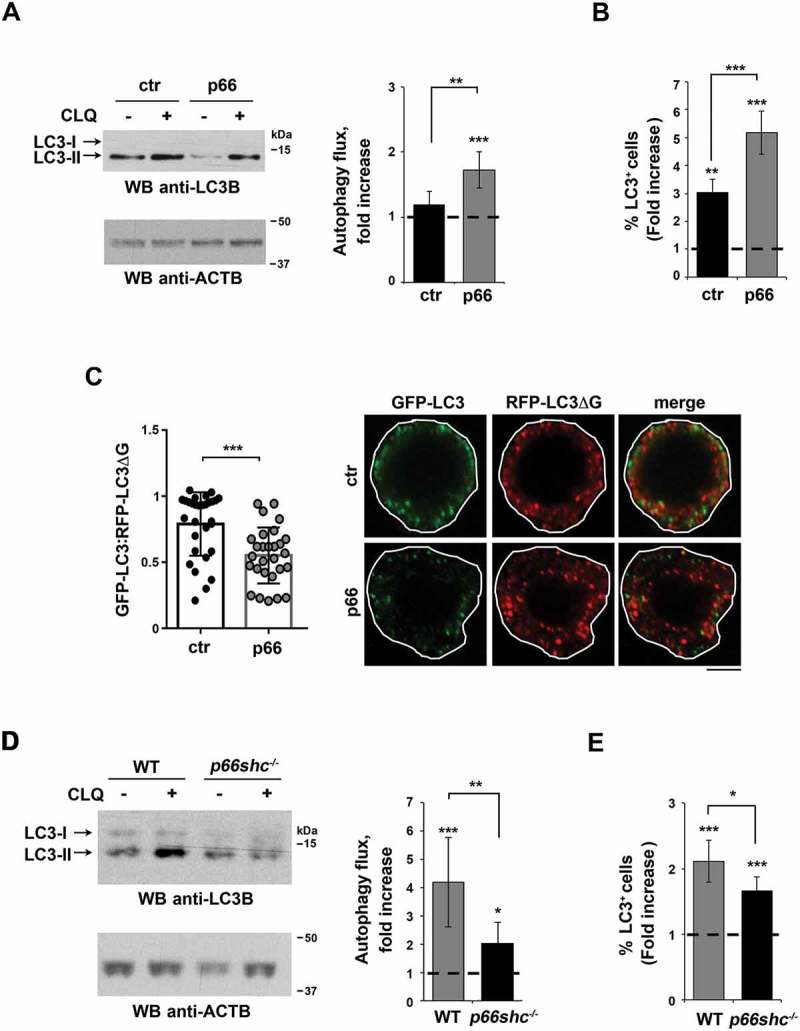
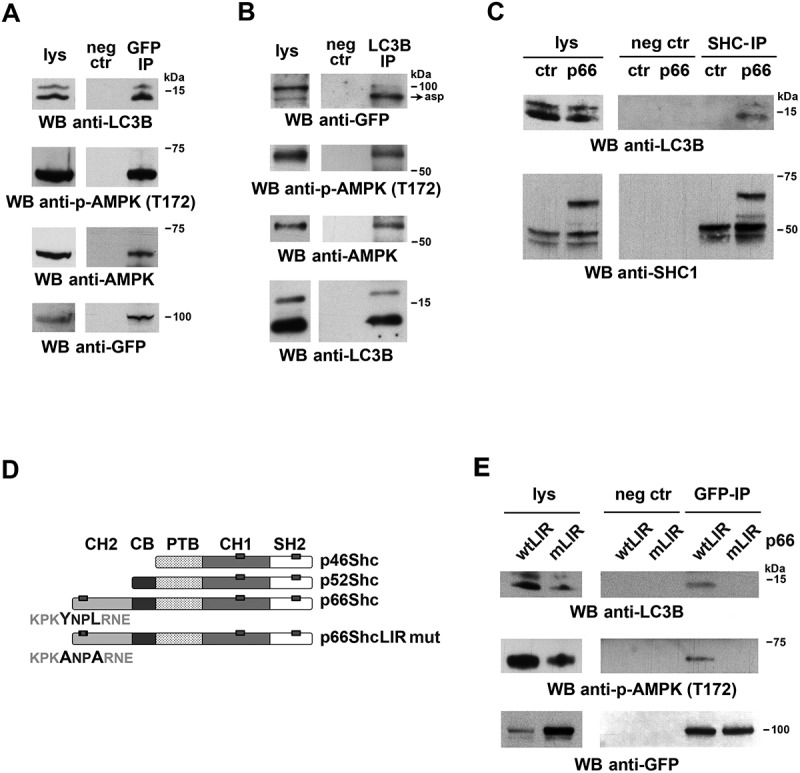
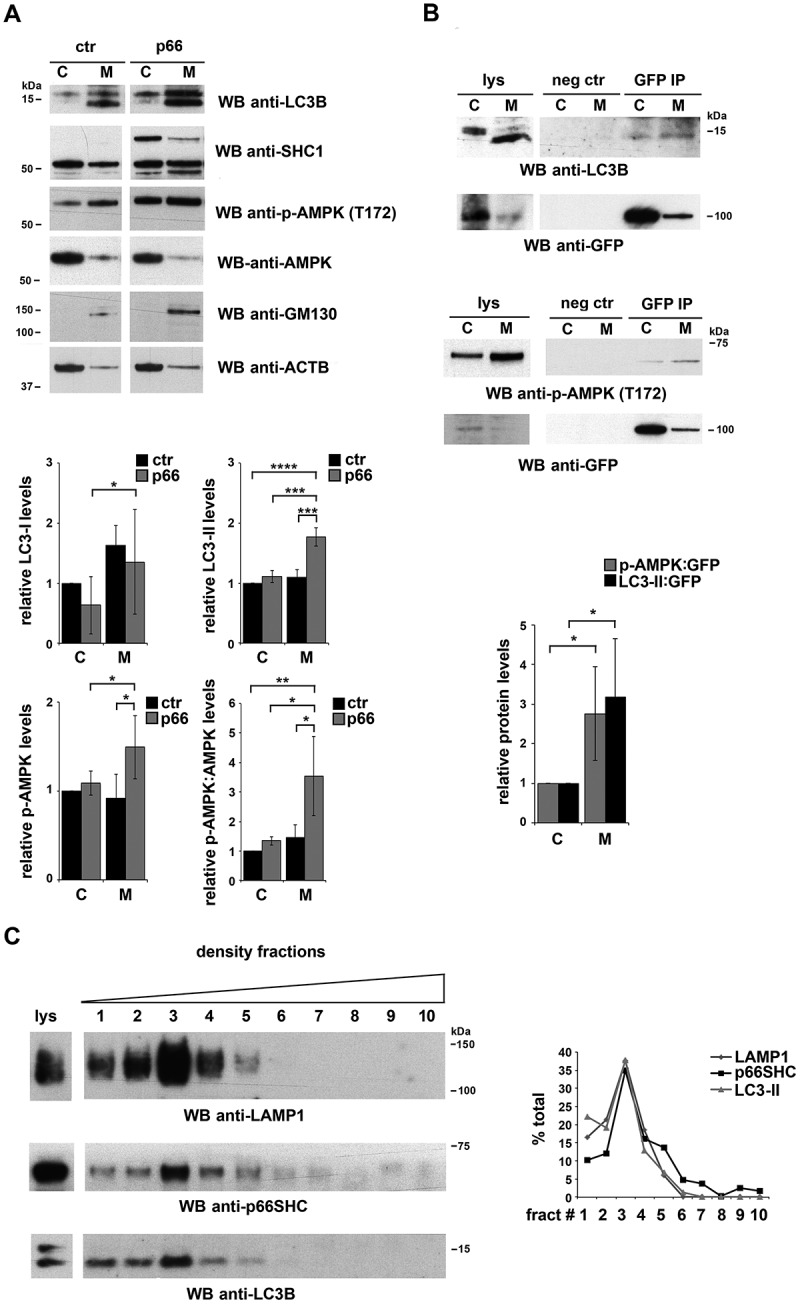
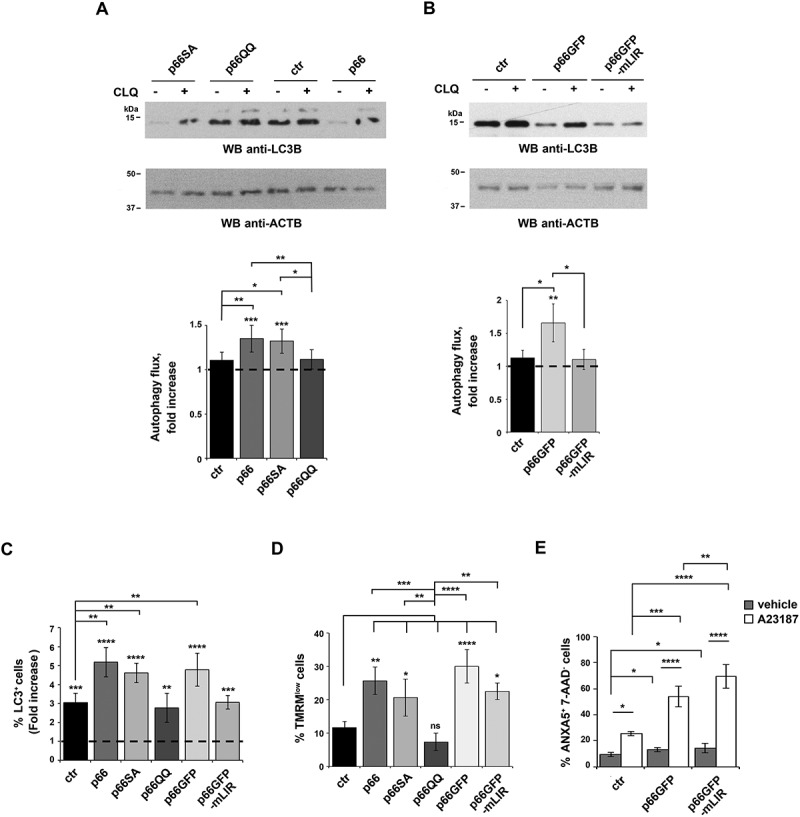
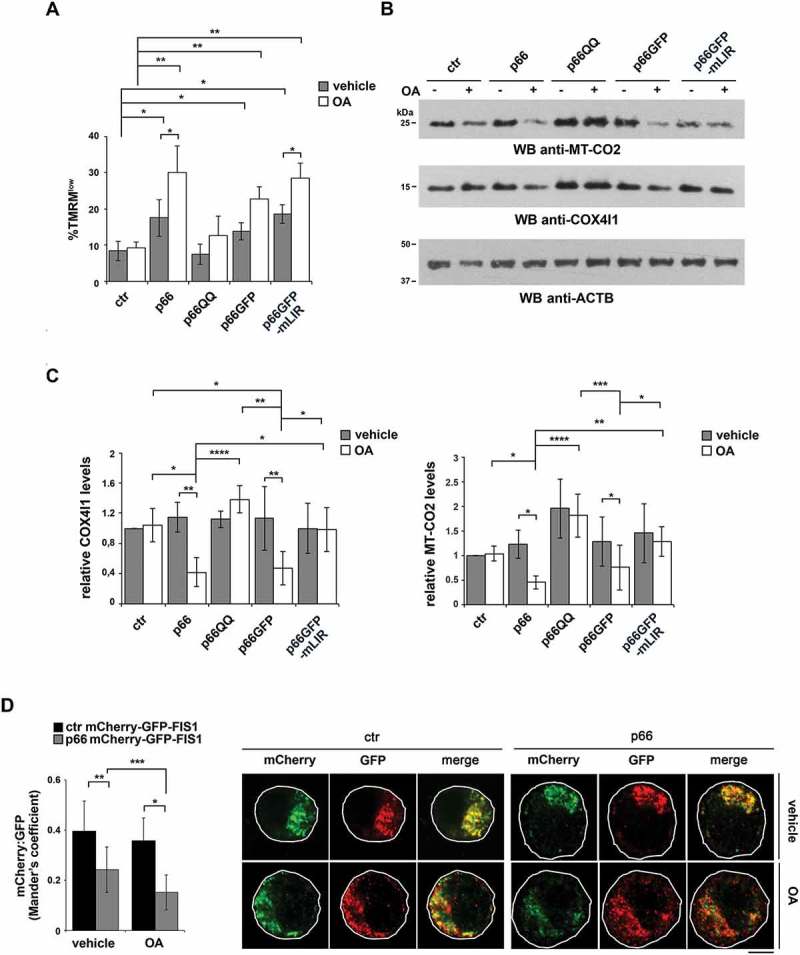
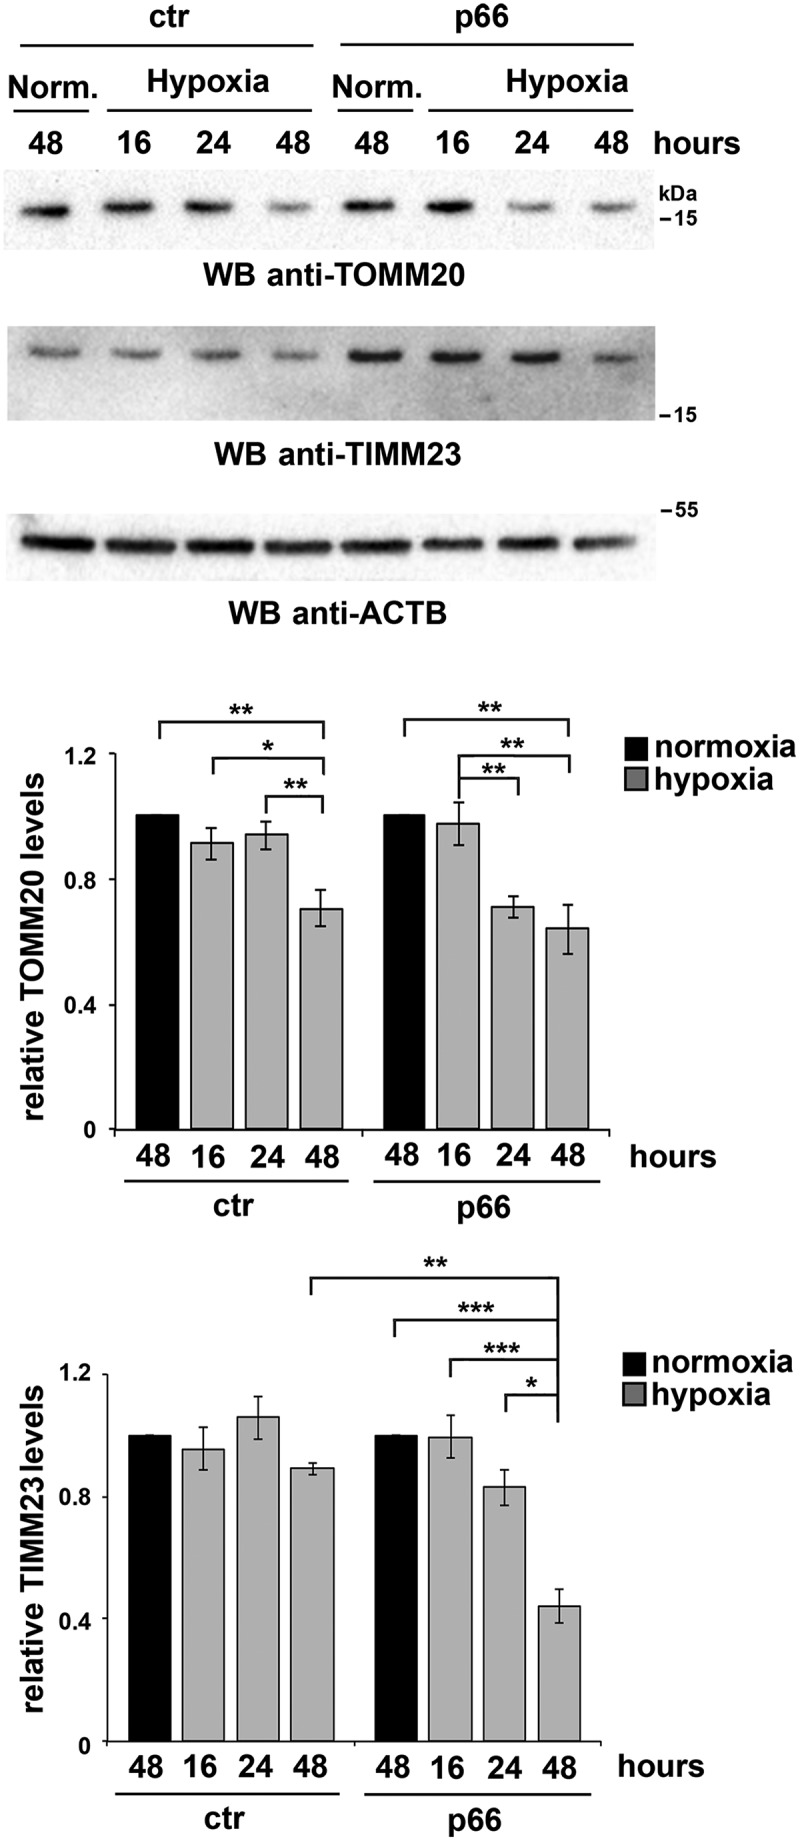
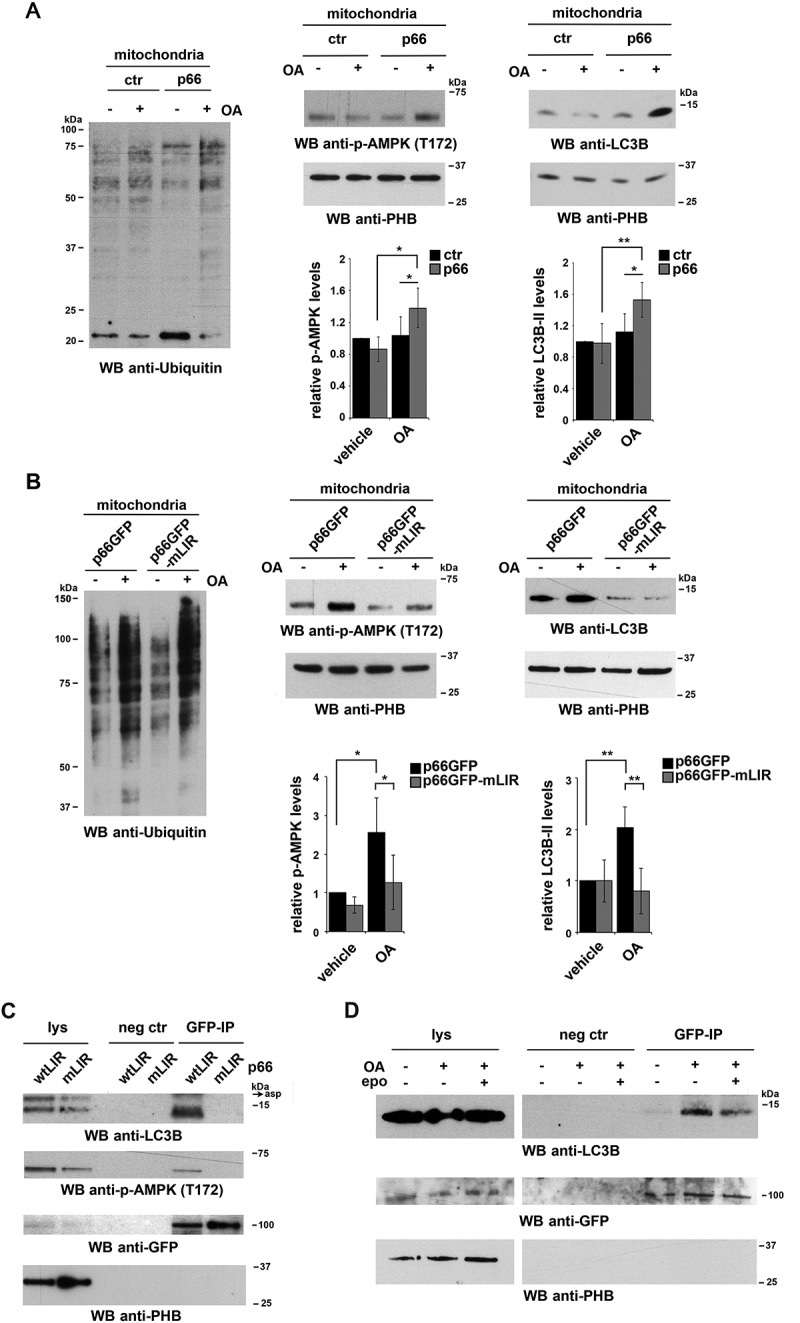
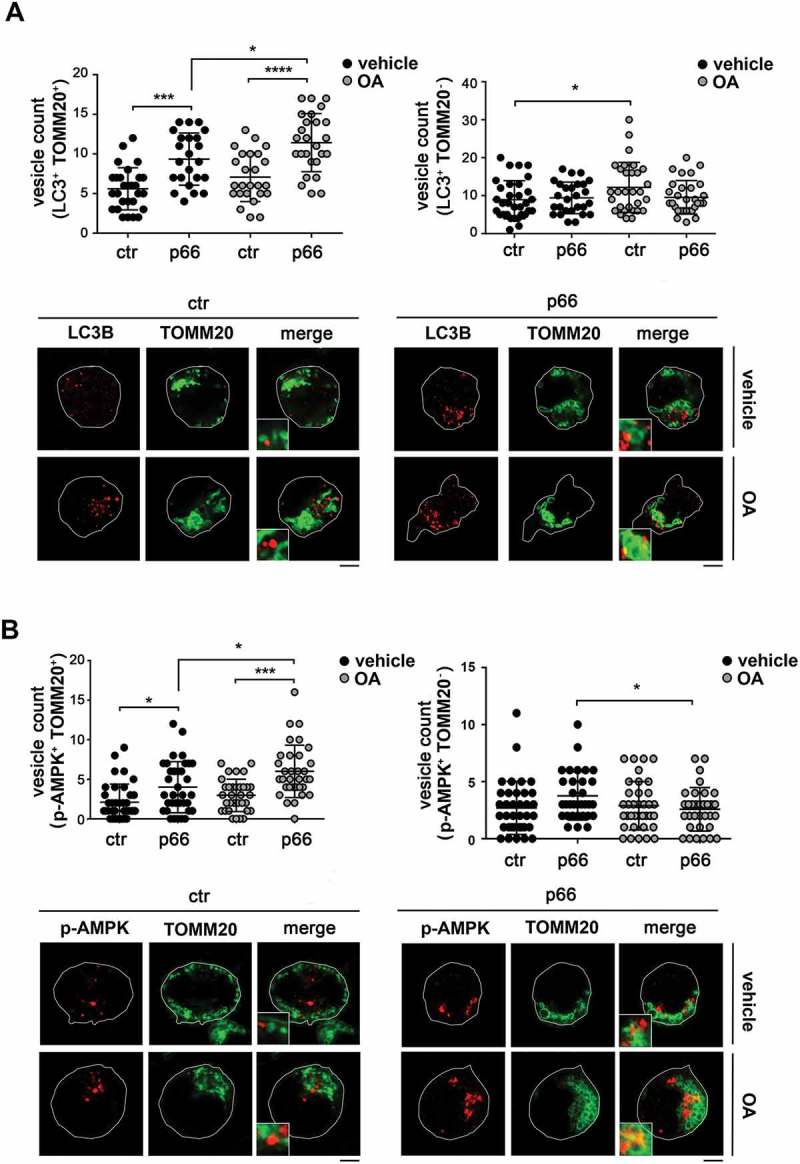
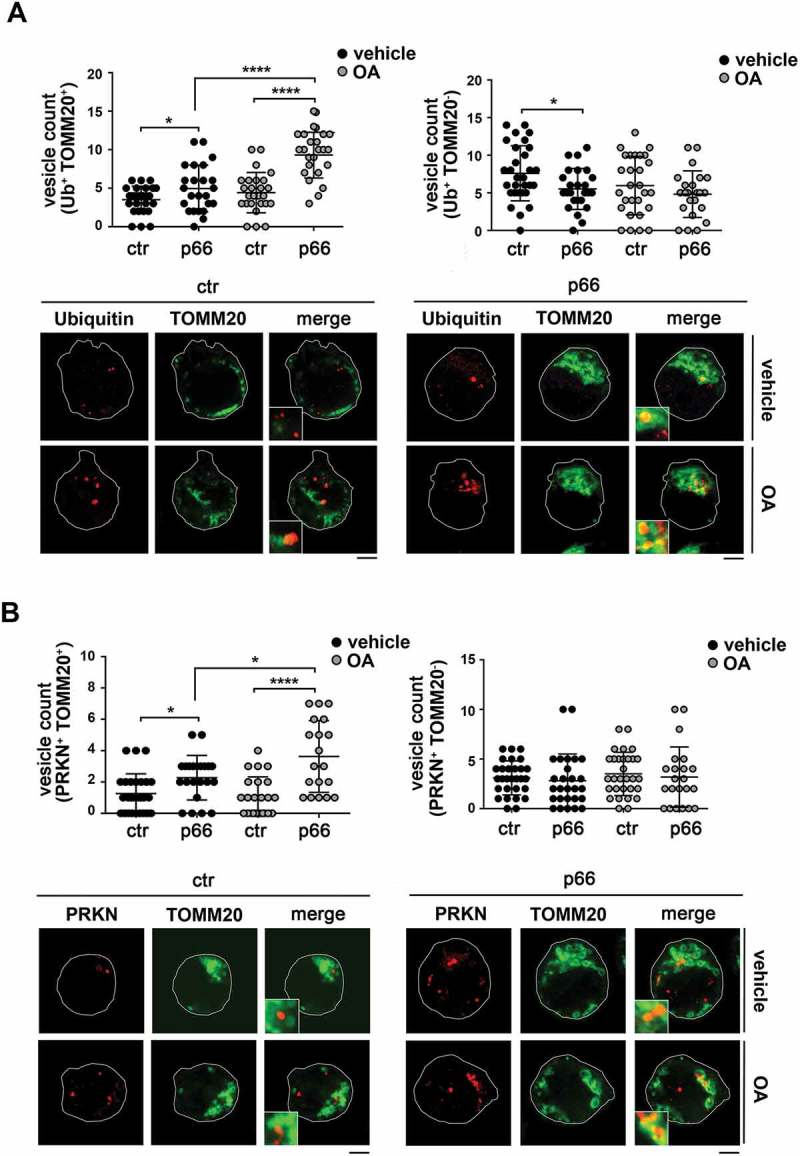
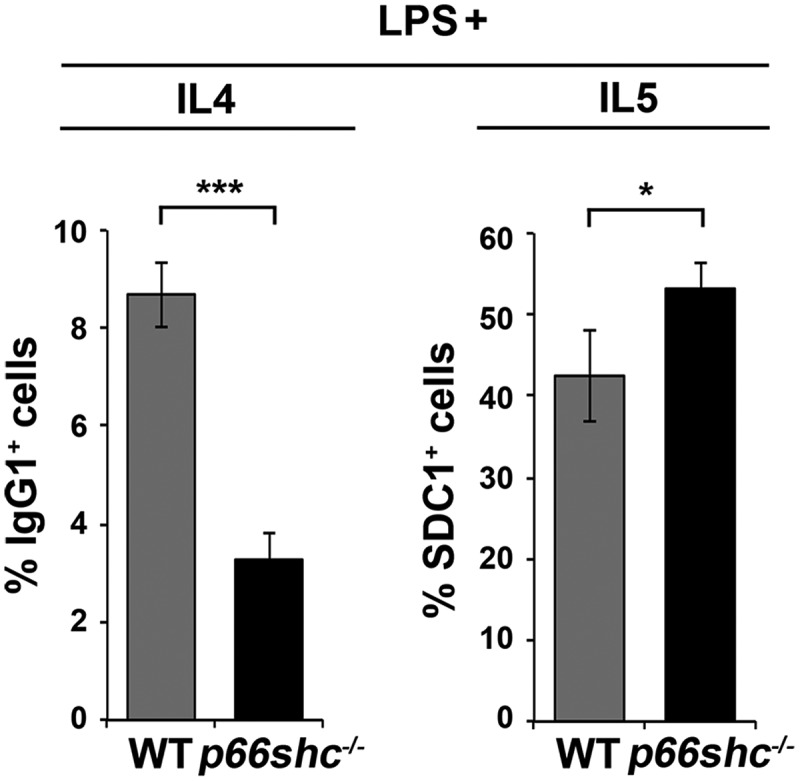
Macroautophagy/autophagy has emerged as a central process in lymphocyte homeostasis, activation and differentiation. Based on our finding that the p66 isoform of SHC1 (p66SHC) pro-apoptotic ROS-elevating SHC family adaptor inhibits MTOR signaling in these cells, here we investigated the role of p66SHC in B-cell autophagy. We show that p66SHC disrupts mitochondrial function through its CYCS (cytochrome c, somatic) binding domain, thereby impairing ATP production, which results in AMPK activation and enhanced autophagic flux. While p66SHC binding to CYCS is sufficient for triggering apoptosis, p66SHC-mediated autophagy additionally depends on its ability to interact with membrane-associated LC3-II through a specific binding motif within its N terminus. Importantly, p66SHC also has an impact on mitochondria homeostasis by inducing mitochondrial depolarization, protein ubiquitination at the outer mitochondrial membrane, and local recruitment of active AMPK. These events initiate mitophagy, whose full execution relies on the role of p66SHC as an LC3-II receptor which brings phagophore membranes to mitochondria. Importantly, p66SHC also promotes hypoxia-induced mitophagy in B cells. Moreover, p66SHC deficiency enhances B cell differentiation to plasma cells, which is controlled by intracellular ROS levels and the hypoxic germinal center environment. The results identify mitochondrial p66SHC as a novel regulator of autophagy and mitophagy in B cells and implicate p66SHC-mediated coordination of autophagy and apoptosis in B cell survival and differentiation. Abbreviations: ACTB: actin beta; AMPK: AMP-activated protein kinase; ATP: adenosine triphosphate; ATG: autophagy-related; CYCS: cytochrome c, somatic; CLQ: chloroquine; COX: cyclooxygenase; CTR: control; GFP: green fluorescent protein; HIFIA/Hif alpha: hypoxia inducible factor 1 subunit alpha; IMS: intermembrane space; LIR: LC3 interacting region; MAP1LC3B/LC3B: microtubule associated protein 1 light chain 3 beta; MTOR/mTOR: mechanistic target of rapamycin kinase; OA: oligomycin and antimycin A; OMM: outer mitochondrial membrane; PHB: prohibitin; PBS: phosphate-buffered saline; PINK1: PTEN induced putative kinase 1; RFP: red fluorescent protein; ROS: reactive oxygen species; SHC: src Homology 2 domain-containing transforming protein; TMRM: tetramethylrhodamine, methyl ester; TOMM: translocase of outer mitochondrial membrane; ULK1: unc-51 like autophagy activating kinase 1; WT: wild-type.

Keywords: Autophagy; B lymphocytes; LC3 adaptor; mitochondria; mitophagy; p66SHC.


Figures

Figure 1.
Figure 1.
p66SHC impairs B cell glycolysis and mitochondrial integrity. (A) Left, Immunoblot analysis of p66SHC in lysates of MEC-1 cells stably transfected with empty vector (ctr) or with an expression construct encoding wild-type p66SHC (n ≥ 3). ACTB was used as a loading control. Right, Relative levels of ATP and ADP:ATP ratio in ctr and p66 cells (n ≥ 3). RLU, relative light units. (B) Left, immunoblot analysis of p66SHC in lysates of splenic B cells from wild-type (WT) and p66shc-/- mice (n ≥ 10/group). ACTB was used as a loading control. Right, relative levels of ATP (n ≥ 10/group) and ADP:ATP ratio (≥ 2 mice/exp, n ≥ 3) in splenic B cells from WT and p66shc-/ mice. RLU, relative light units. (C) Lactate, citrate and pyruvate levels in ctr and p66 cells (n = 3). (D) Flow cytometric analysis of TMRM-loaded ctr and p66 cells. The histogram shows the percentages of TMRMlow (depolarized) cells. (E,F) Immunoblot analysis of p-AMPK (Thr172) and p-MTOR (Ser2448) and the respective non-phosphorylated counterparts, in lysates of ctr and p66 cells (n ≥ 3) (E) or of splenic B cells from of WT and p66shc-/- mice (n ≥ 10 mice for each group) (F). ACTB was used as a loading control. Representative immunoblots are shown on the left of each panel, while the quantifications are shown on the right. The data are expressed as mean± SD. ***P ≤ 0.001; **P ≤ 0.01; *P ≤ 0.05 (Student’s t-test).
Figure 2.
Figure 2.
p66SHC promotes B cell autophagy. (A) Immunoblot analysis of the autophagy marker LC3B in lysates of ctr and p66 cells untreated or treated for 1 h with a downstream inhibitor of the autophagy pathway, chloroquine (CLQ). ACTB was used as loading control. The histogram shows the quantification of autophagy flux [80] as the difference in LC3-II:ACTB between CLQ-treated and untreated cells (mean fold ± SD accumulation of LC3B-II in samples treated with CLQ compared to the vehicle control; vehicle control value = 1, dashed line; see also the Methods section) (n ≥ 3). (B) Flow cytometric analysis of LC3-FITC staining of the ctr and p66 cells untreated or treated for 1 h with the commercial lysosome inhibitor ‘Autophagy Reagent A’ (CLQ) (n ≥ 3). The histogram shows the mean fold accumulation of LC3+ cells treated with the ‘Autophagy Reagent A’ compared to the vehicle control (vehicle control value = 1, dashed line). (C) Left, quantification of the ratio between the fluorescence intensity of GFP-LC3 and RFP-LC3ΔG in ctr and p66 cells transiently transfected with the pMRX-IP-GFP-LC3-RFP-LC3ΔG construct and labeled with anti-GFP and anti-RFP antibodies (≥ 10 cells/sample, n = 3). Right, representative images (medial optical sections) are shown. Size bar: 5 μm. (D) Immunoblot analysis of LC3B in lysates of splenic B cells from WT and p66shc-/- mice treated with or without CLQ. ACTB was used as a loading control. The histogram shows the quantification of autophagy flux as the difference in LC3-II:ACTB between CLQ-treated and untreated cells (mean fold ± SD accumulation of LC3B-II in samples treated with CLQ compared to the vehicle control; vehicle control value = 1, dashed line) (n ≥ 10 mice/group). (E) Flow cytometric analysis of LC3-FITC staining of splenic B cells from WT and p66shc-/- mice (≥ 2 mice/exp, n ≥ 3). Cells were either untreated or treated for 1 h with the lysosome inhibitor ‘Autophagy Reagent A’ (CLQ) (n ≥ 3). The histogram shows the mean fold accumulation of LC3+ cells compared to the vehicle control (vehicle control value = 1, dashed line). The asterisks above each graph column indicate the statistical significance compared to the vehicle control. The data are expressed as mean± SD. ***P ≤ 0.001; **P ≤ 0.01; *P ≤ 0.05 (Student’s t-test).
Figure 3.
Figure 3.
p66SHC interacts with LC3B-II and p-AMPK through an N-terminal LIR motif. (A) Immunoblot analysis of GFP-specific immunoprecipitates from lysates of GFP-p66SHC-expressing cells (n = 3). (B) Immunoblot analysis of LC3B-immunoprecipitates from lysates of GFP-p66SHC-expressing cells (n = 3). (C) Immunoblot analysis of SHC- immunoprecipitates from lysates of ctr and p66 cells obtained using an anti-pan-SHC1 antibody (n = 3). (D) Schematic presentation of the 3 isoforms of SHC1 (p46, p52 and p66) and the respective domains, namely the N-terminal collagen-homology domain (CH2), the CYCS-binding domain (CB), the phosphotyrosine-binding domain (PTB), the internal collagen homology domain (CH1) and the C-terminal SRC-homology domain 2 (SH2). The 3 putative LIR motifs highlighted as gray boxes on the SHC1 isoforms span p66SHC residues 10–13, 427–430 and 549–552. The YNPL LIR motif (residues 10–13) in the CH2-domain was mutated to ANPA. (E) Immunoblot analysis of GFP-specific immunoprecipitates from lysates of MEC transfectants expressing GFP-tagged wild-type p66SHC (wtLIR) or the GFP-tagged p66-mLIR mutant (mLIR). Preclearing controls (proteins that bound to protein-A–Sepharose before the addition of primary antibody) are included in each blot (neg ctr). Total cell lysates were included in each gel to identify the migration of the proteins tested. The immunoblots shown are representative of 3 independent experiments.
Figure 4.
Figure 4.
p66SHC forms a complex with LC3-II and p-AMPK at cell membranes. (A) Immunoblot analysis of LC3B, SHC1, p-AMPK and AMPK in cytosolic (C) and membrane (M) fractions from ctr and p66 cell lysates. The histograms in the lower part of the panel show the quantification of LC3B-I, LC3B-II, p-AMPK and p-AMPK:AMPK in multiple experiments (n ≥ 3). The cis-Golgi marker GOLGA2/GM130 was used to assess the purity of membrane fractions. The samples in the figure belong to the same immunoblot. (B) Immunoblot analysis of GFP-specific immunoprecipitates from lysates of cytosolic (C) and membrane (M) fractions from lysates of GFP-p66SHC-expressing MEC cells. The histogram in the lower part of the panel shows the quantification of LC3B-II and p-AMPK in multiple experiments (n ≥ 3). (C) Immunoblot analysis of p66 in cell membranes fractionated on 10–30% iodixanol gradients. The graph in the right part of the panel shows the quantification (%) of LAMP1, p66SHC and LC3B-II in each fraction vs total specific protein (n = 3). The data are expressed as mean± SD. ****P ≤ 0.0001; ***P ≤ 0.001; **P ≤ 0.01; *P ≤ 0.05 (one-way ANOVA and Student’s t-test).
Figure 5.
Figure 5.
The pro-autophagic activity of p66SHC requires both the CYCS-binding site and the LIR motif. (A,B) Immunoblot analysis of LC3B in lysates of the ctr, p66, p66QQ and p66SA MEC transfectants (A) or of the MEC transfectants expressing GFP-tagged wild-type p66SHC (p66GFP) or the GFP-tagged p66SHCLIR mutant (p66GFP-mLIR) (B), untreated or treated with CLQ. ACTB was used as loading control. The histograms show the quantification of autophagy flux [80] as the difference in LC3-II:ACTB between CLQ-treated and untreated cells (mean fold ± SD accumulation of LC3B-II in samples treated with CLQ compared to the vehicle control; vehicle control value = 1, dashed line; see also the Methods section) (n ≥ 3). The asterisks above each graph column indicate the statistical significance compared to the vehicle control. (C) Flow cytometric analysis of FITC-LC3 staining of the ctr, p66, p66SA, p66QQ transfectants, as well as of the transfectants expressing GFP-tagged wild-type p66SHC (p66GFP) or the GFP-tagged p66SHC LIR mutant (p66GFP-mLIR). Cells were either untreated or treated for 1 h with the commercial lysosome inhibitor ‘Autophagy Reagent A’ (CLQ) (n ≥ 3). The histogram shows the mean fold accumulation of LC3+ cells compared to the vehicle control (vehicle control value = 1, dashed line). (D) Flow cytometric analysis of the TMRM-loaded transfectants. The histogram shows the percentages of TMRMlow (depolarized) cells (n ≥ 3). (E) Flow cytometric analysis of ANXA5-7-AAD staining of the ctr cells and transfectants expressing GFP-tagged wild-type p66SHC (p66GFP) or the GFP-tagged p66SHC LIR mutant (p66GFP-mLIR). Cells were either untreated or treated for 40 min with 2 μg/ml A23187 (n ≥ 3). The histogram shows the percentages of ANXA5+ 7-AAD- cells. The data are expressed as mean± SD. ****P ≤ 0.0001; ***P ≤ 0.001; **P ≤ 0.01; *P ≤ 0.05 (one-way ANOVA).
Figure 6.
Figure 6.
p66SHC promotes mitochondrial inhibitor-induced mitophagy in B cells. (A) Flow cytometric analysis of TMRM-loaded ctr, p66, p66QQ, p66GFP and p66GFP-mLIR cells untreated or treated for 1 h with the mitophagy inducers oligomycin mix (A, B and C isomers) and antimycin A (OA). The histogram shows the percentages of TMRMlow (depolarized) cells (n ≥ 3). (B) Immunoblot analysis of MT-CO2/COXII and COX4I1/COXIV in ctr MEC cells or the MEC transfectants expressing wild-type p66SHC (p66) or the p66SHC-QQ (p66QQ) mutant, or GFP-tagged wild-type p66SHC (p66GFP) or the GFP-tagged p66SHC LIR mutant (p66GFP-mLIR), untreated or treated for 24 h with OA. ACTB was used as a loading control. (C) Quantification of MT-CO2 and COX4I1 in samples treated and analyzed as in B (n ≥ 3). (D) Left, quantification using Mander’s coefficient of the weighted colocalization of mCherry-GFP-FIS1 in the ctr and p66 MEC transfectant stably transfected with the mCherry-GFP-FIS1 construct, untreated or treated for 24 h with OA and labelled with anti-GFP and anti-RFP antibodies (≥ 10 cells/sample, n = 3). Right, representative images (medial optical sections) are shown. Size bar: 5 μm. The data are expressed as mean± SD. ****P ≤ 0.0001; ***P ≤ 0.001; **P ≤ 0.01; *P ≤ 0.05 (one-way ANOVA).
Figure 7.
Figure 7.
p66SHC promotes hypoxia-induced mitophagy in B cells. Immunoblot analysis of TIMM23 and TOMM20 in ctr or MEC transfectants expressing wild-type p66SHC (p66), under normoxic (Norm.) or hypoxic conditions (8–48 h 1% O2). ACTB was used as a loading control. The histograms in the lower part show the quantification of the relative TIMM23 and TOMM20 levels in each transfectant over time (n = 3). The levels of TOMM20 are comparable in ctr and p66 cells under normoxia, while the levels of TIMM23 are 2.4 ± 0.3 fold (mean± SD, n = 3) higher in p66 cells compared to ctr cells under the same conditions. The data are expressed as mean± SD. ***P ≤ 0.001; **P ≤ 0.01; *P ≤ 0.05 (one-way ANOVA).
Figure 8.
Figure 8.
p66SHC recruits LC3B-II and p-AMPK to depolarized mitochondria. (A,B) Immunoblot analysis of ubiquitin (left panel) or LC3B and p-AMPK (central and right panel) in lysates from purified mitochondria of the ctr and p66 MEC transfectants (A) or of the MEC transfectants expressing GFP-tagged wild-type p66SHC (p66GFP) or the GFP-tagged p66SHC LIR mutant (p66GFP-mLIR) (B), untreated or treated for 1 h with OA (n ≥ 3). PHB was used to assess the purity of mitochondrial fractions. The histograms in the lower part of central and right panel A-B show the quantification of LC3B and p-AMPK in multiple experiments (n ≥ 3). (C) Immunoblot analysis of GFP-specific immunoprecipitates from lysates of purified mitochondria from the MEC transfectants expressing GFP-tagged wild-type p66SHC (p66GFP) or the GFP-tagged p66SHC LIR mutant (p66GFP-mLIR) (n ≥ 3). Mitochondrial lysates were included in each gel to identify the migration of the proteins tested. (D) Immunoblot analysis of GFP-specific immunoprecipitates from lysates of purified mitochondria from the MEC transfectants expressing GFP-tagged wild-type p66SHC (p66GFP), untreated or treated for 3 h with OA, alone or in combination with epoxomicin (n = 3). The immunoblots shown are representative of 3 independent experiments. The data are expressed as mean± SD. **P ≤ 0.01; *P ≤ 0.05 (one-way ANOVA).
Figure 9.
Figure 9.
p66SHC promotes the association of LC3B and p-AMPK with mitochondria. (A) Left, quantification of LC3B+ dots colocalizing with mitochondria (identified as TOMM20+ dots) in ctr and p66 cells untreated or treated for 1 h with OA (≥ 10 cells/sample, n = 3). Note that the levels of TOMM20, which as an OMM protein undergoes degradation during mitophagy, were not affected at this time point, as assessed by immunoblot of purified mitochondria (87±0.07% in OA-treated vs vehicle-treated ctr cells; 94±0.14% in OA-treated vs vehicle-treated p66 cells). Right, quantification of non-mitochondrial LC3B+ dots (LC3B+ TOMM20-) in ctr and p66 cells untreated or treated for 1 h with OA (≥ 10 cells/sample, n = 3). Representative images (medial optical sections) are shown below each histogram. (B) Left, quantification of p-AMPK+ dots colocalizing with mitochondria (TOMM20+) in ctr and p66 cells untreated or treated for 1 h with OA (≥ 10 cells/sample, n = 3). Right, quantification of non-mitochondrial p-AMPK+ dots (p-AMPK+ TOMM20-) in ctr and p66 cells untreated or treated for 1 h with OA (≥ 10 cells/sample, n = 3). Representative images (medial optical sections) are shown below each histogram. The insets in the bottom left corner of the corresponding image in panels A and B are shown at a higher magnification (x 2.5). Size bar: 5 μm. The data are expressed as mean± SD. ****P ≤ 0.0001; ***P ≤ 0.001; *P ≤ 0.05 (one-way ANOVA).
Figure 10.
Figure 10.
p66SHC promotes mitochondria ubiquitination and PRKN recruitment. (A) Left, quantification of ubiquitin+ dots colocalizing with mitochodria (TOMM20+) in ctr and p66 cells untreated or treated for 1 h with OA (≥ 10 cells/sample, n = 3). Right, quantification of non-mitochondrial ubiquitin dots (Ub+ TOMM20-) in ctr and p66 cells untreated or treated for 1 h with OA (≥ 10 cells/sample, n = 3). Representative images (medial optical sections) are shown below each histogram. (B) Left, quantification of PRKN+ dots colocalizing with TOMM20+ in ctr and p66 cells untreated or treated for 1 h with OA (≥ 10 cells/sample, n = 3). Right, quantification of non-mitochondrial PRKN+ dots (PRKN+ TOMM20-) in ctr and p66 cells dots (≥ 10 cells/sample, n = 3). Representative images (medial optical sections) are shown below each histogram. The insets in the bottom left corner of the corresponding image in panels A and B are shown at a higher magnification (x 2.5). Size bar: 5 μm. The data are expressed as mean± SD. ****P ≤ 0.0001; *P ≤ 0.05 (one-way ANOVA).
Figure 11.
Figure 11.
p66SHC limits B cell differentiation to plasma cells. Flow cytometric analysis of differentiation of splenic B cells from wild-type (WT) and p66shc-/- mice (n ≥ 4/group) monitored by SDC1/CD138 and IgG1 expression on day 4 following activation with lipopolysaccharide (LPS) in the presence of IL4 (to induce CSR) or IL5 (to induce plasma cell differentiation). The histograms show the percentages of SDC1/CD138+ (plasma cells) and IgG1+ (class-switched cells) cells. The data are expressed as mean± SD. ***P ≤ 0.001; *P ≤ 0.05 (Student’s t-test).

Similar articles

Cited by

  • Kaempferol Protects Cell Damage in In Vitro Ischemia Reperfusion Model in Rat Neuronal PC12 Cells.
    Zhou YP, Li GC. Zhou YP, et al. Biomed Res Int. 2020 Apr 23;2020:2461079. doi: 10.1155/2020/2461079. eCollection 2020. Biomed Res Int. 2020. PMID: 32382538 Free PMC article.
  • Guidelines for the use and interpretation of assays for monitoring autophagy (4th edition)1.
    Klionsky DJ, Abdel-Aziz AK, Abdelfatah S, Abdellatif M, Abdoli A, Abel S, Abeliovich H, Abildgaard MH, Abudu YP, Acevedo-Arozena A, Adamopoulos IE, Adeli K, Adolph TE, Adornetto A, Aflaki E, Agam G, Agarwal A, Aggarwal BB, Agnello M, Agostinis P, Agrewala JN, Agrotis A, Aguilar PV, Ahmad ST, Ahmed ZM, Ahumada-Castro U, Aits S, Aizawa S, Akkoc Y, Akoumianaki T, Akpinar HA, Al-Abd AM, Al-Akra L, Al-Gharaibeh A, Alaoui-Jamali MA, Alberti S, Alcocer-Gómez E, Alessandri C, Ali M, Alim Al-Bari MA, Aliwaini S, Alizadeh J, Almacellas E, Almasan A, Alonso A, Alonso GD, Altan-Bonnet N, Altieri DC, Álvarez ÉMC, Alves S, Alves da Costa C, Alzaharna MM, Amadio M, Amantini C, Amaral C, Ambrosio S, Amer AO, Ammanathan V, An Z, Andersen SU, Andrabi SA, Andrade-Silva M, Andres AM, Angelini S, Ann D, Anozie UC, Ansari MY, Antas P, Antebi A, Antón Z, Anwar T, Apetoh L, Apostolova N, Araki T, Araki Y, Arasaki K, Araújo WL, Araya J, Arden C, Arévalo MA, Arguelles S, Arias E, Arikkath J, Arimoto H, Ariosa AR, Armstrong-James D, Arnauné-Pelloquin L, Aroca A, Arroyo DS, Arsov I, Artero R, Asaro DML, Aschner M, Ashrafizadeh M, Ashur-Fabian O, Atanasov AG, Au AK, Auberger P, Auner HW, Aurelian L, Autelli R… See abstract for full author list ➔ Klionsky DJ, et al. Autophagy. 2021 Jan;17(1):1-382. doi: 10.1080/15548627.2020.1797280. Epub 2021 Feb 8. Autophagy. 2021. PMID: 33634751 Free PMC article.
  • Low P66shc with High SerpinB3 Levels Favors Necroptosis and Better Survival in Hepatocellular Carcinoma.
    Fasolato S, Ruvoletto M, Nardo G, Rasola A, Sciacovelli M, Zanus G, Turato C, Quarta S, Terrin L, Fadini GP, Ceolotto G, Guido M, Cillo U, Indraccolo S, Bernardi P, Pontisso P. Fasolato S, et al. Biology (Basel). 2021 Apr 23;10(5):363. doi: 10.3390/biology10050363. Biology (Basel). 2021. PMID: 33922660 Free PMC article.
  • Hypoxic microenvironment in cancer: molecular mechanisms and therapeutic interventions.
    Chen Z, Han F, Du Y, Shi H, Zhou W. Chen Z, et al. Signal Transduct Target Ther. 2023 Feb 17;8(1):70. doi: 10.1038/s41392-023-01332-8. Signal Transduct Target Ther. 2023. PMID: 36797231 Free PMC article. Review.
  • The role of radiotherapy-related autophagy genes in the prognosis and immune infiltration in lung adenocarcinoma.
    Gao J, Lu F, Yan J, Wang R, Xia Y, Wang L, Li L, Chang L, Li W. Gao J, et al. Front Immunol. 2022 Oct 13;13:992626. doi: 10.3389/fimmu.2022.992626. eCollection 2022. Front Immunol. 2022. PMID: 36311724 Free PMC article.

References

    1. Boya P, Reggiori F, Codogno P.. Emerging regulation and functions of autophagy. Nat Cell Biol. 2013;15:713–720. - PMC - PubMed
    1. Kim J, Kundu M, Viollet B, et al. AMPK and MTOR regulate autophagy through direct phosphorylation of Ulk1. Nat Cell Biol. 2011;13:132–141. - PMC - PubMed
    1. Egan DF, Shackelford DB, Mihaylova MM, et al. Phosphorylation of ULK1 (hATG1) by AMP-activated protein kinase connects energy sensing to mitophagy. Science. 2011;331:456–461. - PMC - PubMed
    1. He C, DJ Klionsky. Regulation Mechanisms and Signaling pathways of autophagy. Annu Rev Genet. 2010;43:67–93. - PMC - PubMed
    1. Russell RC, HX Yuan and KL Guan. Autophagy regulation by nutrient signaling. Cell Research. 2014;24:42–57. - PMC - PubMed

Publication types

MeSH terms