. 2018 Nov 1;120(5):2296-2310.
doi: 10.1152/jn.00906.2017. Epub 2018 Aug 15.

Neuronal population mechanisms of lightness perception

Affiliations

Neuronal population mechanisms of lightness perception

Douglas A Ruff et al. J Neurophysiol. .

Abstract

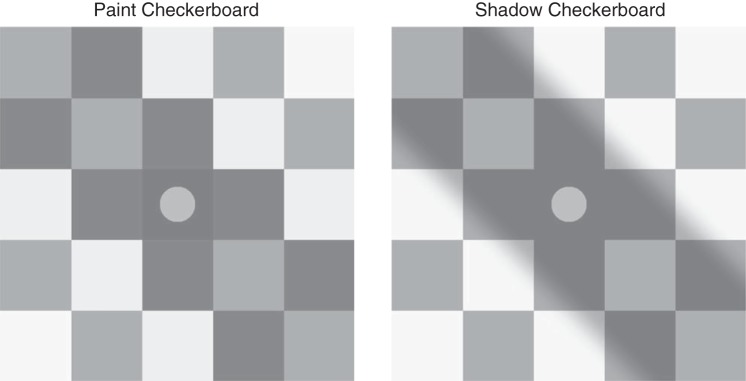
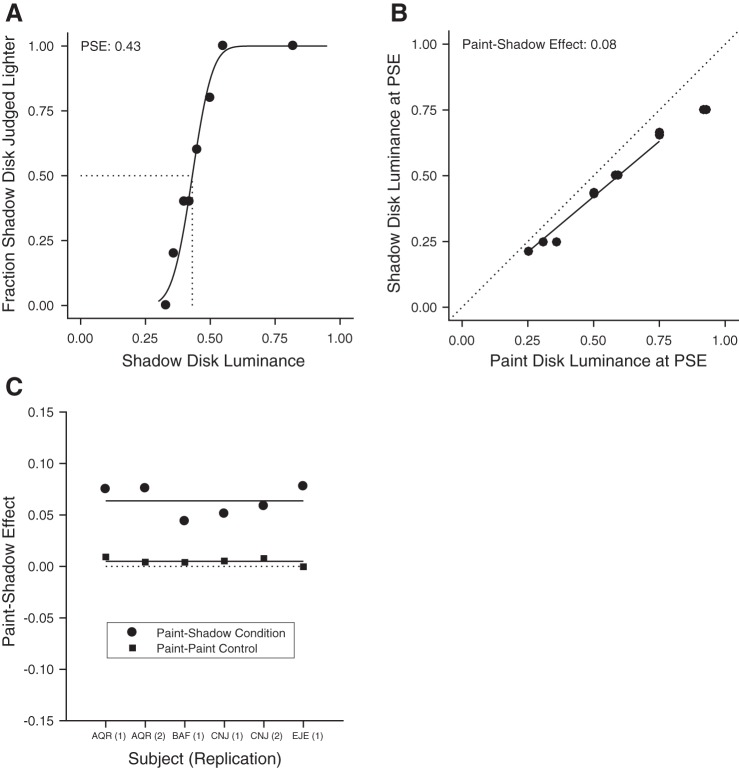
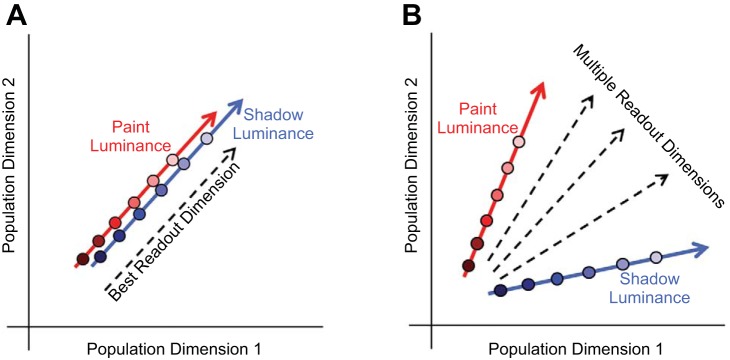
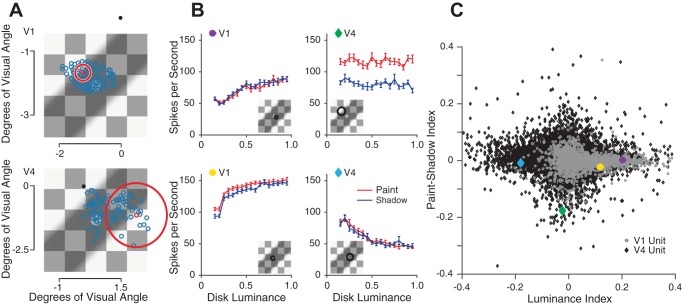
The way that humans and animals perceive the lightness of an object depends on its physical luminance as well as its surrounding context. While neuronal responses throughout the visual pathway are modulated by context, the relationship between neuronal responses and lightness perception is poorly understood. We searched for a neuronal mechanism of lightness by recording responses of neuronal populations in monkey primary visual cortex (V1) and area V4 to stimuli that produce a lightness illusion in humans, in which the lightness of a disk depends on the context in which it is embedded. We found that the way individual units encode the luminance (or equivalently for our stimuli, contrast) of the disk and its context is extremely heterogeneous. This motivated us to ask whether the population representation in either V1 or V4 satisfies three criteria: 1) disk luminance is represented with high fidelity, 2) the context surrounding the disk is also represented, and 3) the representations of disk luminance and context interact to create a representation of lightness that depends on these factors in a manner consistent with human psychophysical judgments of disk lightness. We found that populations of units in both V1 and V4 fulfill the first two criteria but that we cannot conclude that the two types of information in either area interact in a manner that clearly predicts human psychophysical measurements: the interpretation of our population measurements depends on how subsequent areas read out lightness from the population responses. NEW & NOTEWORTHY A core question in visual neuroscience is how the brain extracts stable representations of object properties from the retinal image. We searched for a neuronal mechanism of lightness perception by determining whether the responses of neuronal populations in primary visual cortex and area V4 could account for a lightness illusion measured using human psychophysics. Our results suggest that comparing psychophysics with population recordings will yield insight into neuronal mechanisms underlying a variety of perceptual phenomena.

Keywords: lightness; population coding; psychophysics; visual cortex.


Figures

Fig. 1.
Fig. 1.
Paint and shadow checkerboard stimuli. The paint checkerboard is shown on the left and the shadow checkerboard on the right. The mean luminance of each corresponding square in the 2 checkerboards is identical, as is the luminance of the disks. Nevertheless, the disk in the shadow checkerboard appears lighter. This effect demonstrates the paint-shadow illusion for our stimuli. The disks illustrated have a luminance of 0.5.
Fig. 2.
Fig. 2.
Human psychophysical experiments quantify the paint-shadow effect. A: results from an example psychophysical session for 1 subject (AQR). The fraction of times that the test disk (in the shadow context) was judged lighter than the reference (in the paint context) is plotted as a function of test disk luminance. The reference disk luminance was 0.5. To produce the plotted points, test luminances generated by the staircase procedure were sorted and aggregated into groups of trials; the black line through the plotted points is the maximum likelihood cumulative normal fit to the individual-trial data. The point of subjective equality (PSE) obtained from the fit is shown by the dashed line. The data quantify the observation that disks appear lighter in the shadow checkerboard than in the paint checkerboard (see Fig. 1), as the luminance of the PSE is less than that of the reference. B: paint-shadow effect for 1 subject (AQR) for data aggregated across 2 sessions. Each point represents a pair of disk luminances that match in appearance when 1 is presented in the paint context (x-axis) and the other in the shadow context (y-axis). For trials where the reference was in the paint context, the PSE is plotted against test luminance. For these trials, the PSE is generally less than that of the test, as in the case shown in A. For trials where the reference disk was in the shadow context, the test disk luminance is plotted against the PSE. This reversal keeps the sign of the effect shown in the figure consistent across the 2 types of trials. The paint-shadow effect is taken as the log10 of the slope of the best fit line to the data, with the line constrained to pass through the origin (best fit line shown). For these data, the slope is 0.84 corresponding to a paint shadow effect of 0.08. This indicates that the disks of the same luminance appear lighter in the shadow context than in the paint context. The line was fit using a least-squares criterion with the fit restricted to points on the x-axis in the range between 0.25 and 0.75. C: summary of psychophysical paint-shadow effect. For each subject/determination, the paint-shadow effect, taken as the negative log10 of the slope, is shown as a solid circle. Across subjects/determinations, the mean paint-shadow effect is 0.06. For comparison, paint-shadow effects obtained from control conditions where both disks were presented in the paint context are shown as solid squares. As expected, these lie close to 0 (mean value of 0.005).
Fig. 3.
Fig. 3.
Schematic of candidate population neuronal mechanisms underlying the paint-shadow effect. These schematics depict 2 possible neuronal representations that could fulfill the criteria for an underpinning of the paint-shadow effect. Population activity in response to a single luminance/context condition is represented in each schematic as a single point in a neuronal population space. Each dimension in this space may be thought of as representing the firing rate of 1 of the simultaneously recorded neurons. In both schematics, the luminance of paint stimuli is encoded along the direction represented by the red arrow and the luminance of shadow stimuli is encoded along the direction represented by the blue arrow. A: population activity for paint and shadow stimuli lies along a common locus in the same neuronal subspace, as disk luminance is varied. The best linear decoding dimension for stimulus luminance is illustrated by the dashed black line. In this case, luminance decoding for disks in shadow would be higher than that for disks in paint to the degree that the response for disks in shadow are shifted upwards along the common direction of variation in neuronal response space, and this neuronal paint-shadow effect would be observed for any reasonable luminance readout direction. B: population activity for paint and shadow stimuli varies along separate directions. Decoding luminance by projecting the neuronal response onto any of the dimensions represented by the dashed black lines would give high-fidelity luminance information that is modulated by paint-shadow context, with the degree and direction of the effect of the resulting paint-shadow effect determined by the choice of decoding dimension as well as exactly where responses for each disk luminance fell along the paint and shadow response directions (red and blue lines, respectively).
Fig. 4.
Fig. 4.
Responses to paint and shadow checkerboard stimuli are heterogeneous across the population. A: example receptive field (RF) locations from a single session of V1 data (top) and V4 data (bottom) overlaid on an example stimulus. RF center locations were estimated by flashing small Gabor stimuli in a grid of positions while the monkey was rewarded for passively fixating. The black dot represents the fixation spot during the checkerboard stimulus presentation. The blue circles represent estimated RF center locations. The large red circle represents the estimated size of 1 example unit’s RF, with the RF center location drawn as the small red circle. Across sessions, the size, position and rotation of the checkerboard stimuli were varied. B: luminance response plots for 4 example units. The brain area of these example units is denoted by the shape of the colored insets (circles: V1; diamonds: V4). An estimate of the size and location of each unit’s receptive field, relative to the checkerboard stimulus, is shown in the insets. C: scatter plot of paint-shadow indexes vs. luminance indexes for all V1 and V4 units (gray circles, 1,744 units; black diamonds, 11,063 units, respectively). The paint-shadow index was calculated using averaged responses to all disk luminances sorted by whether the stimulus was from the paint or shadow set, using the equation (shadow-paint)/(shadow + paint). Median population value for V1 = 0.0015, V4 = 0.0049. The luminance index was calculated using averaged responses from only the paint trials with disk luminances at 0.25 and 0.75 using the equation (resp75 − resp25)/(resp7 + resp25). Median population value for V1 = 0.037 and V4 = −0.010.
Fig. 5.
Fig. 5.
Neuronal and psychophysical sensitivity show similar dependence on reference luminance. A: average precision of population encoding of luminance as a function of number of units, for each reference luminance for V1 (left, 18 sessions) and V4 data (right, 137 sessions). Performance of a neuronal decoder at discriminating 0.10 luminance increments as a function of the reference luminance and the number of units included. Data points represent the mean across all paint trials for data sets from V1 and V4 for 10,000 random draws per base luminance and population size, per data set. Error bars are the SE of the mean across data sets. B: for the conditions where both disks were presented in the paint checkerboard, this plot shows the average (across subjects/determinations) probability of correctly judging a luminance increment of 0.10 as lighter, for the three reference luminances (0.25, 0.50, and 0.75) used in the psychophysical studies. These data are taken from the paint-paint checkerboard pairings. Error bars show ±1 SE taken across subjects/determinations (n = 6, see Fig. 2C).
Fig. 6.
Fig. 6.
Population response trajectories for both V1 and V4 reveal consistent separation of responses for both context and disk luminance across the response period. Averaged responses from all conditions were combined across sessions for all recorded units. Gaussian process factor analysis was used (20-ms bin size) to identify the dimensions of population activity that explained the most variance in population responses. Linear discriminant analysis was used to select the single projection that best separates all stimulus conditions for each area. These plots show the trajectories (averaged over all trials and all data sets, 18 sessions for V1, 137 sessions for V4) in each brain area for each of the luminances ranging between 0.25 and 0.75, and context during the beginning (left), middle (middle), and end (right) of each stimulus presentation.
Fig. 7.
Fig. 7.
Computing a neuronal paint-shadow effect. A: decoded luminance for paint and shadow stimuli, from a single session (monkey JD, V4). The x-axis shows the stimulus luminance while the y-axis shows the decoded luminance. A single decoder was constructed to minimize root mean squared error (RMSE) for both stimulus types, with the results plotted separately for paint (red) and shadow (blue). Error bars show ±1 SE and are often smaller than the plotted points. The smooth curves through the data are a fit affine scaling of the cumulative distribution of the β-probability density, a functional form chosen for convenience and not for theoretical significance. B: paint-shadow effect derived from the decodings shown in A. Using the smooth fits to the decoded luminance, we found the disk luminances in shadow that were decoded to the same luminances as disk luminances in paint of 0.25 0.35, 0.45, 0.55, 0.65, and 0.75. These disk luminances are plotted, with decoded paint luminance on the x-axis and matched decoded shadow luminance on the y-axis. A line through the origin was fit through these points and the negative log10 of the slope of this line taken as the paint-shadow effect, 0.05, for the decodings shown in A. C: same as in A but for a session from a different monkey and visual area (monkey ST, V1). D: same as in B, for the decoding shown in C. Here the paint-shadow effect is 0.01.
Fig. 8.
Fig. 8.
Decoding reveals large range of possible paint-shadow effects. A: single V4 session example of paint-shadow effect as a function of decoding root mean squared error (RMSE). The points shown as black circles represent cases where the decoding RMSE is less than 5% larger than its minimum value. We took as the plausible range of paint-shadow effects for this session the range corresponding to the black points. B: summary across all included V1 sessions (n = 18) of the range of obtainable neuronal paint-shadow effects as a function of decoding RMSE for each session. For each session, the ordinate of the plotted point is the paint-shadow effect from the decoding that had minimum decoding RMSE, while the abscissa is that minimum decoding RMSE (obtained for each session across the set of decoders examined for that session). The range bars extending from each point show the range of paint-shadow effects corresponding to the decoders where the RMSE was no more than 5% greater than the minimum. The psychophysically determined paint-shadow effect is denoted by the solid black horizontal line. The dashed black horizontal line indicates a value of 0. Black circles: monkey ST; gray squares: monkey BR. C: summary across all included V4 sessions (n = 137), same format as B. Black circles: monkey SY; gray squares: monkey JD.

References

    1. Adelson EH. Lightness perception and lightness illusions. In: The New Cognitive Neurosciences (2nd ed.), edited by Gazzaniga M. Cambridge, MA: MIT Press, 2000, p. 339–351
    1. Boyaci H, Fang F, Murray SO, Kersten D. Responses to lightness variations in early human visual cortex. Curr Biol 17: 989–993, 2007. doi:10.1016/j.cub.2007.05.005. - DOI - PMC - PubMed
    1. Boyaci H, Fang F, Murray SO, Kersten D. Perceptual grouping-dependent lightness processing in human early visual cortex. J Vis 10: 4, 2010. doi:10.1167/10.9.4. - DOI - PubMed
    1. Brainard DH. The Psychophysics Toolbox. Spat Vis 10: 433–436, 1997. doi:10.1163/156856897X00357. - DOI - PubMed
    1. Brainard DH, Pelli D, Robson T. Display characterization. In Encylopedia of Imaging Science and Technology, edited by Hornak J. New York: Wiley, 2002, p. 172–188. doi:10.1002/0471443395.img011 - DOI

Publication types

LinkOut - more resources