. 2018 Aug 15;13(8):e0201681.
doi: 10.1371/journal.pone.0201681. eCollection 2018.

Cellular reagents for diagnostics and synthetic biology

Affiliations

Cellular reagents for diagnostics and synthetic biology

Sanchita Bhadra et al. PLoS One. .

Abstract

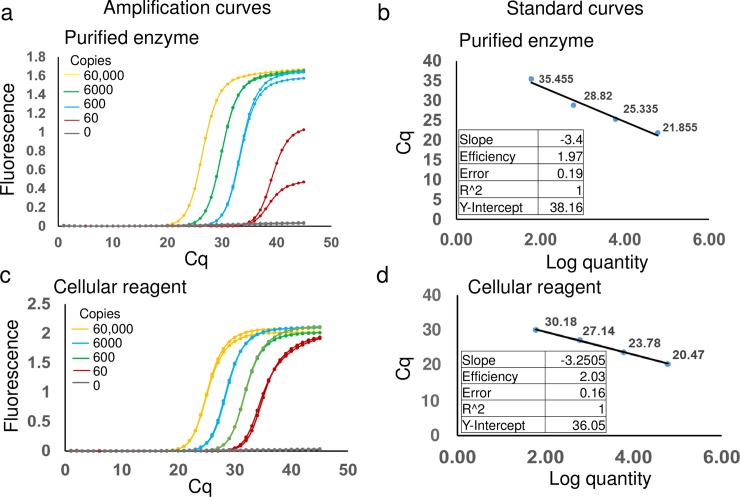
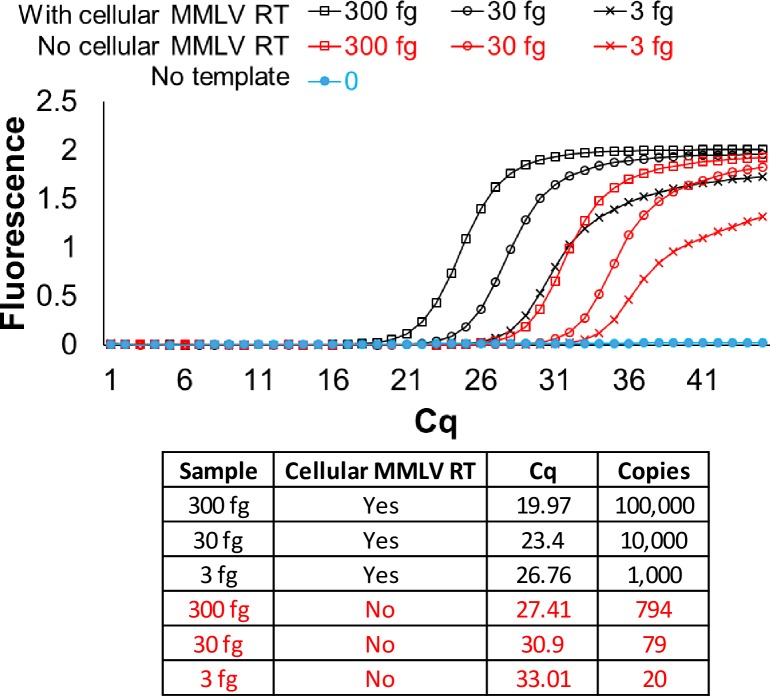
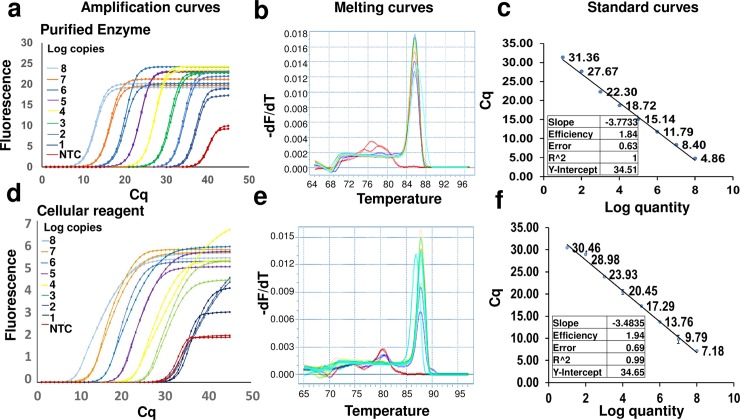
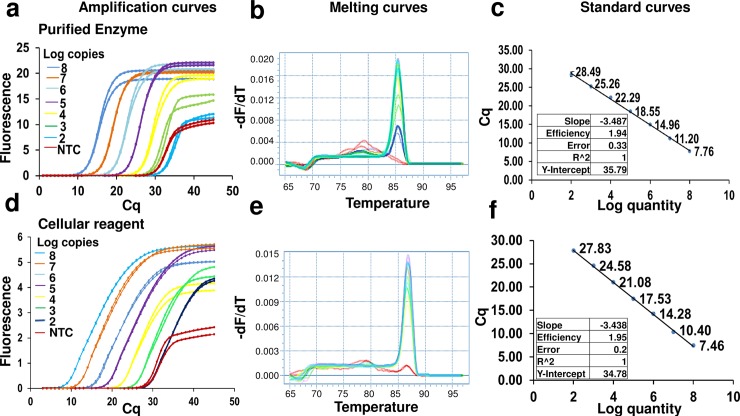
We have found that the overproduction of enzymes in bacteria followed by their lyophilization leads to 'cellular reagents' that can be directly used to carry out numerous molecular biology reactions. We demonstrate the use of cellular reagents in a variety of molecular diagnostics, such as TaqMan qPCR with no diminution in sensitivity, and in synthetic biology cornerstones such as the Gibson assembly of DNA fragments, where new plasmids can be constructed solely based on adding cellular reagents. Cellular reagents have significantly reduced complexity and cost of production, storage and implementation, features that should facilitate accessibility and use in resource-poor conditions.


Conflict of interest statement

The authors have declared that no competing interests exist.

Figures

Fig 1
Fig 1. TaqMan qPCR analysis using lyophilized Taq DNA polymerase cellular reagents.
Indicated copies of synthetic DNA templates derived from Zika virus genomic sequence were amplified using 2.5 units of pure commercial Taq DNA polymerase (panels a and b) or 2 x 10⁷ cells of rehydrated cellular reagents expressing Taq DNA polymerase (panels c and d). Amplification was assessed in real-time by measuring increase in TaqMan probe fluorescence over time. Representative amplification curves generated using the “Abs quant” analysis in the LightCycler 96 software are depicted in panels a and c. Amplification curve colors distinguish starting template copies–yellow: 60,000 template copies; green: 6000 template copies; blue: 600 template copies; red: 60 template copies; and gray: no template control. These curves depict the real-time kinetics of PCR amplification mediated by pure versus cellular reagents. The corresponding standard curve analyses performed using the “Abs quant” protocol in the LightCycler 96 software are depicted in panels b and d, respectively. Standard curve analyses data for comparing amplification efficiency, linearity, and error are tabulated as insets.
Fig 2
Fig 2. RNA detection by two-step reverse transcription TaqMan qPCR using cellular reagents for MMLV RT and Taq DNA polymerase.
Indicated copies of synthetic RNA template derived from Zika virus genomic sequence were tested using 2 x 10⁷ cells each of MMLV RT and Taq DNA polymerase lyophilized cellular reagents. Amplification was assessed in real-time by measuring increase in TaqMan probe fluorescence over time. Representative amplification curves generated using the “Abs quant” analysis in the LightCycler 96 software are presented. Color of the traces indicate presence (black traces) or absence (red traces) of MMLV RT cellular reagents, or the absence of templates (blue traces). The corresponding derivation of template copies from Cq analyses are tabulated. Cq values were converted to template copies using standard curve analyses of the same RNA samples with commercial qRT-PCR master mix (S8 Fig).
Fig 3
Fig 3. EvaGreen qPCR analysis using KlenTaq DNA polymerase expressing cellular reagents.
Indicated copies of synthetic Chlamydia trachomatis DNA template were amplified by PCR using 0.2 μL of pure commercial KlenTaq DNA polymerase (panels a, b, and c) or 2 x 10⁷ cells of KlenTaq cellular reagents (panels d, e, and f). Amplicon accumulation was assessed in real time by measuring increase in EvaGreen fluorescence. Panels a and d depict representative amplification curves generated using the “Abs quant” analysis in the LightCycler 96 software. Colors of the curve traces indicate starting numbers of template copies–black: 6x10⁶ template copies; blue: 6x10⁵ template copies; red; 6x10⁴ template copies; green: 6x10³ template copies; pink: 600 template copies; purple: 60 template copies; yellow: 6 template copies; and cyan: no templates. Taken together, these curves demonstrate the real-time kinetics of PCR amplification. Since EvaGreen is a non-specific DNA intercalating dye, the fidelity of amplicon generation was verified by determining their melting temperatures (panels b and e) using the “Tm calling” analysis protocol in the LightCycler 96 software. Color coding of the curves is the same as in panels a and d. The overlapping melting temperature peaks of amplicons generated from 6 x 10⁶ to 60 copies of templates are indicative of correctly amplified PCR products. Amplification curves observed in the presence of 0 to 6 template copies are non-specific as evident from their different melting temperatures peaks of these amplicons. Standard curve analyses performed using the “Abs quant” protocol in the LightCycler 96 software are depicted in panels c and f, respectively, and data for amplification efficiency, linearity, and error are tabulated as insets.
Fig 4
Fig 4. EvaGreen qPCR analysis using RTX Exo- DNA polymerase expressing cellular reagents.
Indicated copies of synthetic Zika virus derived DNA template were amplified by PCR using 80 ng of pure RTX Exo- DNA polymerase (panels a, b, and c) or 2 x 10⁶ cells of RTX Exo- cellular reagents (panels d, e, and f). Amplicon accumulation was assessed in real time by measuring increase in EvaGreen fluorescence. Representative amplification curves using 108, 107, 106, 105, 104, 103, 102, 10 and 0 template DNA copies are shown in panels a and d. ‘NTC’ refers to no template control. These curves were generated using the “Abs quant” analysis protocol in the LightCycler 96 software. The corresponding amplicon melting temperature analyses performed using the “Tm calling” protocol in the LightCycler 96 software are shown in panels b and e. The melting temperature peaks of target-derived amplicons are distinct from those of non-specific amplicons generated in the absence of templates. Standard curve analyses performed using the “Abs quant” protocol in the LightCycler 96 software are depicted in panels c and f. Standard curve analyses data for comparing amplification efficiency, linearity, and error are tabulated as insets.
Fig 5
Fig 5. EvaGreen qRT-PCR analysis using RTX Exo- DNA polymerase expressing cellular reagents.
Indicated copies of synthetic Zika virus derived RNA template were amplified by RT-PCR using 80 ng of pure RTX Exo- DNA polymerase (panels a, b, and c) or 2 x 10⁶ cells of RTX Exo- cellular reagents (panels d, e, and f). Amplicon accumulation was assessed in real time by measuring increase in EvaGreen fluorescence. Representative amplification curves using 108, 107, 106, 105, 104, 103, 102, 10 and 0 template RNA copies are shown in panels a and d. These curves were generated using the “Abs quant” analysis protocol in the LightCycler 96 software. ‘NTC’ refers to no template control. The corresponding amplicon melting temperature analyses performed using the “Tm calling” protocol in the LightCycler 96 software are shown in panels b and e. The melting temperature of non-specific amplicons generated in the absence of templates is distinct from target-derived amplicons. Standard curve analyses performed using the “Abs quant” protocol in the LightCycler 96 software are depicted in panels c and f. Standard curve analyses data for comparing amplification efficiency, linearity, and error are tabulated as insets.
Fig 6
Fig 6. Isothermal nucleic acid amplification using Bst DNA polymerase cellular reagents.
Indicated copies of synthetic DNA templates derived from human glyceraldehyde 3-phosphate dehydrogenase gene were amplified in LAMP-OSD reactions using 16 units of pure Bst-LF (panel a), 16 units of pure Bst 2.0 (panel b), or 2 x 10⁷ cells of Bst-LF cellular reagents (panel c). Amplicon accumulation was assessed in real time by measuring increase in OSD fluorescence. Representative raw fluorescence amplification curves are depicted in black (6 x 10⁶ template copies), blue (6 x 10⁵ template copies), red (6 x 10⁴ template copies), green (6 x 10³ template copies), pink (600 template copies), purple (60 template copies), yellow (6 template copies), and cyan (0 templates). Cq values obtained using pure commercial Bst-LF (panel a), pure commercial Bst 2.0 (panel b), and Bst-LF cellular reagent (CR) (panel c) are tabulated. Unlike PCR, LAMP is a complex continuous amplification process in which Cq does not always correlate linearly with template copies.
Fig 7
Fig 7. PCR and Gibson assembly using cellular reagents.
(a) Schematic depicting cellular PCR followed by cellular Gibson assembly for constructing new plasmids. Bacteria harboring target plasmids are mixed with polymerase-expressing cellular reagents and PCR is initiated by adding appropriate primers, buffer, and dNTP. The resulting PCR products are incubated with cellular reagents expressing Gibson assembly enzymes–Taq DNA polymerase, Taq DNA ligase, and T5 exonuclease–to assemble the new construct. (b) Cellular PCR amplification of vector and insert fragments directly from E. coli bacteria bearing target DNA plasmids using 2 x 10⁷ cells of Phusion cellular reagents. Assembly parts include: (i) “pATetO 6XHis full length” vector for two part assembly with Kanr cassette bearing appropriate overlapping ends, and (ii) “pUC19 Fragments 1 and 2” for three part assembly with Kanr cassette whose ends overlap with pUC19 vector fragments. (c) Gibson assembly of agarose gel purified and unpurified cellular PCR products using pure or cellular Gibson assembly reagents. In “negative control” samples the PCR products were incubated in Gibson reaction buffer without pure or cellular Gibson enzymes. “pATetO 6XHis + Kanr”represents a two part Gibson assembly while “Puc19 Fragment 1 + pUC19 Fragment 2 + Kanr” represents a three-part Gibson assembly. Representative number of clones recovered in each case in the presence of both ampicillin and kanamycin are reported.

References

    1. Rittie L and Perbal B (2008) Enzymes used in molecular biology: a useful guide. J Cell Commun Signal 2: 25–45. 10.1007/s12079-008-0026-2 - DOI - PMC - PubMed
    1. Treacy DJ, Sankaran SM, Gordon-Messer S, Saly D, Miller R, Isaac RS, et al. (2011) Implementation of a Project-Based Molecular Biology Laboratory Emphasizing Protein Structure-Function Relationships in a Large Introductory Biology Laboratory Course. Cbe-Life Sciences Education 10: 18–24. 10.1187/cbe.10-07-0085 - DOI - PMC - PubMed
    1. Garibyan L and Avashia N (2013) Polymerase chain reaction. J Invest Dermatol 133: 1–4. - PMC - PubMed
    1. Zhao YX, Chen F, Li Q, Wang LH and Fan CH (2015) Isothermal Amplification of Nucleic Acids. Chem Rev 115: 12491–12545. 10.1021/acs.chemrev.5b00428 - DOI - PubMed
    1. Casini A, Storch M, Baldwin GS and Ellis T (2015) Bricks and blueprints: methods and standards for DNA assembly. Nature Reviews Molecular Cell Biology 16: 568–576. 10.1038/nrm4014 - DOI - PubMed

Publication types