Review
. 2019 Jan 21;20(2):178-196.
doi: 10.1002/cphc.201800602. Epub 2018 Sep 3.

Distance-independent Cross-correlated Relaxation and Isotropic Chemical Shift Modulation in Protein Dynamics Studies

Affiliations
Review

Distance-independent Cross-correlated Relaxation and Isotropic Chemical Shift Modulation in Protein Dynamics Studies

Beat Vögeli et al. Chemphyschem. .

Abstract

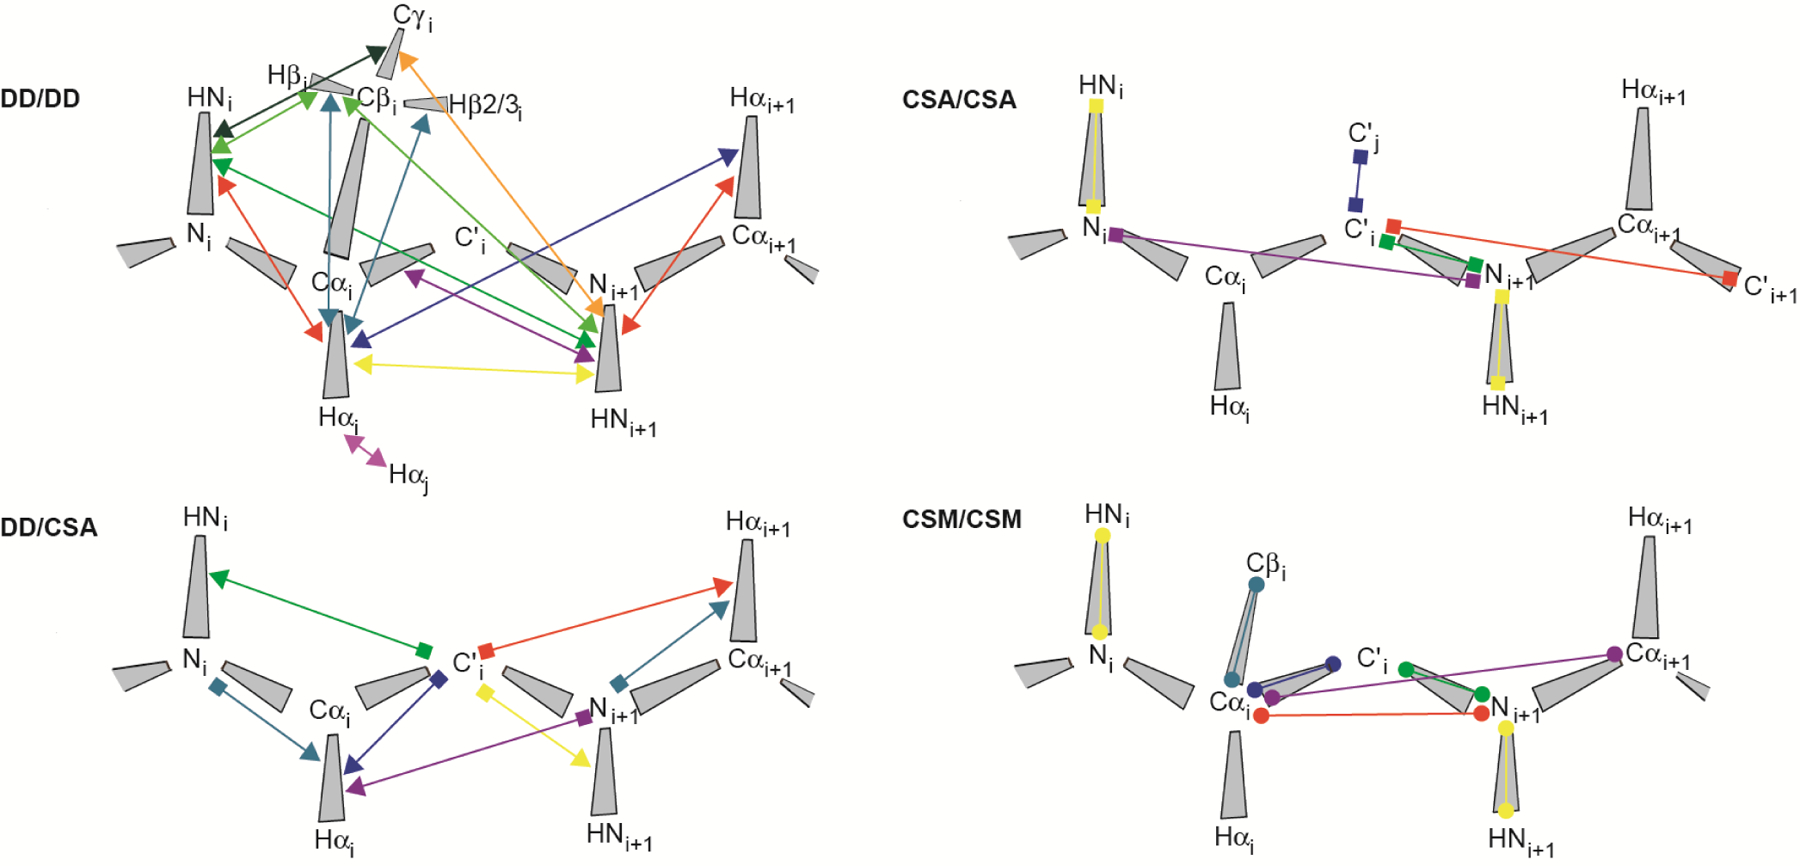
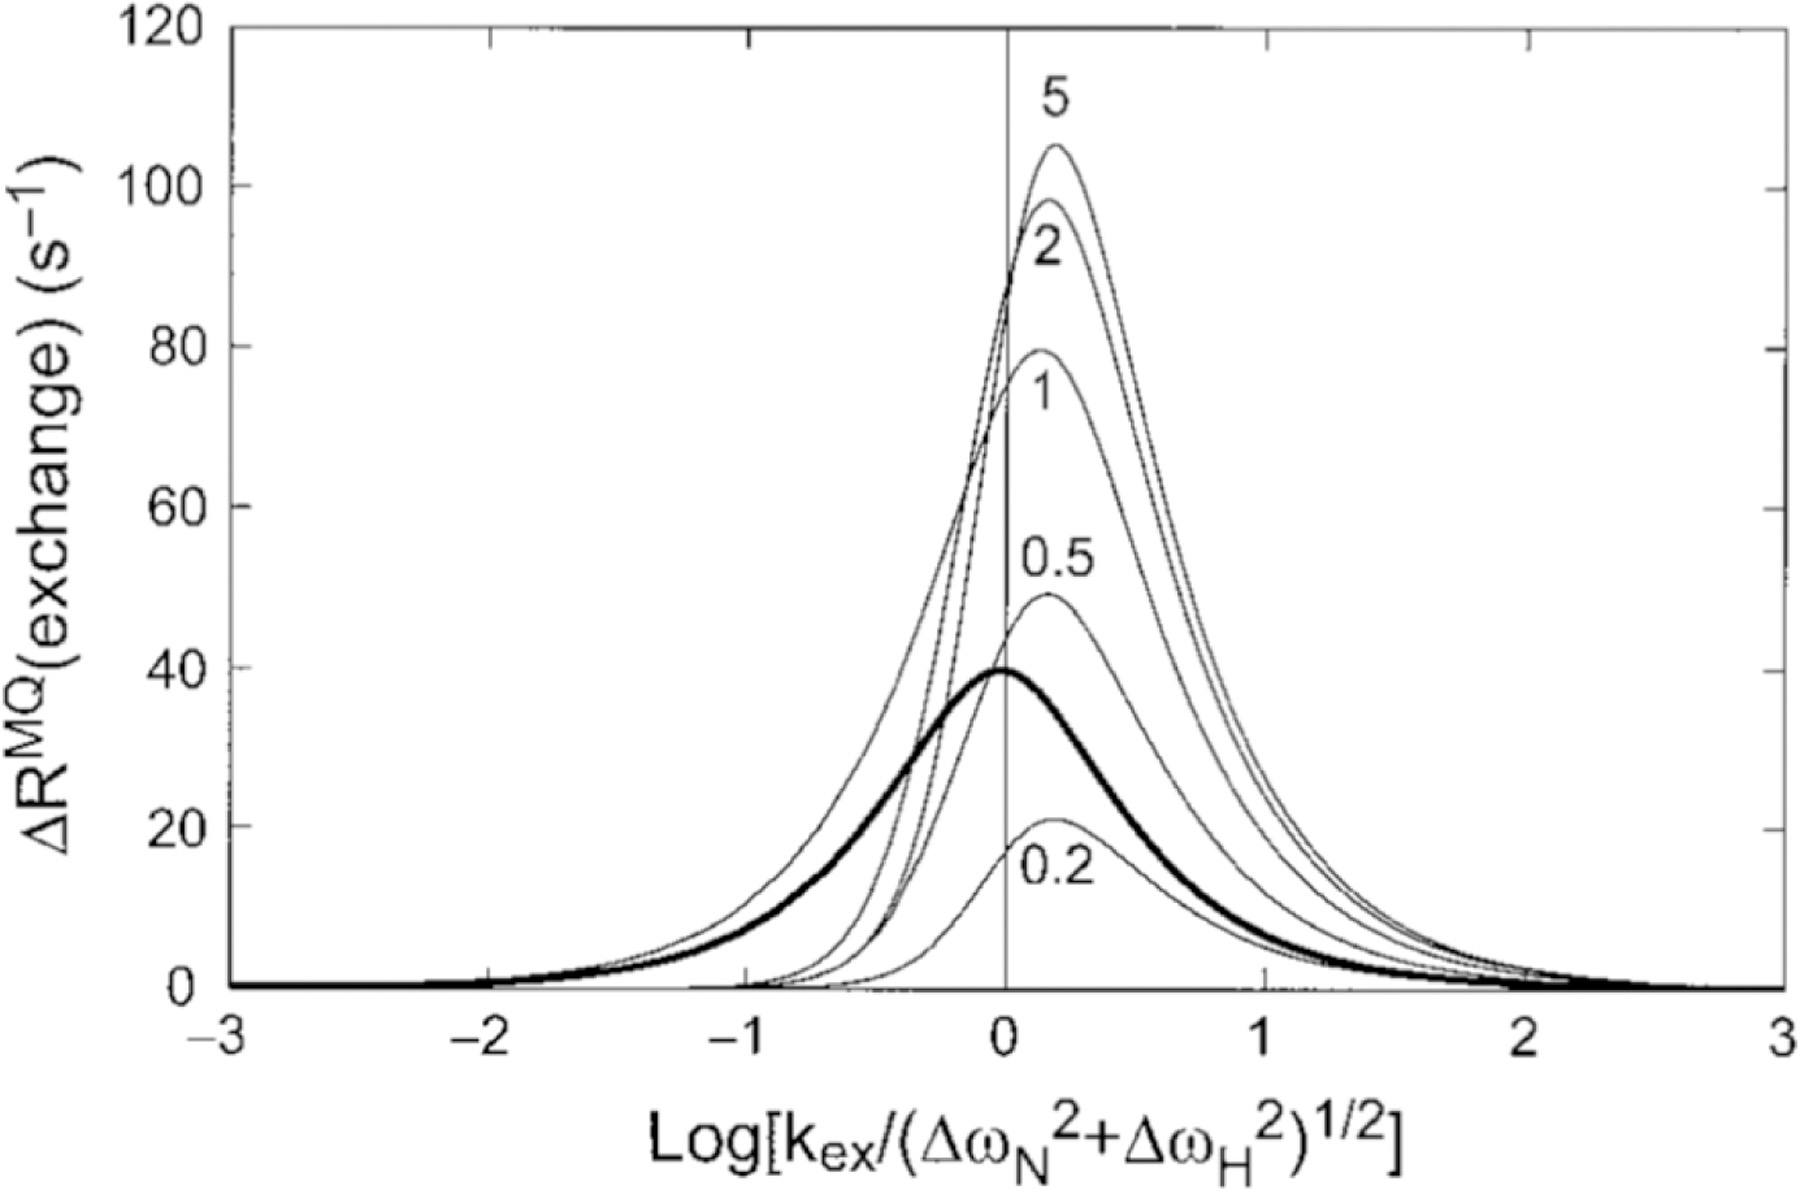
Cross-correlated relaxation (CCR) in multiple-quantum coherences differs from other relaxation phenomena in its theoretical ability to be mediated across an infinite distance. The two interfering relaxation mechanisms may be dipolar interactions, chemical shift anisotropies, chemical shift modulations or quadrupolar interactions. These properties make multiple-quantum CCR an attractive probe for structure and dynamics of biomacromolecules not accessible from other measurements. Here, we review the use of multiple-quantum CCR measurements in dynamics studies of proteins. We compile a list of all experiments proposed for CCR rate measurements, provide an overview of the theory with a focus on protein dynamics, and present applications to various protein systems.

Keywords: biomacromolecules; correlated motion; cross-correlated relaxation; multiple-quantum coherence; protein dynamics.


Figures

Figure 1.
Figure 1.
Measured cross-correlated relaxation and isotropic chemical shift modulation. The colored lines connect atoms or atom pairs which are involved in the mechansims giving rise to the interferences. Arrow heads, squares and spheres indicate dipolar interaction (dipole/dipole, DD), chemical shift anisotropy (CSA) and isotropic chemical shift modulation (CSM), respectively. The types of experiment used for measurement and references are given in Table 1.
Figure 2.
Figure 2.
Correlation plots of experimental and predicted dipolar CCR rates based on a rigid GB3 model. RDD(I1I2)/DD(S1S2) + RDD(I1S2)/DD(S1I2) is abbreviated by R. HNN/HNN and HαCα/HαCα rates are shown on the top left and right, respectively, and intraresidual and sequential HNN/HαCα rates at the bottom left and right. The theoretical rates are calculated under the assumption of anisotropic overall tumbling. The effective HN–N and Hα–Cα bond lengths are 1.02 and 1.09 Å, respectively. Linear regressions shown in red are uniform heuristic order parameters as given in equation 18. The most extreme outliers are indicated in red. The black lines indicate a slope of 1. Reprinted by permission from Springer Nature: B. Vögeli, Cross-correlated relaxation rates between protein backbone H-X dipolar interactions, J. Biomol. NMR 2017, 67, 211–232, copyright 2017.
Figure 3.
Figure 3.
Correlation plots of experimental and predicted dipolar CCR rates based on a dynamic GB3 model. RDD(I1I2)/DD(S1S2) + RDD(I1S2)/DD(S1I2) is abbreviated by R. HNN/HNN and HαCα/HαCα rates are shown on the top left and right, respectively, and intraresidual and sequential HNN/HαCα rates at the bottom left and right. The theoretical rates are calculated under the assumption of uncorrelated motion and anisotropic overall tumbling. The effective HN–N and Hα–Cα bond lengths are 1.02 and 1.09 Å, respectively. The most extreme outliers are indicated in red. The black lines indicates a slope of 1. Adapted with permission from R.B. Fenwick, C.D. Schwieters, B. Vögeli, Direct investigation of slow correlated dynamics in proteins via dipolar interactions. J. Am. Chem. Soc., 2016, 138, 8412–8421, copyright 2016 American Chemical Society.
Figure 4.
Figure 4.
Residue-specific motional correlation factors Fcorr,A/B from GB3 versus residue numbers. A/B is HNiNi/HNi+1Ni+1 and HαiCαi/Hαi-1Cαi-1 on the top left and right, respectively, and HNiNi/HαiCαi and HNiNi/Hαi-1Cαi-1 on the bottom left and right. Black thick bars connect the lower Fcorr,A/B estimate from the RDC order parameters from references and with the higher estimate derived from reference . The error bars indicate the propagated errors from the CCR rates and order parameters. The white points indicate the Fcorr,A/B values calculated from an ensemble that was restrained with the same CCR and RDC data. Errors for these Fcorr,A/B are the r.m.s.d. values from 20 independent ensembles. Reprinted with permission from R.B. Fenwick, C.D. Schwieters, B. Vögeli, Direct investigation of slow correlated dynamics in proteins via dipolar interactions. J. Am. Chem. Soc., 2016, 138, 8412–8421, copyright 2016 American Chemical Society.
Figure 5.
Figure 5.
Correlation plots of experimental and back-predicted dipolar CCR rates based on four GB3 models. RDD(HNN)/DD(CβHβ) + RDD(HNCβ)/DD(NHβ) is abbreviated by R. The theoretical rates are calculated under the assumption of isotropic (red squares) and anisotropic overall tumbling (blue diamonds). The structural models are: RDC-refined X-ray structure 2OED[99], where the HN and Hα proton positions were subsequently re-optimized with RDCs[72,100] (top left); an eight-state ensemble calculated from RDCs, J couplings, 15N relaxation order parameters and crystallographic B-factors[103] (bottom left); single-state structures (top right) and four-state ensembles both from eNOEs, RDCs and J couplings[106,107] (bottom right). The most extreme outliers are indicated with red residue numbers, where i/j designate the residues of the HN-N and Hβ-Cβ vectors. The black lines indicate a slope of 1. Reprinted by permission from John Wiley and Sons: R.B. Fenwick, B. Vögeli, Detection of correlated protein backbone and side-chain angle fluctuations, ChemBioChem, 2017, 18, 2016–2021, copyright 2017.
Figure 6.
Figure 6.
Impact of correlated motion between the ϕ and χ1 or ψ and χ1 angles on CCR. Left panel, correlation plots of experimental and predicted R = RDD(HNN)/DD(CβHβ) + RDD(HNCβ)/DD(NHβ) rates based on ensembles derived from eNOEs, RDCs, and J couplings from GB3.[106,107] Only rates with changes larger than the experimental error (> 0.59 s−1) are shown. Predicted rates assuming correlated motion are shown in red squares, and those assuming uncorrelated fluctuation in blue diamonds and labeled with the residue number of the involved side-chain and amide bond. Right panel, correlation plots of HNi-Ni-Cαi-Cβi (≈ϕ+60°) and Ni-Cαi-Cβi-Hβi (≈χ1+120° for Ile, and ≈χ1–120° for Val, Thr) dihedral angles (red squares) and Ni+1-C’i-Cαi-Cβi (≈ψ−240°) and C’i-Cαi-Cβi-Hβi (≈χ1 for Ile, and ≈χ1–240° for Val, Thr) dihedral angles (blue diamonds). The angles are indicated on the four-state ensembles with red (ϕ), blue (ψ) and grey arrows (χ1). Ensemble states were grouped around residue 9. Reprinted by permission from John Wiley and Sons: R.B. Fenwick, B. Vögeli, Detection of correlated protein backbone and side-chain angle fluctuations, ChemBioChem, 2017, 18, 2016–2021, copyright 2017.
Figure 7.
Figure 7.
Long-range HαCα/HαCα dipolar CCR rates compared to Hα-Cα bond vector representations in NMR ensembles, single NMR and X-ray structures and sub-selected ensembles of GB3. The angles between the Hα-Cα bond vectors are depicted by circle symbols (left y-axis), while the quality with which every Hα-Cα bond pair reproduces the measured observables is expressed in terms of Q values (right y-axis). The following Q values were calculated: One Q value for the lrCCR rates for every Hα-Cα bond vector pair (square), two Q values – one for each Hα-Cα bond vector – for the RDCs measured in 17 alignment media (up/down triangle), two Q values for the backbone intra-residue HNN/HαCα, sequential HNN/HαCα and HαCα/HαCα CCR rates (left/right triangle). The lines in the figure mark the level of the lowest Q value for the lrCCR rate and the inter-vector angle corresponding to that structure or ensemble with the lowest lrCCR Q value. White symbols denote the calculations for the sub-selected ensembles based on the lrCCR rates. Reprinted from M. Sabo, V. Gapsys, K.F.A. Walter, R.B. Fenwick, S. Becker, X. Salvatella, B.L. de Groot, D. Lee, C. Griesinger, Utilizing dipole-dipole cross-correlated relaxation for the measurement of angles between pairs of opposing CαHα-CαHα bonds in anti-parallel β-sheets, Methods, 2018, 138–139, 85–92, with permission from Elsevier.
Figure 8.
Figure 8.
Residue-specific Fcorr,A/B values for GB3 from ensemble structure calculation. HNN/HNN, HαCα/HαCα, and intraresidual and sequential HNN/HαCα Fcorr,A/B are mapped on 3D ribbon representations of GB3. The β sheet is in the front in the top row, and the α helix in the bottom row. Reprinted with permission from R.B. Fenwick, C.D. Schwieters, B. Vögeli, Direct investigation of slow correlated dynamics in proteins via dipolar interactions. J. Am. Chem. Soc., 2016, 138, 8412–8421, copyright 2016 American Chemical Society.
Figure 9.
Figure 9.
Comparison of MQ CSM(15N)/CSM(1H) CCR rates and SQ 15N exchange contribution. The dependence of ΔRMQ(exchange) = 2RCSM(15N)/CSM(1H) rates upon the exchange time scale, kex = 1/τex, and the 1H and 15N chemical shift modulations, ΔωH and ΔωN, respectively, is shown with the thin curves calculated from equation 8 in the study by Wang and Palmer[93] (ΔωN = 2 ppm at 600 MHz, p1 = 0.9 and ΔωH/ΔωN ratios equal to 0.2, 0.5, 1,2, 5). The plotted results would be multiplied by −1 if ΔωH and ΔωN had opposite signs. The bold curve shows the exchange contribution to SQ 15N relaxation, Rex plotted versus log(kex/ΔωN). Reprinted by permission from Springer Nature: C. Wang, A.G. Palmer III, Differential multiple quantum relaxation caused by chemical exchange outside the fast exchange limit. J. Biomol. NMR, 2002, 24, 263–268, copyright 2002.
Figure 10.
Figure 10.
Location of residues exhibiting significant correlated conformational exchange contributions to CSM/CSM CCR rates in the E140Q mutant of the C-terminal domain of calmodulin. A) Residue pairs exhibiting dynamics sensed by CSM(15N)/CSM(1HN) CCR rates in apo wild type are highlighted from yellow to red, for increasing contributions. Residues for which MQ rates could not be measured are shown in gray. B) Same as A) for calcium-loaded wild type. C) Residue pairs exhibiting dynamics sensed by CSM(Cαi)/CSM(Cαi+1) CCR rates in calcium-loaded E140Q mutant are highlighted in red or blue, depending on whether the CSM/CSM of the two residues are correlated or anticorrelated. Residues for which MQ rates could not be measured or without significant dynamics are shown in white and gray, respectively. D) δσNδσHN values for the of the E140Q mutant extracted from CSM(15N)/CSM(1HN) CCR rates plotted in A) and B) (black dots). The magenta line shows δσNδσHN calculated from the chemical shifts of the apo and calcium-loaded wild type (δσ = Δω/γ/Βο.). The blue line shows values calculated from δσHN ring-current contributions and δσN measurements on the mutant. E) Measured differences between DQ- and ZQ-coherence relaxation rates, which are dominated by CSM(Cαi)/CSM(Cαi+1) CCR and used for C). For comparison, exchange rates of HN with the solvent are shown (solid continuous line). F) Secondary 13Cα chemical shifts for calcium-loaded E140Q mutant are shown in white bars, and chemical shift differences between apo and calcium-loaded wild type in black bars. C), E) and F) P. Lundström, F.A.A. Mulder, M. Akke, Correlated dynamics of consecutive residues reveal transient and cooperative unfolding of secondary structure in proteins. Proc. Natl. Acad. Sci. USA, 2005, 102, 16984–16989, copyright 2005 National Academy of Sciences. A), B) and D) Reprinted with permission from P. Lundström, M. Akke, Quantitative analysis of conformational exchange contributions to 1H-15N multiple-quantum relaxation using field-dependent measurements. Time scale and structural characterization of exchange in a calmodulin C-terminal domain mutant. J. Am. Chem. Soc., 2004, 126, 928–935, copyright 2004 American Chemical Society.
Figure 11.
Figure 11.
CSM(13Cα)/CSM(13Cβ) interference in GB3. Shown are Cα−Cβ ΔR=1/2(RDQ-RZQ) rates with dipolar contributions RDD/DD subtracted (calculated from structural coordinates) for protonated (blue circles) and deuterated at non-exchangeable sites (red circles) at 25oC at 900 MHz magnetic field strength. In the deuterated protein the rates are close to zero, indicating a significant reduction in mobility.

References

    1. Originally coined by Albert Einstein “Spukhafte Fernwirkung” in a letter to Max Born expressing his dissatisfaction with the concept of quantum entanglement.
    1. Stoll ME, Vega AJ, Vaughan RW, J. Chem. Phys 1977, 67, 2029–2038.
    1. Wokaun A, Ernst RR, Mol. Phys 1978, 36, 317–341.
    1. Reif B, Hennig M, Griesinger C, Science 1997, 276, 1230–1233. - PubMed
    1. Schwalbe H, Carlomagno T, Hennig M, Junker J, Reif B, Richter C, Griesinger C, Methods Enzymol 2001, 338, 35–81. - PubMed

Publication types

LinkOut - more resources