

Changes in midlife death rates across racial and ethnic groups in the United States: systematic analysis of vital statistics
- PMID: 30111554
- PMCID: PMC6092678
- DOI: 10.1136/bmj.k3096
Changes in midlife death rates across racial and ethnic groups in the United States: systematic analysis of vital statistics
Abstract
Objective: To systematically compare midlife mortality patterns in the United States across racial and ethnic groups during 1999-2016, documenting causes of death and their relative contribution to excess deaths.
Design: Trend analysis of US vital statistics among racial and ethnic groups.
Setting: United States, 1999-2016.
Population: US adults aged 25-64 years (midlife).
Main outcome measures: Absolute changes in mortality measured as average year-to-year change during 1999-2016 and 2012-16; excess deaths attributable to increasing mortality; and relative changes in mortality measured as relative difference between mortality in 1999 versus 2016 and the nadir year versus 2016, and the slope of modeled mortality trends for 1999-2016 and for intervals between joinpoints.
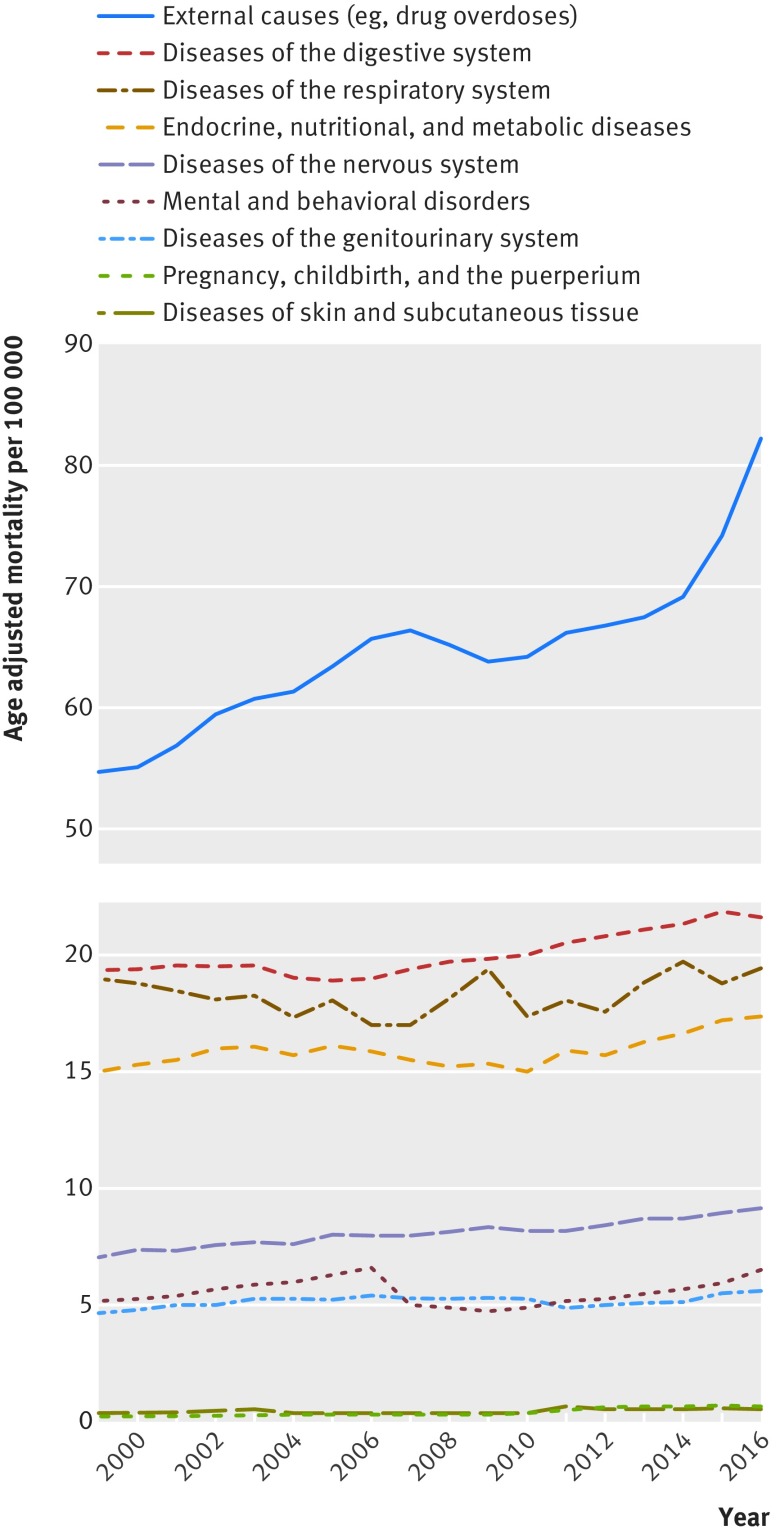
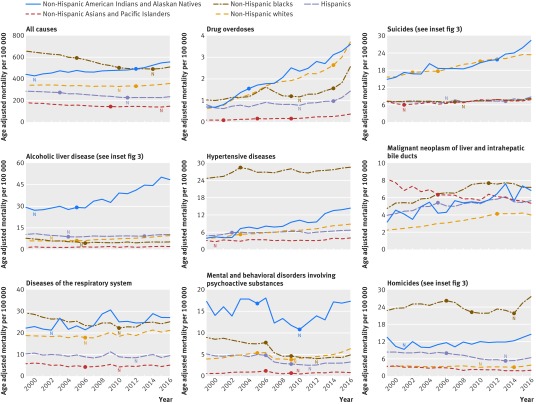
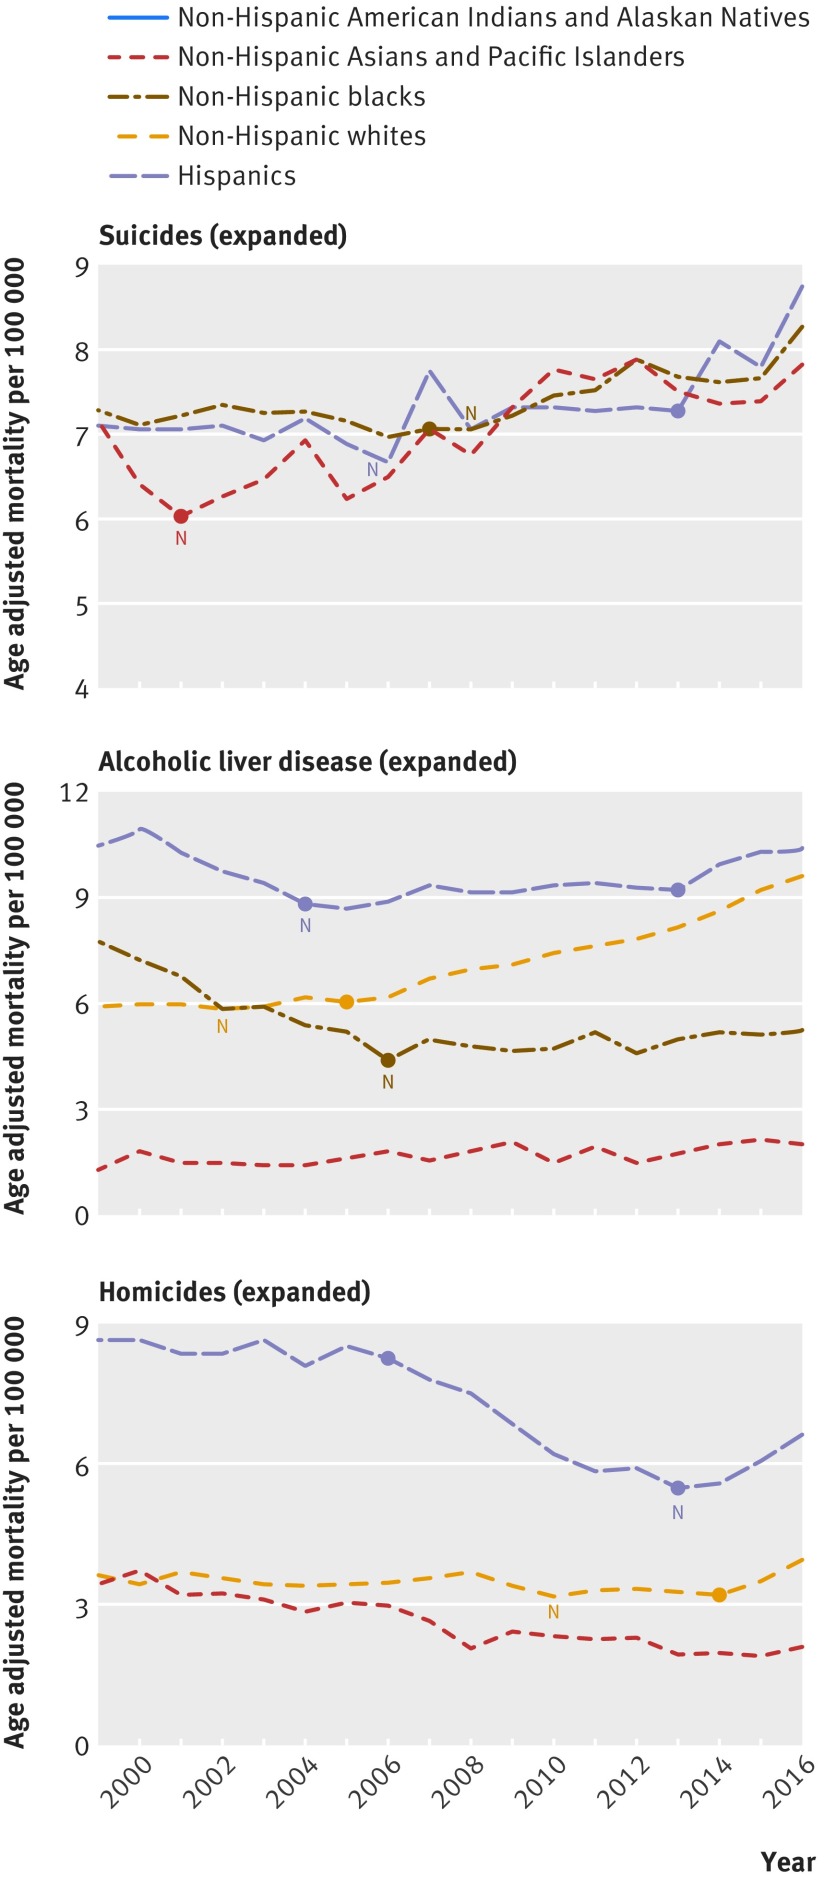
Results: During 1999-2016, all cause mortality in midlife increased not only among non-Hispanic (NH) whites but also among NH American Indians and Alaskan Natives. Although all cause mortality initially decreased among NH blacks, Hispanics, and NH Asians and Pacific Islanders, this trend ended in 2009-11. Drug overdoses were the leading cause of increased mortality in midlife in each population, but mortality also increased for alcohol related conditions, suicides, and organ diseases involving multiple body systems. Although midlife mortality among NH whites increased across a multitude of conditions, a similar trend affected non-white populations. Absolute (year-to-year) increases in midlife mortality among non-white populationsoften matched or exceeded those of NH whites, especially in 2012-16, when the rate of increase intensified for many causes of death. During 1999-2016, NH American Indians and Alaskan Natives experienced large increases in midlife mortality from 12 causes, not only drug overdoses (411.4%) but also hypertensive diseases (269.3%), liver cancer (115.1%), viral hepatitis (112.1%), and diseases of the nervous system (99.8%). NH blacks experienced increased midlife mortality from 17 causes, including drug overdoses (149.6%), homicides (21.4%), hypertensive diseases (15.5%), obesity (120.7%), and liver cancer (49.5%). NH blacks also experienced retrogression: after a period of stable or declining midlife mortality early in 1999-2016, death rates increased for alcohol related liver disease, chronic lower respiratory tract disease, suicides, diabetes, and pancreatic cancer. Among Hispanics, midlife mortality increased across 12 causes, including drug overdoses (80.0%), hypertensive diseases (40.6%), liver cancer (41.8%), suicides (21.9%), obesity (106.6%), and metabolic disorders (60.0%). Retrogression also occurred in this population; after a period of declining mortality, death rates increased for alcohol related liver disease, mental and behavioral disorders involving psychoactive substances, and homicides. NH Asians and Pacific Islanders were least affected by this trend but also experienced increases in midlife mortality from drug overdoses (300.6%), alcohol related liver disease (62.9%), hypertensive diseases (28.3%), and brain cancer (56.6%). The suicide rate in this group increased by 29.7% after 2001. The relative increase in US midlife mortality differed by sex and geography. For example, the relative increase in fatal drug overdoses was greater among women than among men. Although the relative increase in midlife mortality was generally greater in non-metropolitan (ie, rural) areas, the relative increase in drug overdoses among NH whites and Hispanics was greatest in suburban fringe areas of large cities, and among NH blacks was greatest in small cities.
Conclusions: Mortality in midlife in the US has increased across racial-ethnic populations for a variety of conditions, especially in recent years, offsetting years of progress in lowering mortality rates. This reversal carries added consequences for racial groups with high baseline mortality rates, such as for NH blacks and NH American Indians and Alaskan Natives. That death rates are increasing throughout the US population for dozens of conditions signals a systemic cause and warrants prompt action by policy makers to tackle the factors responsible for declining health in the US.
Published by the BMJ Publishing Group Limited. For permission to use (where not already granted under a licence) please go to http://group.bmj.com/group/rights-licensing/permissions.
Conflict of interest statement
Competing interests: All authors have completed the ICMJE uniform disclosure form at www.icmje.org/coi_disclosure.pdf and declare: no support from any organization for the submitted work, no financial relationships with any organizations that might have an interest in the submitted work in the previous three years, and no other relationships or activities that could appear to have influenced the submitted work.
Figures
Comment in
-
Reversals in life expectancy in high income countries?BMJ. 2018 Aug 15;362:k3399. doi: 10.1136/bmj.k3399. BMJ. 2018. PMID: 30111573 No abstract available.
References
-
- Murphy SL, Xu J, Kochanek KD, Curtin SC, Arias E. Deaths: Final Data for 2015. Natl Vital Stat Rep 2017;66:1-75. - PubMed
-
- Kochanek KD, Murphy S, Xu J, Arias E. Mortality in the United States, 2016. NCHS Data Brief 2017;(293):1-8. - PubMed
-
- Squires D, Blumenthal D. Mortality Trends Among Working-Age Whites: The Untold Story. Issue Brief (Commonw Fund) 2016;3:1-11. - PubMed
-
- Kochanek KD, Murphy SL, Xu J, Tejada-Vera B. Deaths: Final Data for 2014. Natl Vital Stat Rep 2016;65:1-122. - PubMed
MeSH terms
Grants and funding
LinkOut - more resources
Full Text Sources
Other Literature Sources