. 2018 Aug 15;10(454):eaan1230.
doi: 10.1126/scitranslmed.aan1230.

TGFβ inhibition restores a regenerative response in acute liver injury by suppressing paracrine senescence

Affiliations

TGFβ inhibition restores a regenerative response in acute liver injury by suppressing paracrine senescence

Thomas G Bird et al. Sci Transl Med. .

Abstract

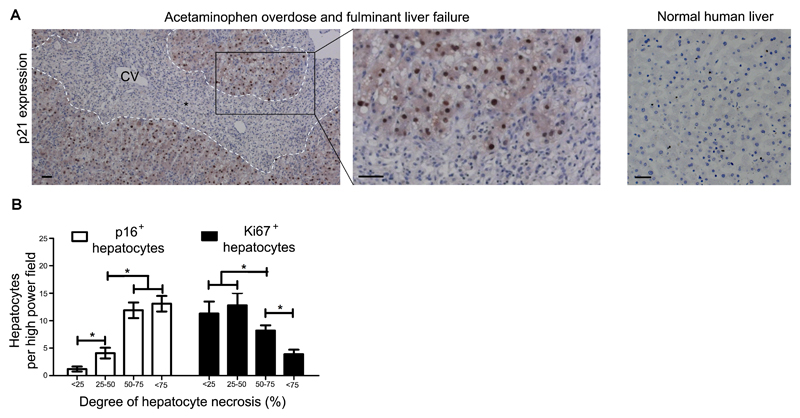
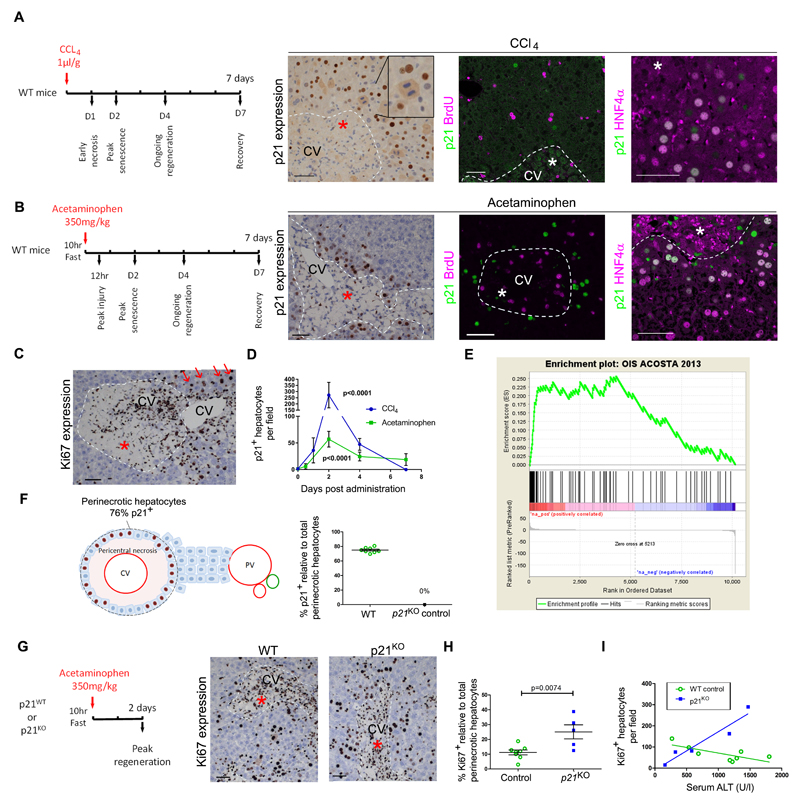
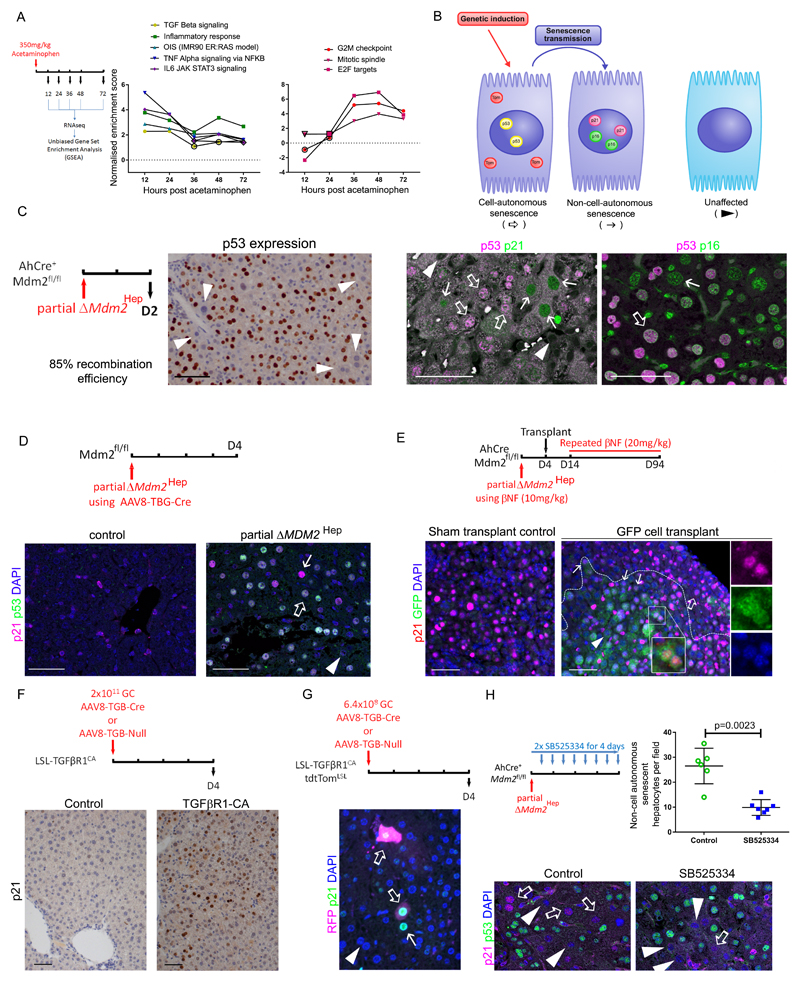
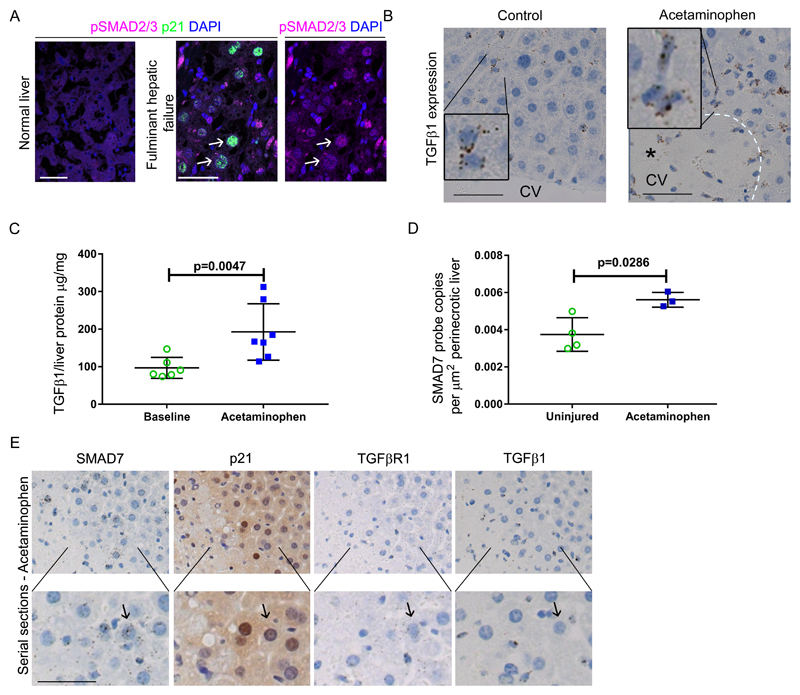
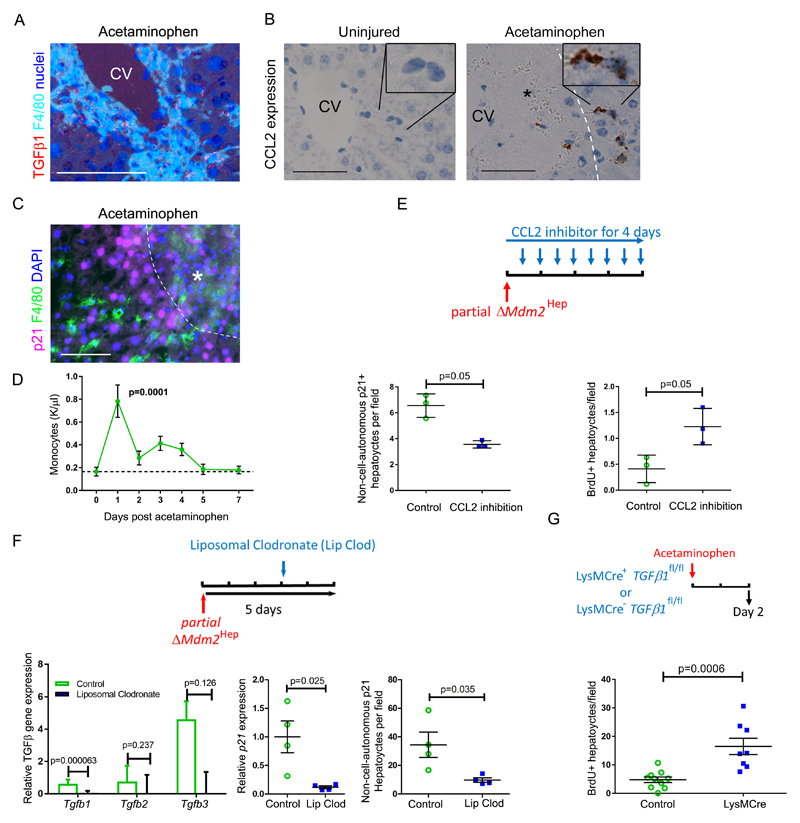
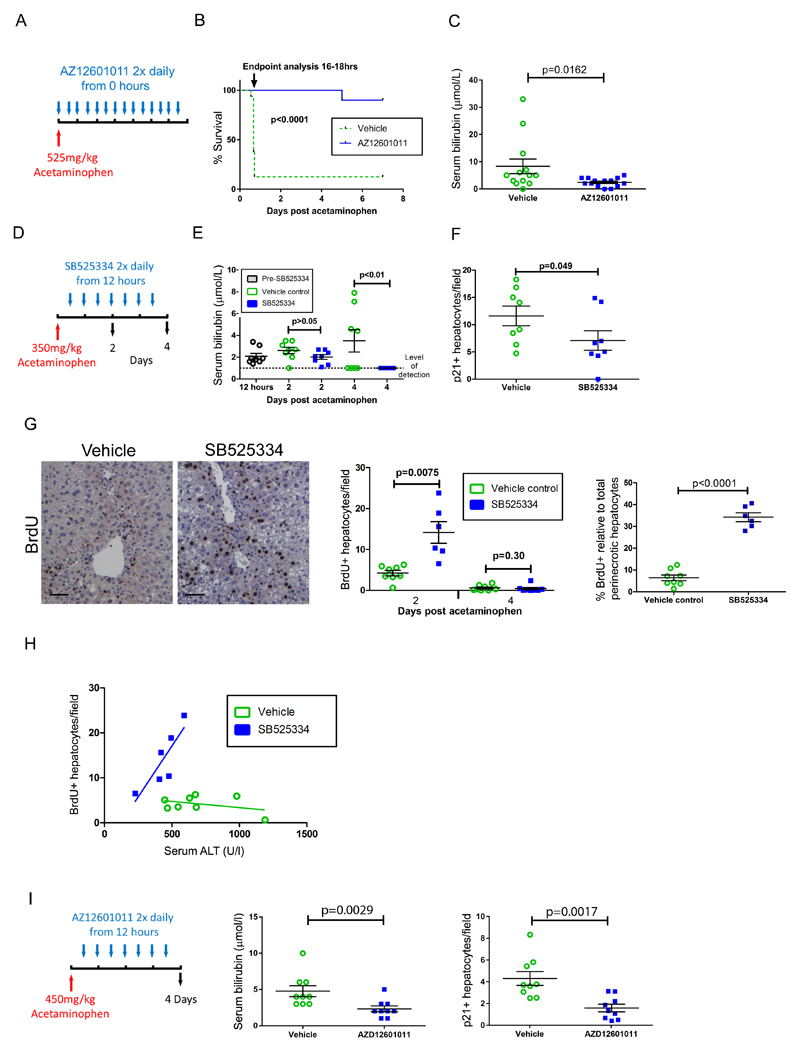
Liver injury results in rapid regeneration through hepatocyte proliferation and hypertrophy. However, after acute severe injury, such as acetaminophen poisoning, effective regeneration may fail. We investigated how senescence may underlie this regenerative failure. In human acute liver disease, and murine models, p21-dependent hepatocellular senescence was proportionate to disease severity and was associated with impaired regeneration. In an acetaminophen injury mouse model, a transcriptional signature associated with the induction of paracrine senescence was observed within 24 hours and was followed by one of impaired proliferation. In mouse genetic models of hepatocyte injury and senescence, we observed transmission of senescence to local uninjured hepatocytes. Spread of senescence depended on macrophage-derived transforming growth factor-β1 (TGFβ1) ligand. In acetaminophen poisoning, inhibition of TGFβ receptor 1 (TGFβR1) improved mouse survival. TGFβR1 inhibition reduced senescence and enhanced liver regeneration even when delivered beyond the therapeutic window for treating acetaminophen poisoning. This mechanism, in which injury-induced senescence impairs liver regeneration, is an attractive therapeutic target for developing treatments for acute liver failure.


Conflict of interest statement

Competing Interested: J.P.I. has consulted for Novartis. M.S. is co-founder and advisor of Senolytic Therapeutics, S.L. (Spain) and Senolytic Therapeutics, Inc. (USA) aimed at developing senolytic therapies. S.T.B. is an AstraZeneca employee and shareholder. The other authors declare no competing interests.

Figures

Fig. 1
Fig. 1. Human liver necrosis causes acute hepatocellular senescence.
(A) Shown are representative images of sections of explanted human liver following liver transplantation for severe acetaminophen overdose (n=8) compared to control healthy human liver. Explanted livers injured by acetaminophen overdose show expression of the senescence marker p21 detected by immunohistochemistry in residual hepatocytes surrounding areas of necrosis. Necrosis interface, dashed white line; CV, central vein; black asterisk indicates area of necrosis. As a control, human liver with normal histology was used (n= 50). Scale bar, 50µm. (B) A case series (n=74) of patients with sub-massive liver necrosis divided into subgroups according to the extent of hepatocellular necrosis, <25% n=8, 25-50% n=16, 50-75% n=22, >75% n= 28. The extent of hepatocellular submassive necrosis (defined histologically by globalized confluent necrosis) was quantified by immunohistochemistry for the hepatocellular senescence marker p16 and the proliferation marker Ki67. * = p<0.05, one way ANOVA. Mean ± SEM.
Fig. 2
Fig. 2. Toxin-mediated liver injury causes p21-dependent hepatocellular senescence in mice.
(A, B) In murine toxin-induced acute liver injury models, mice were treated with either carbon tetrachloride (CCl4) (A) or acetaminophen (B). Treatment with these toxins resulted in pericentral necrosis two days after administration as shown by immunohistochemistry for expression of the senescence marker p21, (green); also shown is expression of the proliferation marker BrdU (magenta) and the hepatocyte marker HNF4α (magenta). (C) Immunohistochemistry for expression of the proliferation marker Ki67 is shown two days after acetaminophen treatment. Staining indicates hepatocyte proliferation away from but not next to the area of necrosis; red arrows, proliferating hepatocyte. (D) Quantification of p21+ hepatocytes post injury; n≥3 for each time point, p value <0.0001 versus time = 0, two way ANOVA. (E) Gene Set Enrichment Analysis (GSEA) plot showing enrichment of the early (24 hours) acetaminophen injury gene expression signature in liver for an oncogene-induced senescence (OIS) signature. Geneset: IMR90 ER:RAS cell model (15). ES, enrichment score = 0.2564; NES, normalised enrichment score = 2.466; nominal p value <0.001. (F) Perinecrotic hepatocytes (brown nuclei) were quantified two days following acetaminophen for p21 expression; 74.9% of total perinecrotic hepatocytes expressed p21 (n=8 mice). (G) Immunohistochemistry for expression of the proliferation marker Ki67 in p21-deficient (p21KO) mice two days after acetaminophen-induced liver injury. Ki67 expression indicates proliferating hepatocytes in the perinecrotic area of the injured mouse liver. (H) Quantification of perinecrotic hepatocytes in panel G. (I) Total Ki67+ hepatocytes in relation to serum alanine transaminase (ALT; U/l), a marker of liver injury (n= 5 vs. 8 mice; 20 high power fields were quantified per liver. P = 0.0074, two-tailed t test. Linear regression for wildtype (WT) and p21KO mice R2 0.54 and 0.92, with slope 95% confidence intervals -0.10 to -0.0045 and 0.082 to 0.28 and probability slope≠0, p = 0.037 and 0.010, respectively. Scale bars, 50µm. CV, central vein. Dashed white lines, necrosis boundary and asterisk, area of necrosis.
Fig. 3
Fig. 3. Non-cell-autonomous senescence in hepatocyte-specific mouse senescence models.
(A) Plots of gene set enrichment analysis (GSEA) normalised enrichment scores comparing gene sets over time observed in the acetaminophen model to the unbiased top 15 ranked hallmarks gene sets and the oncogene-induced senescence (OIS) signature from IMR90 ER:RAS cell model (15), black borders of data points highlight p values <0.05; raw data is shown in Tables S2 and S3. Top and bottom panel present inflammatory and cell cycle arrest gene expression signatures. (B) Diagram showing the use of genetic induction of transgenes in hepatocytes to induce cell-autonomous senescence and assessment of senescence using a combination of markers - p53, p21 and p16. Presence of senescence markers, p21 or p16, in the absence of markers of genetic recombination, p53 or Tomato reporter (Tom), identifies non-cell-autonomous senescence. (C) p53 accumulates in a subpopulation of hepatocytes in the partial ΔMdm2Hep mouse model where 20mg/kg β-naphthoflavone (βNF) is given to AhCre+ Mdm2fl/fl mice. Immunohistochemical staining for p21/p53 and for p53/p16INK4As was assessed by confocal microscopy. (D) Immunohistochemical staining and confocal microscopic analysis of mouse liver sections for p53 and p21 after deletion of Mdm2 using AAV8-TBG-Cre (2.5x10¹¹ GC/mouse). (E) Immunohistochemical staining and confocal microscopic analysis of mouse liver sections for p21 expression and green fluorescent protein (GFP) staining in a hepatocyte transplant mouse model 94 days post transplantation of GFP tagged hepatocyte precursor cells. AhCre+ Mdm2fl/fl mouse recipients were given wildtype (WT) donor cells tagged with GFP and iterative doses of βNF to induce hepatocyte recombination of Mdm2. White dashed line, border of the engrafted cells. Magnified area is shown in individual color images on right. (F) Immunohistochemical staining and confocal microscopic analysis of mouse liver sections for p21 expression following hepatocellular TGFβR1 activation by AAV8-TBG-Cre in LSL-TGFβR1-CA mice. (G) Immunohistochemical staining and confocal microscopic analysis of mouse liver sections for p21 expression and red fluorescent protein (RFP) staining to detect tdTomato reporter after reduced dosing of the AAV8-TBG-Cre vector (6.4x10⁸ genetic copies per animal) in LSL-TGFβR1-CA R26-LSL-tdTomato mice. (H) Following partial ΔMdm2Hep mice were given the TGFβR1 inhibitor SB525334 or vehicle control. Immunohistochemical staining and confocal microscopic analysis of mouse liver sections for p53 and p21 with quantification of non-cell-autonomous p21 expression; p = 0.0023, two tailed Mann-Whitney test; n = 6 vehicle vs. 7 SB525334 treated mice. Mean ± SEM. Scale bars, 50µm. Open arrow, cell-autonomous senescence, closed arrow, non-cell-autonomous senescence, arrowhead, unaffected.
Fig. 4
Fig. 4. TGFβ signaling is activated in acetaminophen-induced hepatocellular senescence.
(A) Representative images showing immunohistochemistry for expression of p21 and pSMAD2/3 in healthy human liver and in liver from patients with fulminant hepatic failure secondary to acetaminophen overdose. White arrows indicate senescent hepatocytes. (B) Representative images showing in situ hybridization for TGFβ1 in the liver of acetaminophen treated (350mg/kg) and untreated C57BL/6J mice. TGFβ1 ligand is expressed by non-parenchymal cells with a monocyte-like appearance. CV, central vein. Black asterisk indicates area of necrosis. (C) ELISA of mouse liver TGFβ1 in untreated and acetaminophen treated mice 12 hours after exposure. (n= 6 vs. 7, respectively). P=0.0047, two tailed Mann-Whitney. Mean ± SEM. (D) Quantification by in situ hybridization of SMAD7 expression in the perinecrotic region of mouse liver two days after acetaminophen treatment. P=0.0286, compared to equivalent area in uninjured mouse liver, one-tailed Mann-Whitney test. (E) Mouse liver serial sections assessed for expression of SMAD7, TGFβR1 and TGFβ1 ligand by in situ hybridization and p21 by immunohistochemistry 12 hours after acetaminophen treatment. Scale bars, 50µm.
Fig. 5
Fig. 5. Macrophage recruitment and TGFβ1 production drive hepatocellular senescence and impair hepatocellular regeneration in mice.
(A) Serial mouse liver sections assessed for hepatic TGFβ1 ligand production and F4/80+ macrophages by in situ hybridization and F4/80 immunohistochemistry respectively (two days after 350mg/kg acetaminophen). CV, central vein. (B) Shown is in situ hybridization staining for expression of the CCL2 chemokine. Dashed white line, necrotic interface, black asterisk, area of necrosis. (C) Immunohistochemical staining for F4/80+ macrophages and p21+ hepatocytes. Scale bars = 50µm. (D) Quantification of peripheral monocytes in mice after acetaminophen treatment versus fasted untreated mice as baseline (dashed line). n = 5 mice for each time point. p = 0.0001, one way ANOVA with Dunnett’s multiple comparison baseline vs. day one. (E) Immunohistochemical staining for p53 and p21 expression or for BrdU in livers four days after partial ΔMdm2Hep, where 20mg/kg β-naphthoflavone (βNF) is given to AhCre+ Mdm2fl/fl mice, followed by either twice daily antibody-mediated CCL2 inhibition or isotype antibody control. Non-cell-autonomous hepatocyte p21 expression (without p53 expression) and proliferation (BrdU) were quantified. p= 0.05, Mann-Whitney (n= 3 mice per group). (F) Liposomal clodronate depletion of macrophages three days after partial ΔMdm2Hep compared to PBS control. TGFβ ligands and p21 expression in whole mouse liver were quantified by qRT-PCR. p values = 0.000063, 0.237, and 0.126 for TGFβ1, TGFβ2 and TGFβ3 respectively and 0.025 for p21, t test (n= 4 mice per group). Non-cell-autonomous p21+ hepatocytes were quantified after immunohistochemical staining for p53 and p21. P value = 0.035, t test (n= 4 mice per group). (G) Acetaminophen 350mg/kg was administered to LysMCre+ TGFβfl/fl or LysMCreWT TGFβfl/fl mouse littermates. Hepatocyte proliferation was assessed by BrdU immunohistochemistry. p=0.0006, two tailed t test (n= 10 vs. 8 mice). Mean ± SEM.
Fig. 6
Fig. 6. Inhibition of TGFβR1 signaling reduces hepatocellular senescence and restores a proportional regenerative response after acetaminophen treatment in mice.
(A) Cohorts of male C57BL/6J mice were given vehicle control or were treated with the TGFβR1 inhibitor AZ12601011, starting when 525mg/kg acetaminophen was administered. Mice were closely monitored throughout until death or humane endpoint was reached, typically between 16 and 18 hours. Initially the mice treated with the TGFβR1 inhibitor (n = 14) were sacrificed when the control animals reached the endpoint irrespective of clinical condition (total biological replicates, n = 14 with AZ12601011 and n=16 with vehicle control; performed over three separate experiments). (B) Separate survival cohorts (n = 5 in each of two experiments) treated with the TGFβR1 inhibitor were compared to simultaneous vehicle controls to examine longer term survival; p value < 0.0001, Gehan-Breslow-Wilcoxon test. (C) At matched endpoint, the TGFβR1 inhibitor and vehicle control groups were compared for serum bilirubin. P = 0.0162, two tailed Mann-Whitney. (D) In an experiment examining delayed TGFβR1 inhibition commencing 12 hours after acetaminophen treatment in male C57BL/6J mice the TGFβR1 inhibitor SB525334, or vehicle, was given twice daily. (E) Shown is serum bilirubin over time from panel D; p >0.05 and <0.01 at days two and four for SB525334 treatment compared to vehicle control respectively, two way ANOVA with Bonferroni correction (n= 8 each group). (F) Immunohistochemical staining for hepatocellular p21 expression was quantified; p= 0.049, t test, 30 high power fields of liver were analyzed, n=8 mice per group. (G) Shown is immunohistochemical staining for hepatocellular BrdU (representative images for two day post acetaminophen time point are shown) for both whole liver and perinecrotic hepatocytes (day two only). P values = 0.0075, and 0.30 for total BrdU+ hepatocytes at days 2 and 4 respectively and <0.0001 for BrdU+ perinecrotic hepatocytes comparing SB525334 treatment to vehicle control, t test (groups n= 8 each, except day 2 vehicle where n=6). Scale bars, 50µm. (H) In individual mice, two days post acetaminophen treatment, hepatocytes were analyzed for serum ALT and BrdU staining and linear regression was performed. R2 0.15 and 0.71, with Slope 95% confidence intervals -0.0094 to 0.0038 and 0.0049 to 0.085 and probability slope ≠ 0, p = 0.34 and 0.036, respectively. (I) A non-fatal dose of acetaminophen (450mg/kg) was administered to male C57BL/6J mice, followed by treatment with AZ12601011 or vehicle control twelve hours later. Serum bilirubin was measured and p21 expression in hepatocytes was quantified by immunohistochemistry. P = 0.0029 and 0.0017 respectively comparing AZ12601011 treatment to vehicle control, two tailed t test, n=9 per group. Data presented as mean ± SEM.

Comment in

References

    1. Michalopoulos GK. Liver regeneration. J Cell Physiol. 2007;213:286–300. - PMC - PubMed
    1. Overturf K, al-Dhalimy M, Ou CN, Finegold M, Grompe M. Serial transplantation reveals the stem-cell-like regenerative potential of adult mouse hepatocytes. Am J Pathol. 1997;151:1273–1280. - PMC - PubMed
    1. Bernal W, Wendon J. Acute Liver Failure. New England Journal of Medicine. 2013;369:2525–2534. - PubMed
    1. Reuben A, Tillman H, Fontana RJ, Davern T, McGuire B, Stravitz RT, Durkalski V, Larson AM, Liou I, Fix O, Schilsky M, et al. Outcomes in Adults With Acute Liver Failure Between 1998 and 2013: An Observational Cohort Study. Ann Intern Med. 2016;164:724–732. - PMC - PubMed
    1. O'Grady JG, Alexander GJ, Hayllar KM, Williams R. Early indicators of prognosis in fulminant hepatic failure. Gastroenterology. 1989;97:439–445. - PubMed

Publication types

Substances