. 2018 Aug;560(7719):441-446.
doi: 10.1038/s41586-018-0423-5. Epub 2018 Aug 15.

Autism-like phenotype and risk gene mRNA deadenylation by CPEB4 mis-splicing

Affiliations

Autism-like phenotype and risk gene mRNA deadenylation by CPEB4 mis-splicing

Alberto Parras et al. Nature. 2018 Aug.

Abstract

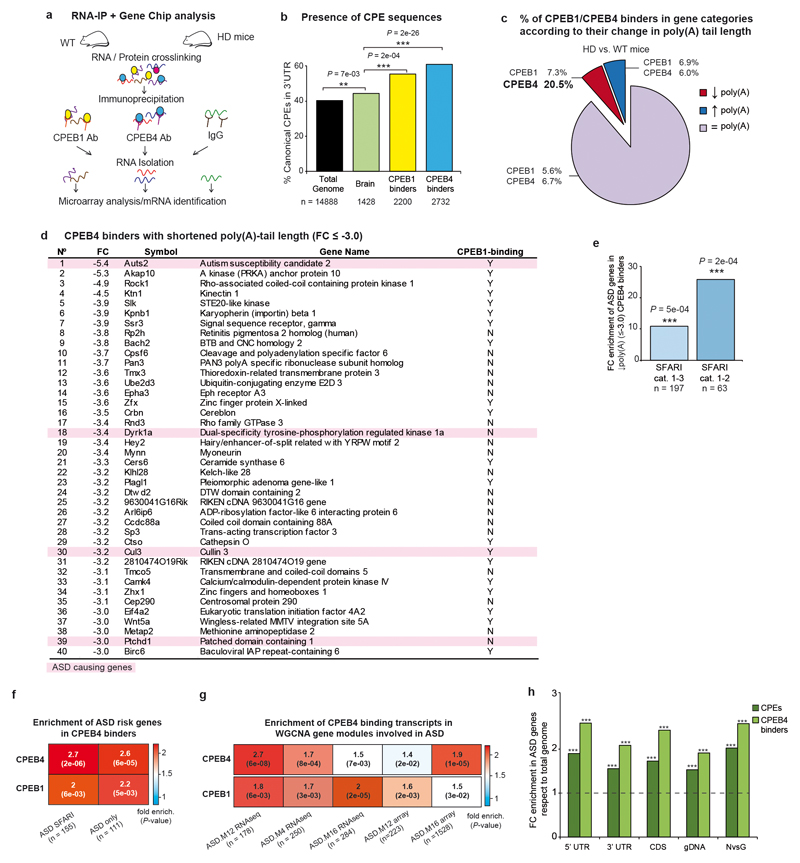
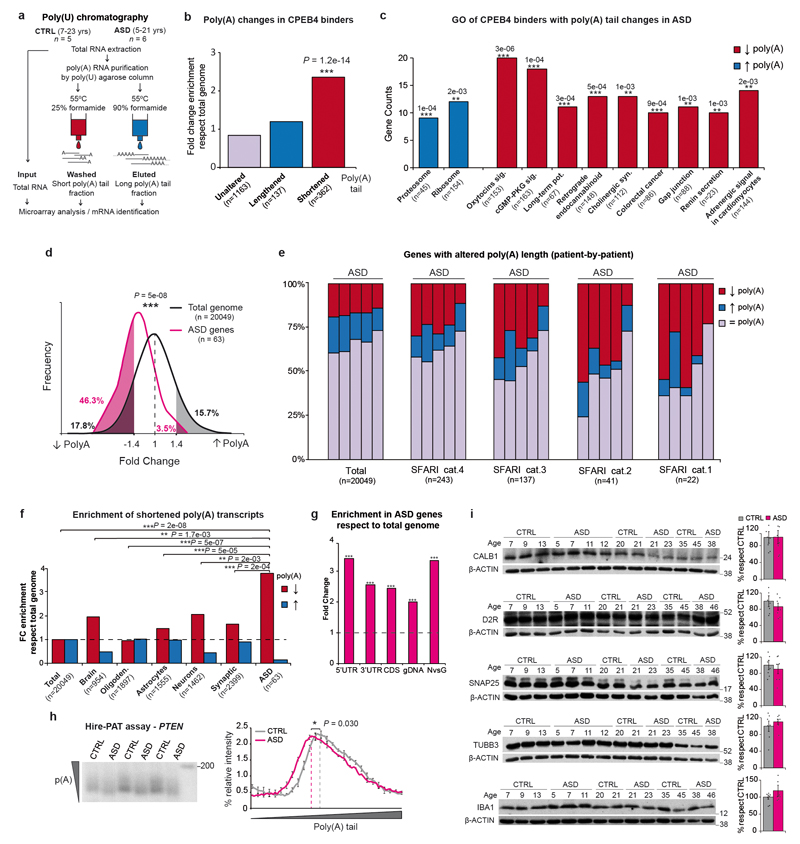
Common genetic contributions to autism spectrum disorder (ASD) reside in risk gene variants that individually have minimal effect sizes. As environmental factors that perturb neurodevelopment also underlie idiopathic ASD, it is crucial to identify altered regulators that can orchestrate multiple ASD risk genes during neurodevelopment. Cytoplasmic polyadenylation element binding proteins 1-4 (CPEB1-4) regulate the translation of specific mRNAs by modulating their poly(A)-tails and thereby participate in embryonic development and synaptic plasticity. Here we find that CPEB4 binds transcripts of most high-confidence ASD risk genes. The brains of individuals with idiopathic ASD show imbalances in CPEB4 transcript isoforms that result from decreased inclusion of a neuron-specific microexon. In addition, 9% of the transcriptome shows reduced poly(A)-tail length. Notably, this percentage is much higher for high-confidence ASD risk genes, correlating with reduced expression of the protein products of ASD risk genes. An equivalent imbalance in CPEB4 transcript isoforms in mice mimics the changes in mRNA polyadenylation and protein expression of ASD risk genes and induces ASD-like neuroanatomical, electrophysiological and behavioural phenotypes. Together, these data identify CPEB4 as a regulator of ASD risk genes.


Conflict of interest statement

Competing interests. The authors declare no competing interests.

Figures

Extended Data Fig. 1
Extended Data Fig. 1. Enrichment in ASD-risk genes among CPEB1-4 binding transcripts whose poly(A)-tail is shortened in an HD mouse model with altered CPEBs.
a, Experimental design of RIP from WT and HD mice (with altered CPEB1 and CPEB4, see methods). b, Percentage of CPE sequences in the 3’ UTR of total genome, brain genes and CPEB1 and CPEB4 binders from RIP experiment. c, Percentage of CPEB1- or CPEB4-only binders with shortened (red), lengthened (blue) or unaltered (purple) poly(A) tail. d, Symbol and gene names of CPEB4 binders in WT St with the most shortened poly(A)-tail (FC ≤ -3.0) in HD mice. The last column indicates whether they are also CPEB1 binders (Y, yes; N, no). High-confidence ASD-risk genes (SFARI cat. 1–3) are highlighted in pink. e, Fold-change enrichment of high-confidence ASD genes (SFARI cat. 1–3 and cat. 1–2) in CPEB4 binders whose poly(A) tail is shortened in HD mice (FC ≤ -3.0). Heatmaps of CPEB4/CPEB1 binders f, in SFARI ASD genes or removing intellectual disability genes (ASD only) and g, in weighted gene co-expression network analysis (WGCNA) modules involved in ASD. h, Fold change enrichment of percentage of CPE sequences and CPEB4 binders of ASD genes (SFARI cat. 1-2, n = 63) vs. total genome stratified by 5’UTR, 3’UTR, CDS, gDNA length and ratio neuronal/glial expression. b, e-g, One-sided Fisher’s exact test. c, Pearson’s chi-squared test. h, Statistical details in simulations in method section. **P < 0.01, ***P < 0.001.
Extended Data Fig. 2
Extended Data Fig. 2. mRNA and protein levels of CPEBs in Cx of idiopathic ASD individuals and features of CPEB4 mis-splicing.
a, CPEB1-3 mRNA expression levels according to RNA-seq data (n = 63 for control, n = 43 for ASD). b, CPEB1-3 protein levels (n = 10) and c, CPEB4 protein levels (n = 20 for control and n = 19 for ASD). d, Diagram representing the alternative splicing events of CPEB4 by rMATS. Percent Spliced in (PSI) is shown under each event (n = 81 for CTRL and n = 82 ASD cortical prefrontal and temporal samples). e, CPEB4 exon 4 inclusion level (PSI) in all (left panel) and over 35-year-old (right panel) individuals, and f, percentage of each CPEB4 splicing isoform by vast-tools analysis of isoform-specific EEJs (exon-exon junctions). Percentage of each CPEB4 splicing isoform by g, Digital Droplet PCR and h, Absolute qRT-PCR, i, Δ4/Ex4+ CPEB4 isoform ratio in Cx of idiopathic ASD cases (n = 11) and CTRL (n = 10) under 35-year-old. For gel source data, see Supplementary Figure 1. a, d-g, i, Two-sided Mann -Whitney-Wilcoxon test. b, h, Two-sided unpaired t-test. Box plots show median, 25th, 75th percentiles. Data are mean ± s.e.m. 95% CIs. *P < 0.05, **P < 0.01.
Extended Data Fig. 3
Extended Data Fig. 3. Supplemental data of global poly(A)-alteration and protein levels in idiopathic ASD brains.
a, Experimental design. b, Poly(A) changes of CPEB4 binders. c, Gene counts histogram from Gene Ontology (GO) analysis (KEGG pathways) of genes with poly(A) tail changes. d, Frequency distribution of fold changes of poly(A) alteration of total genes (in black) and ASD genes (SFARI cat. 1-2, in pink). e, Percentage of genes with shortened (red), lengthened (blue) or unaltered (purple) poly(A)-tail length in the whole transcriptome and ASD genes (SFARI cat. 4 to cat. 1) patient-by-patient. f, Fold change enrichment of brain, oligodendrocytic, astrocytic, neuronal, synaptic and ASD specific genes (SFARI cat.1-2) with shortened poly(A)-tail respect to total genome. g, Fold change enrichment of ASD (SFARI cat. 1-2) genes shortened in ASD human vs. total genome stratified by 5’UTR, 3’UTR, CDS, gDNA length and ratio neuronal/glial expression. h, Hire-PAT assay of PTEN poly(A)-tail in CTRL- and ASD cases (n = 3). i, Protein levels of neuronal and astrocytic specific genes in Cx of idiopathic ASD cases and CTRL (n = 7). For gel source data, see Supplementary Figure 1. b, f, One-sided Fisher’s exact test, c, FDR Benjamini-Hochberg. d, Two-sided Mann-Whitney-Wilcoxon test. f, P-values of genes with shortened poly(A) in each group respect to ASD genes. g, Statistical details in simulations in method section. h, i, Two-sided unpaired t-test. Data are mean ± s.e.m. 95% CIs. *P < 0.05, **P < 0.01, ***P < 0.001.
Extended Data Fig. 4
Extended Data Fig. 4. Poly(A) changes in CPEB4-deficient mice.
Constructs design and CPEB4 protein levels of a, CPEB4 KOGT/+ (n = 7), b, CPEB4 KO (n = 3). Low complexity domain (LCD) isoform. c, d, Percentage of transcripts with poly(A)-tail changes in c, CPEB4 KOGT/+ d, CPEB4 KO Cx-St samples (n = 2), in whole transcriptome and in ASD gene-lists. e, Comparison of genes with poly(A) changes between CPEB4 KOGT/+ and CPEB4 KO mice, representation factor (RF). f, Comparison of genes with poly(A) changes between ASD cases and CPEB4-deficient mice. g, h, Fold change enrichment of brain, oligodendrocytic, astrocytic, neuronal, synaptic and ASD specific genes (SFARI cat. 1-2) with lengthened poly(A)-tail respect to total transcriptome in g, CPEB4 KOGT/+ mice and h, CPEB4 KO mice. For gel source data, see Supplementary Figure 1. a, Two-sided unpaired t-test. c, d, One-sided Fisher’s exact test, P-values of ASD transcripts with lengthened poly(A) vs. Total. e, f, Hypergeometric test. g, h, One-sided Fisher’s exact test, P-values of genes with lengthened poly(A) in each group respect to ASD genes. Data are mean ± s.e.m. 95% CIs. *P < 0.05, **P < 0.01, ***P < 0.001.
Extended Data Fig. 5
Extended Data Fig. 5. Supplemental characterization of TgCPEB4Δ4 mice.
a, Breeding protocol to obtain TgCPEB4Δ4 mice. Number of mice and percentages of births observed and expected for the four experimental genotypes. b, Kaplan-Meier curve for cumulative survival (continuous line) and probability of developing cranial dysmorphology (dashed line), (n = 44 for control, n = 39 for TgCPEB4Δ4 mice). c, Evolution of mice body weight (grams). Males (continuous line), n = 25 controls, n = 9 TgCPEB4Δ4 mice. Females (dashed line), n = 26 control, n = 7 TgCPEB4Δ4 mice. d, β-GAL nuclear staining in forebrain neurons from 1.5-month-old controls (n = 6) and TgCPEB4Δ4 mice (n = 4). Cx, cortex; St, striatum; Hipp, hippocampus; LV, lateral ventricle. Scale bars represent 250 μm. e, St CPEB4 immunohistochemistry shows cytoplasm pattern in control (n = 6), no staining in CPEB4 KO (n = 2) and overexpressing neurons in TgCPEB4Δ4 mice (n = 4). Scale bars represent 50 μm. f, Protein and g, mRNA expression levels of CPEB1-4 in forebrain at embryonic day 18 (n = 3) and Cx at 1.5 months (n = 6), 1 year (n = 4) and 2 years (n = 5) of control and TgCPEB4Δ4 mice. For gel source data, see Supplementary Figure 1. a, Pearson’s chi-squared test. c, f, g, Two-sided unpaired t-test. Data are mean ± s.e.m. 95% CIs. *P < 0.05, **P < 0.01, ***P < 0.001.
Extended Data Fig. 6
Extended Data Fig. 6. Supplemental data of global poly(A)-alteration and protein levels in TgCPEB4Δ4 mice.
a, Comparison of genes with poly(A) changes in the same or the opposite direction between human ASD cases and TgCPEB4Δ4 mice, representation factor (RF). b, Fold change enrichment of brain, oligodendrocytic, astrocytic, neuronal, synaptic and ASD specific (SFARI cat.1-2) genes with shortened poly(A)-tail respect to total genome in TgCPEB4Δ4 mice. c, Fold change enrichment of ASD (SFARI cat. 1-2, n = 62) genes shortened in TgCPEB4Δ4 mice and lengthened in CPEB4 KOGT/+ and CPEB4 KO mice vs. total genome stratified by 5’UTR, 3’UTR, CDS, gDNA length and ratio neuronal/glial expression. d, Protein levels in St of 1.5-month-old control and TgCPEB4Δ4 mice (n = 7). e, Hire-PAT assay of Auts2 poly(A)-tail in control and TgCPEB4Δ4 mice (n = 3). f, Protein levels of neuronal and astrocytic specific genes in Cx of control and TgCPEB4Δ4 mice (n = 7). For gel source data, see Supplementary Figure 1. a, Hypergeometric test. b, One-sided Fisher’s exact test, P-values of genes with shortened poly(A) in each group respect to ASD genes. c, Statistical details in simulations in method section. d-f, Two-sided unpaired t-test. Data are mean ± s.e.m. 95% CIs. *P < 0.05, **P < 0.01, ***P < 0.001.
Extended Data Fig. 7
Extended Data Fig. 7. TgCPEB4Δ4:CPEB4 KOGT/+ mice but not CPEB4 KOGT/+ mice show ASD gene protein changes.
a, Breeding protocol to obtain TgCPEB4Δ4:CPEB4 KOGT/+ mice. b, CPEB4 protein levels in Cx of Control 1.5-month-old (n = 16), CPEB4 KOGT/+ (n = 8) TgCPEB4Δ4 (n = 11) and TgCPEB4Δ4:CPEB4 KOGT/+ mice (n = 5). c, Percentage of CPEB4 splicing isoforms and Δ4/Ex4+ ratio in Cx of Control, CPEB4 KOGT/+, TgCPEB4Δ4 and TgCPEB4Δ4:CPEB4 KOGT/+ mice (n = 3) by PCR with primers annealing to exons 2 and 5. d, f, Protein levels of ASD genes in d, Control (n = 8) and TgCPEB4Δ4:CPEB4 KOGT/+ mice (n = 6) and f, Control and CPEB4 KOGT/+ mice (n = 7). e, Protein levels of neuronal and astrocytic specific genes in Cx of Control (n = 8) and TgCPEB4Δ4:CPEB4 KOGT/+ mice (n = 6). For gel source data, see Supplementary Figure 1. b, One-way ANOVA followed by Games-Howell post hoc test. c, One-way ANOVA followed by Tukey’s post hoc test. d-f, Two-sided unpaired t-test. Data are mean ± s.e.m. 95% CIs. *P < 0.05, **P < 0.01, ***P < 0.001.
Extended Data Fig. 8
Extended Data Fig. 8. TgCPEB4Δ4:CPEB4 KOGT/+ mice, but not CPEB4KOGT/+ mice, show anatomical and behavioral alteration.
a, Brain weight in 6-week-old control (n = 45), CPEB4 KOGT/+ (n = 25), TgCPEB4Δ4 (n = 13) and TgCPEB4Δ4:CPEB4 KOGT/+ (n = 6) mice and evolution of body weight of control (n = 74), CPEB4 KOGT/+ (n = 27), TgCPEB4Δ4 (n = 18) and TgCPEB4Δ4:CPEB4 KOGT/+ (n = 6) mice. b, Immunohistochemistry against anti-cleaved caspase-3 in Cx (n = 3 slices from six controls and six TgCPEB4Δ4 mice). Scale bars represent 250 μm. c, Striatal neuronal cell density in Control (n = 19) and TgCPEB4Δ4 mice (n = 5). d, Spine density (spines/μm) in cortical layers II/III of pyramidal neurons in CPEB4 KOGT/+ mice (n = 5 cells from three controls, and n = 5 cells from four CPEB4 KOGT/+ mice). e, Amplitude (pA) and frequency (Hz) of mEPSCs recorded from pyramidal neurons of the somatosensory Cx, in CPEB4 KOGT/+ mice (n = 13 cells from five controls, and n = 17 cells from six CPEB4 KOGT/+ mice). f, Ultrasonic calls of pups during 5 min after separation from their mothers as mean of data from postnatal days 6 and 12 in control (n = 36), CPEB4 KOGT/+(n = 22), TgCPEB4Δ4 (n = 17) and TgCPEB4Δ4:CPEB4 KOGT/+ (n = 4) pups. g, Stereotypical running represented as distance travelled (cm) in the periphery in the OF-test in control (n = 74), CPEB4 KOGT/+ (n = 25), TgCPEB4Δ4 (n = 19) and TgCPEB4Δ4:CPEB4 KOGT/+ (n = 6) mice. h, Time interacting with empty cage or an unfamiliar mouse during 10 min. Control (n = 40), CPEB4 KOGT/+ (n = 24), TgCPEB4Δ4 (n = 11) and TgCPEB4Δ4:CPEB4 KOGT/+ (n = 4) mice. a, One-way ANOVA followed by Games-Howell post hoc test. b, Two-sided Mann-Whitney-Wilcoxon test. c-e, Two-sided unpaired t-test. f, g, Kruskal-Wallis one-way ANOVA test. h, Two-sided Wilcoxon signed-rank test. Data are mean ± s.e.m. 95% CIs. n.s non-significative, *P < 0.05, **P < 0.01, ***P < 0.001.
Extended Data Fig. 9
Extended Data Fig. 9. Effect on ASD-like behaviors of doxycycline-mediated temporal regulation of transgene expression in TgCPEB4Δ4 mice.
a-d, TgCPEB4Δ4 mice with transgene expression starting at the age of 3 weeks (OFF/ON-TgCPEB4Δ4 mice) do not display ASD-like behavioral phenotypes. a, β-GAL nuclear staining in forebrain neurons and CPEB4 immunohistochemistry in 3 month-old control and TgCPEB4Δ4 mice (n = 3). Cx, cortex; St, striatum; Hipp, hippocampus. b, Evolution of body weight (grams) of males (n = 29 controls, n = 11 OFF/ON-TgCPEB4Δ4) and females (n = 29 control, n = 10 OFF/ON-TgCPEB4Δ4). No premature death nor cranial dysmorphology was observed in OFF/ON-TgCPEB4Δ4 mice. c, Total distance travelled by control (n = 9) and OFF/ON-TgCPEB4Δ4 (n = 7) mice and percentage of their distance in the periphery and in the center in OF test. d, Time interacting with either an empty cage, an unfamiliar mouse or without any interaction during 10 min. Control (n = 12) and OFF/ON-TgCPEB4Δ4 mice (n = 5). e-h, Silencing transgene expression in TgCPEB4Δ4 mice which have expressed the transgene during embryonic development does not revert ASD-like behaviors (ON/OFF-TgCPEB4Δ4 mice). e, Kaplan-Meier curve for cumulative survival (solid line) and percentage of mice developing cranial dysmorphology (dashed line), n = 21 for controls, n = 16 for ON/OFF-TgCPEB4Δ4. f, Evolution of body weight (grams): males (n = 19 controls and n = 10 ON/OFF-TgCPEB4Δ4), females (n = 12 control and n = 6 ON/OFF-TgCPEB4Δ4). g, Total distance travelled by control (n = 16) and ON/OFF-TgCPEB4Δ4 (n = 10) mice and percentage of their distance in the periphery and in the center in OF test. h, Time interacting with either an empty cage, an unfamiliar mouse or without any interaction during 10 min. Control (n = 20) and ON/OFF-TgCPEB4Δ4 mice (n = 13). b-d, f, Two-sided unpaired t-test. g-h, Two-sided Mann-Whitney-Wilcoxon test. h, Two-sided Wilcoxon signed-rank test. Data are mean ± s.e.m. 95% CIs. n.s non-significative, *P < 0.05, **P < 0.01, ***P < 0.001.
Fig. 1
Fig. 1. ASD-risk gene mRNAs bear CPEs and bind CPEB4.
a, Percentage of CPEB1- and/or CPEB4-binder transcripts in mouse St. b-c, Percentage of transcripts, with b, canonical CPEs and c, bound by CPEB4 in control gene sets and high-confidence ASD-risk genes (SFARI cat. 1-3, ASD39 and Takata lists). b-c, One-sided Fisher’s exact test, ***significant (P<0.05) respect total, brain and synaptic transcriptomes, ****significant (P<0.05) respect each control set.
Fig. 2
Fig. 2. CPEB4 alteration in idiopathic ASD brains.
CPEB4 a, mRNA b, protein levels in Cx. c, Alternatively spliced exons (3 and 4) of CPEB4, putative phosphorylation sites. d, Percent Spliced in (PSI). e-h, RT-PCR in CTRL (n=10) and idiopathic ASD cases (n=11) under 35-year-old, e-f, with external primers e, CPEB4 isoforms percentage, f, exon4–excluding (Δ4)/exon4-including (Ex4+) isoform ratio. g-h, Digital-droplet PCR g, CPEB4 isoform percentage normalized respect CTRL, h, Δ4/Ex4+ ratio. For gel source data, see Supplementary Figure 1. a, d, f, h, Two-sided Mann-Whitney-Wilcoxon test. b, e, g, Two-sided unpaired t-test. Box plots show median, 25th, 75th percentiles. Data are mean ± s.e.m. 95% confidence intervals (CIs).
Fig. 3
Fig. 3. ASD-risk gene mRNA deadenylation and decreased protein levels.
a, Poly(A)-tail length changes in Cx of ASD cases (n=6) vs. CTRL (n=5) in whole transcriptome and in ASD gene-lists. b, CPEB4 binders in ASD genes according to their poly(A)-tail change. c, Protein levels in Cx of idiopathic ASD (n=11) and CTRL (n=10) under 35-year-old. d, mRNA levels, ASD (n=6), CTRL (n=5). a, One-sided Fisher’s exact test, P-values of ASD deadenylated transcripts vs. Total. b, One-sided Fisher’s exact test. c, d, Two-sided unpaired t-test. Box plots show median, 25th, 75th percentiles. Data are mean ± s.e.m. 95% CIs.
Fig. 4
Fig. 4. ASD-like poly(A) changes in TgCPEB4Δ4 mice.
a, Transgenesis construct design. CPEB4 b, splicing isoform percentage and c, Δ4/Ex4+ ratio in St of 1.5-month-old control (n=9), TgCPEB4Δ4 (n=7). d, Comparison of poly(A) changes in ASD cases vs. TgCPEB4Δ4 mice, representation factor (RF). e, Transcripts with poly(A)-tail changes in Cx-St of controls vs. TgCPEB4Δ4 (n=3) in whole transcriptome and ASD gene-lists. f, Protein levels in Cx of 1.5-month-old control and TgCPEB4Δ4 (n=7), g, mRNA levels (n=3). b, f-g, Two-sided unpaired t-test. c, f, Two-sided Mann-Whitney-Wilcoxon test. d, Hypergeometric test. e, One-sided Fisher’s exact test, P-values of ASD deadenylated transcripts vs. Total. Box plots show median, 25th, 75th percentiles. Data are mean ± s.e.m. 95% CIs.
Fig. 5
Fig. 5. ASD-like phenotypes in TgCPEB4Δ4 mice.
a, Forebrain Volume, control (n=10), TgCPEB4Δ4 (n=5). b, Spine density (n=14 cells from five controls, n=12 cells from four TgCPEB4Δ4). c, mEPSCs (n=11 cells from five controls, n=9 cells from five TgCPEB4Δ4). d, Distance travelled, control (n=60), TgCPEB4Δ4 (n=16). e, Time spent in closed/open arms, control (n=15),TgCPEB4Δ4 (n=10). f, Ultrasonic calls, control (n=20), TgCPEB4Δ4 (n=13). g, Time interacting with empty cage and unfamiliar mouse, control (n=20), TgCPEB4Δ4 (n=7). a-c, f, Two-sided unpaired t-test. d, f-g, Two-sided Mann-Whitney-Wilcoxon test. e, Two-sided paired t-test. g, Two-sided Wilcoxon signed-rank test. Data are mean ± s.e.m. 95% CIs, n.s non-significative.

References

    1. Hallmayer J, et al. Genetic heritability and shared environmental factors among twin pairs with autism. Archives of general psychiatry. 2011;68:1095–1102. - PMC - PubMed
    1. Sandin S, et al. The familial risk of autism. Jama. 2014;311:1770–1777. - PMC - PubMed
    1. De Rubeis S, Buxbaum JD. Genetics and genomics of autism spectrum disorder: Embracing complexity. Human molecular genetics. 2015 - PMC - PubMed
    1. Kim YS, Leventhal BL. Genetic epidemiology and insights into interactive genetic and environmental effects in autism spectrum disorders. Biological psychiatry. 2015;77:66–74. - PMC - PubMed
    1. Sztainberg Y, Zoghbi HY. Lessons learned from studying syndromic autism spectrum disorders. Nature neuroscience. 2016;19:1408–1417. - PubMed

Publication types

MeSH terms