. 2018 Aug;560(7720):595-600.
doi: 10.1038/s41586-018-0415-5. Epub 2018 Aug 15.

Modulating plant growth-metabolism coordination for sustainable agriculture

Affiliations

Modulating plant growth-metabolism coordination for sustainable agriculture

Shan Li et al. Nature. 2018 Aug.

Abstract

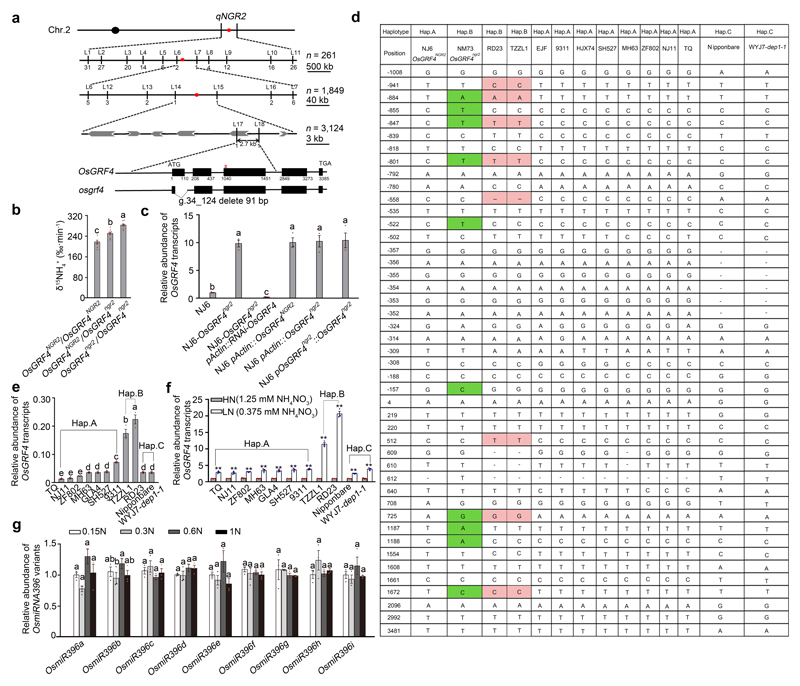
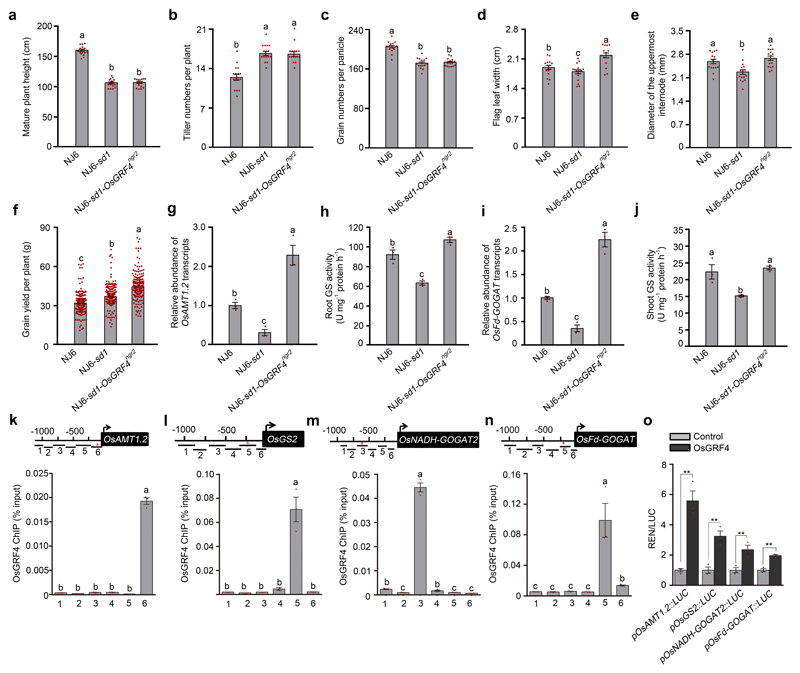
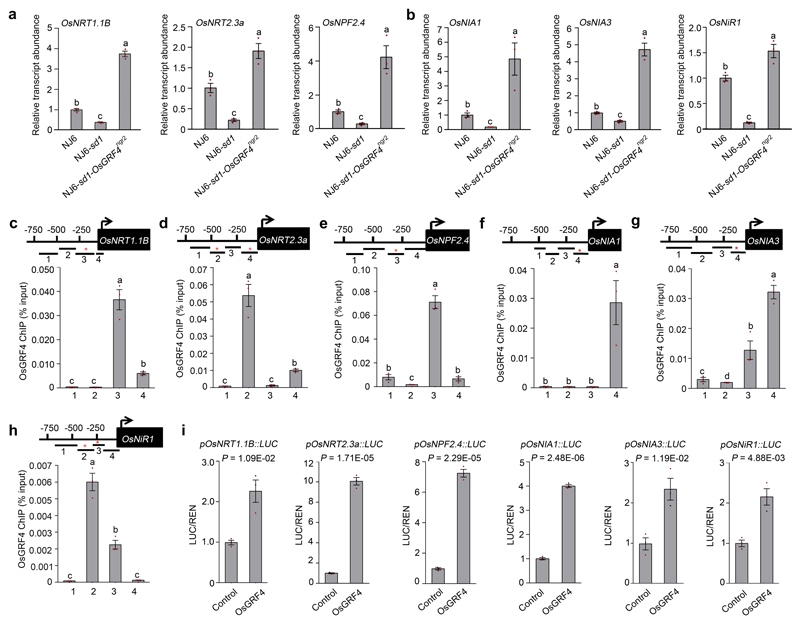
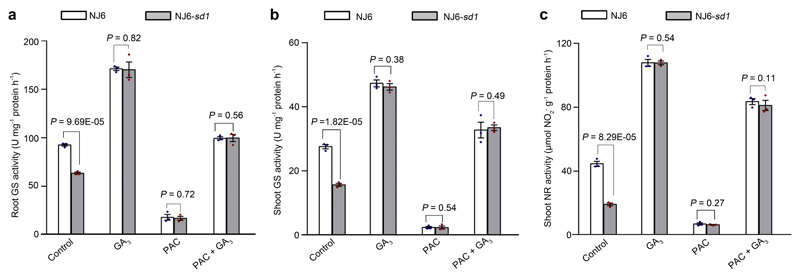
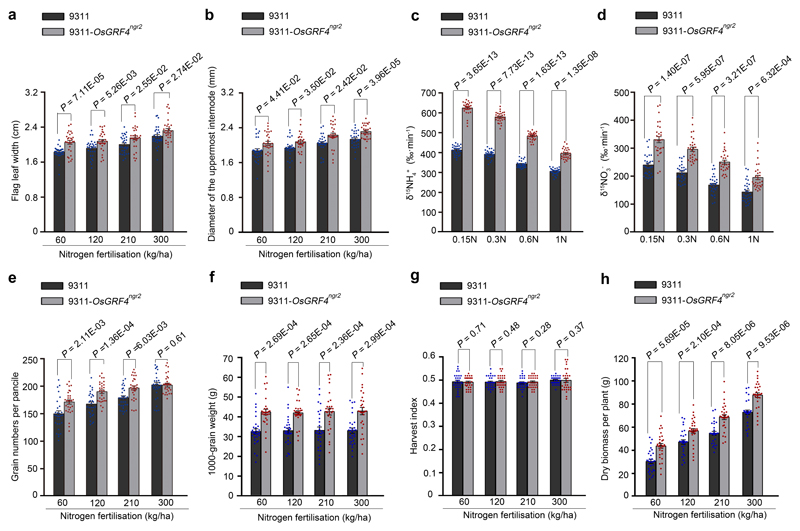
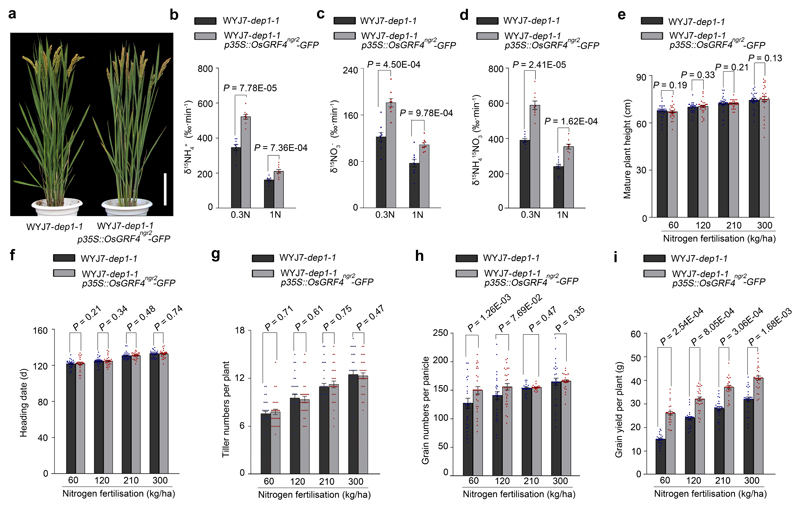
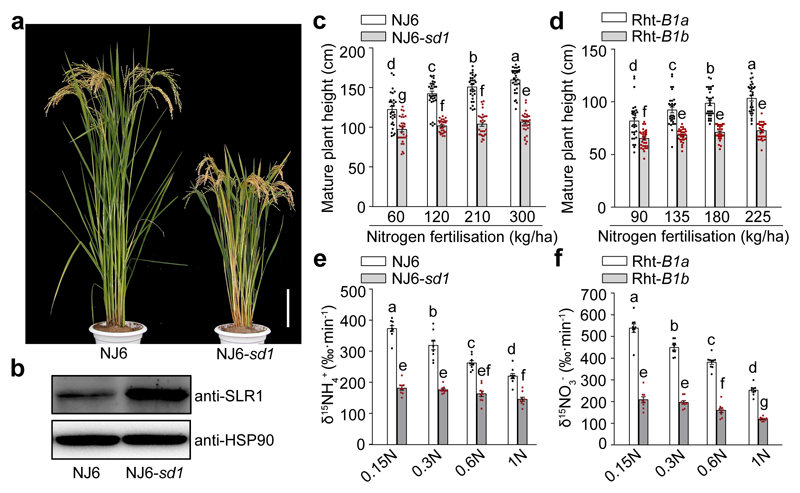
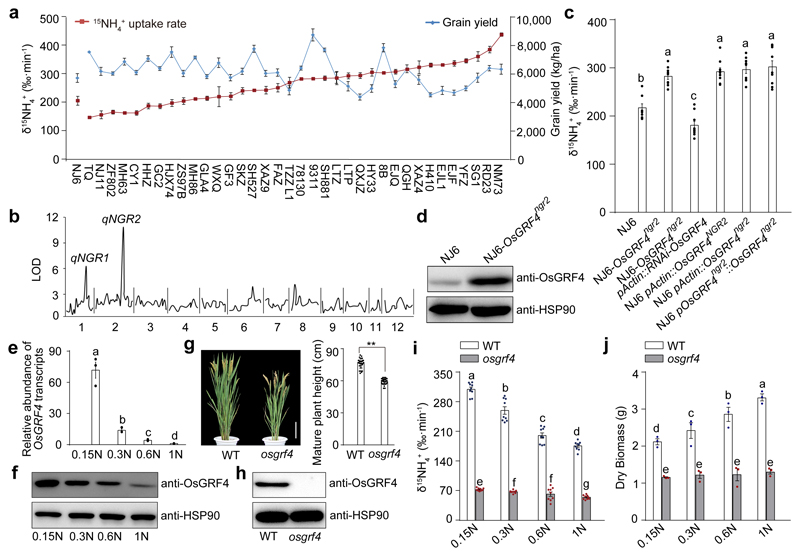
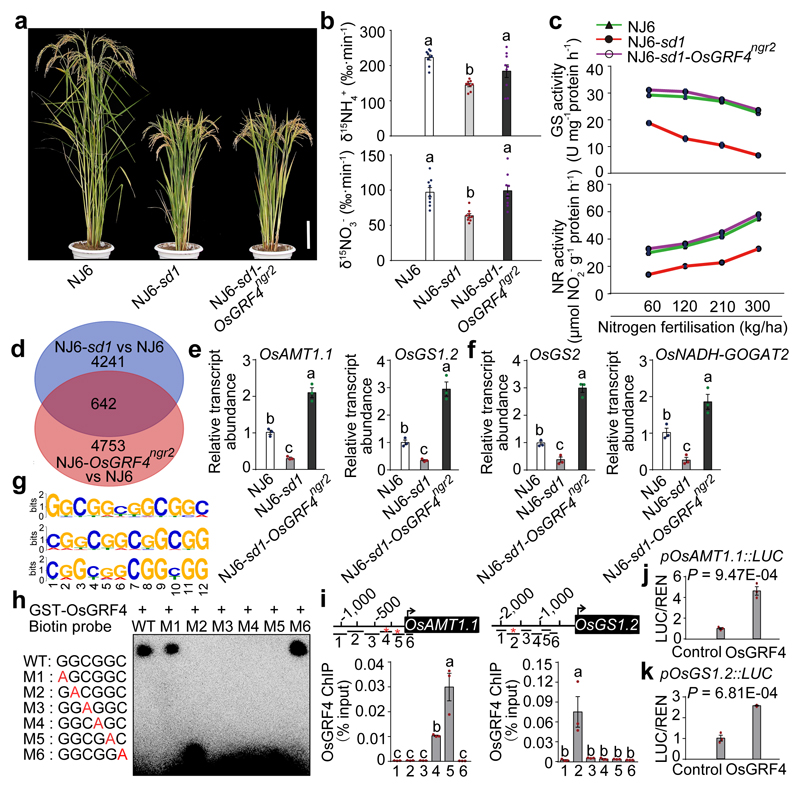
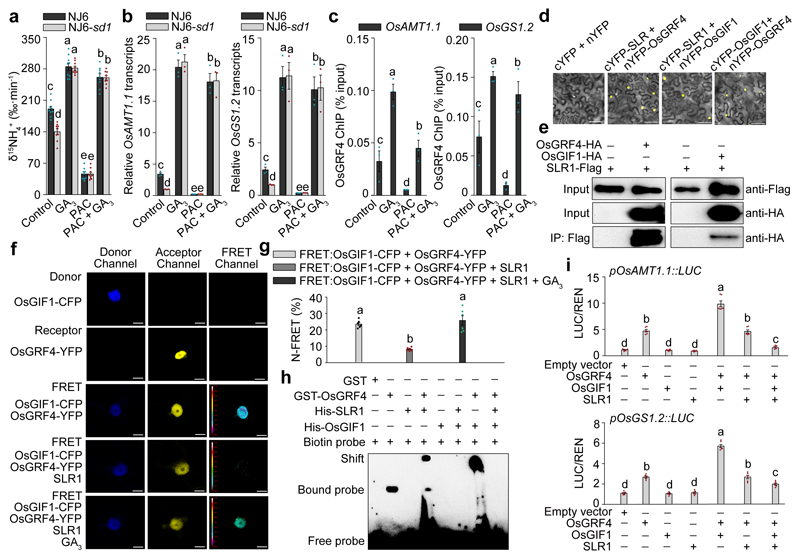
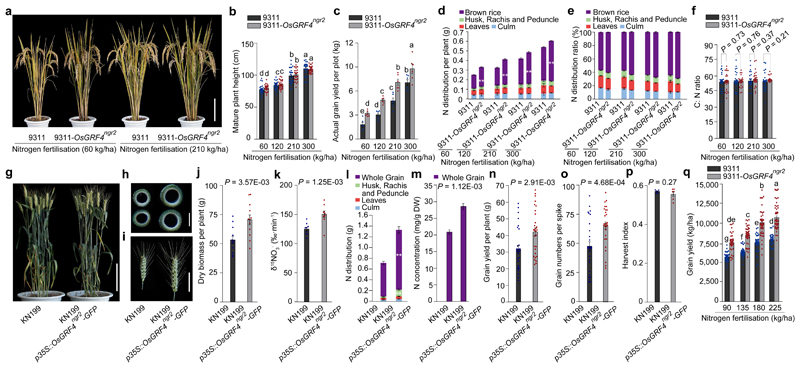
Enhancing global food security by increasing the productivity of green revolution varieties of cereals risks increasing the collateral environmental damage produced by inorganic nitrogen fertilizers. Improvements in the efficiency of nitrogen use of crops are therefore essential; however, they require an in-depth understanding of the co-regulatory mechanisms that integrate growth, nitrogen assimilation and carbon fixation. Here we show that the balanced opposing activities and physical interactions of the rice GROWTH-REGULATING FACTOR 4 (GRF4) transcription factor and the growth inhibitor DELLA confer homeostatic co-regulation of growth and the metabolism of carbon and nitrogen. GRF4 promotes and integrates nitrogen assimilation, carbon fixation and growth, whereas DELLA inhibits these processes. As a consequence, the accumulation of DELLA that is characteristic of green revolution varieties confers not only yield-enhancing dwarfism, but also reduces the efficiency of nitrogen use. However, the nitrogen-use efficiency of green revolution varieties and grain yield are increased by tipping the GRF4-DELLA balance towards increased GRF4 abundance. Modulation of plant growth and metabolic co-regulation thus enables novel breeding strategies for future sustainable food security and a new green revolution.


Conflict of interest statement

Competing interests The authors declare no competing interests.

Figures

Extended Data Figure 1
Extended Data Figure 1. Allelic variation at the OsGRF4 locus affects OsGRF4 mRNA abundance and root 15NH4+ uptake.
a, Positional cloning indicates the equivalence of OsGRF4 with qNGR2 (N-mediated growth response 2). Successive maps show progressive narrowing of focus of qNGR2 (red dot, using recombination break points and linked DNA markers) to an ~2.7-kbp region on chromosome 2 flanked by molecular markers L17 and L18 and overlapping candidate gene LOC_Os02g47280 (also known as OsGRF4). The start ATG (nucleotide 1) and close TGA (nucleotide 3385) of OsGRF4 are shown, together with protein-encoding DNA sequence (CDS, thick black bars). The target site for OsmiR396 is indicated by an *. The structure of a CRISPR/Cas9 generated osgrf4 mutant 91-bp deletion allele spanning parts of exon 1 and intron 1 is shown. b, 15NH4+ uptake rates of roots of BC2F2 progeny (derived from a NJ6 × NM73 cross) homozygous or heterozygous for OsGRF4NGR2 or OsGRF4ngr2 grown in high N supply (1.25 mM NH4NO3). Data shown as mean ± s.e.m. (n = 9). Different letters denote significant differences (P < 0.05, Duncan's multiple range test). c, OsGRF4 mRNA abundance in plants (genotypes as shown) relative to the abundance in NJ6 (set to one). Data shown as mean ± s.e.m. (n = 3). Different letters denote significant differences (P < 0.05, Duncan's multiple range test). d, Natural varietal OsGRF4 allelic variation. Nucleotide position relative to the OsGRF4 start ATG is shown in a. SNPs shared between varieties NM73, RD23, and TZZL1 are highlighted. Sequences representative of OsGRF4 promoter haplotypes A, B and C (see main text) are shown. e, OsGRF4 mRNA abundance in various rice varieties under the high N conditions (1.25 mM NH4NO3), OsGRF4 promoter haplotypes as indicated. Abundance data is all relative to the abundance of rice Actin2 mRNA. Data shown as mean ± s.e.m. (n = 3). Different letters denote significant differences (P < 0.05, Duncan's multiple range test). f, Comparisons of OsGRF4 mRNA abundance in selected rice varieties grown in between high (HN, 1.25 mM NH4NO3) and low (LN, 0.375 mM NH4NO3) N conditions. Data shown as mean ± s.e.m. (n = 3). Abundance data is all relative to that in HN (set to one). ** P < 0.05 as compared to HN by two-sided Student’s t-test. g, Relative abundances of rice OsmiR396 family members in NJ6 plants grown at different levels of N supply (0.15N, 0.1875 mM NH4NO3; 0.3N, 0.375 mM NH4NO3; 0.6N, 0.75 mM NH4NO3; 1N, 1.25 mM NH4NO3), shown relative to abundance in plants grown in 1N conditions (set to one). Data shown as mean ± s.e.m. (n = 3). Different letters denote significant differences (P < 0.05, Duncan's multiple range test).
Extended Data Figure 2
Extended Data Figure 2. Comparisons NJ6, NJ6-sd1 and NJ6-sd1-OsGRF4ngr2 isogenic line traits reveals that OsGRF4 regulates expression of NH4+ metabolism genes.
a, Mature plant height. Data shown as mean ± s.e.m. (n = 16). Different letters denote significant differences (P < 0.05, Duncan's multiple range test). b, The number of tillers per plant. c, The number of grains per panicle. Data shown as mean ± s.e.m. (n = 16). Different letters denote significant differences (P < 0.05, Duncan's multiple range test). d, Flag-leaf width. Data shown as mean ± s.e.m. (n = 16). Different letters denote significant differences (P < 0.05, Duncan's multiple range test). e, Culm (stem) width expressed as diameter of the uppermost internode. Data shown as mean ± s.e.m. (n = 16). Different letters denote significant differences (P < 0.05, Duncan's multiple range test). f, Grain yield per plant. Data shown as mean ± s.e.m. (n = 220). Different letters denote significant differences (P < 0.05, Duncan's multiple range test). g, Relative root abundance of OsAMT1.2 mRNA in NILs, genotypes as indicated. Abundance shown relative to that in NJ6 plants (=1). Data shown as mean ± s.e.m. (n = 3). Different letters denote significant differences (P < 0.05, Duncan's multiple range test). h, Root glutamine synthase (GS) activities. Data shown as mean ± s.e.m. (n = 3). Different letters denote significant differences (P < 0.05, Duncan's multiple range test). i, Relative shoot abundance of OsFd-GOGAT mRNA. Abundance shown relative to that in NJ6 plants (=1). Data shown as mean ± s.e.m. (n = 3). Different letters denote significant differences (P < 0.05, Duncan's multiple range test). j, Shoot glutamine synthase (GS) activities. Data shown as mean ± s.e.m. (n = 3). Different letters denote significant differences (P < 0.05, Duncan's multiple range test). k-n, Flag-OsGRF4 mediated ChIP-PCR enrichment (relative to input) of GCGG-containing promoter fragments (marked with *) from OsAMT1.2, OsGS2, OsNADH-GOGAT2 and OsFd-GOGAT promoters. Diagrams depict putative OsAMT1.2, OsGS2, OsNADH-GOGAT2 and OsFd-GOGAT promoters and fragments (1-6). Data shown as mean ± s.e.m. (n = 3; panels k-n). Different letters denote significant differences (P < 0.05, Duncan's multiple range test). o, OsGRF4 activates pOsAMT1.2, pOsGS2, pOsNADH-GOGAT2 and pOsFd-GOGAT promoter::Luciferase fusion constructs in transient transactivation assays. Data shown as mean ± s.e.m. (n = 3). ** P < 0.05 as compared to control group by two-sided Student’s t-tests.
Extended Data Figure 3
Extended Data Figure 3. OsGRF4 regulates expression of multiple NO3- metabolism genes.
a, Relative abundance of NO3- uptake transporter-encoding OsNRT1.1B, OsNRT2.3a and OsNPF2.4 mRNAs. Abundance shown relative to that in NJ6 (=1). Data shown as mean ± s.e.m. (n = 3). Different letters denote significant differences (P < 0.05, Duncan's multiple range test). b, Relative abundances of OsNIA1, OsNIA3 and OsNiR1 mRNAs encoding NO3- assimilation enzymes. Abundance shown relative to that in NJ6 (=1). Data shown as mean ± s.e.m. (n = 3). Different letters denote significant differences (P < 0.05, Duncan's multiple range test). c-h, Flag-OsGRF4 mediated ChIP-PCR enrichment (relative to input) of GCGG-containing fragments (marked with *) from NO3- uptake transporter-encoding (c) OsNRT1.1B, (d) OsNRT2.3a and (e) OsNPF2.4 gene promoters; NO3- assimilation enzyme-encoding (f) OsNIA1, (g) OsNIA3 and (h) OsNiR1 gene promoters. Data shown as mean ± s.e.m. (n = 3). Different letters denote significant differences (P < 0.05, Duncan's multiple range test). i, OsGRF4 activates pOsNRT1.1B, pOsNRT2.3a, pOsNPF2.4, pOsNIA1, pOsNIA3 and pOsNiR1 promoter::Luciferase fusion constructs in transient transactivation assays. Data shown as mean ± s.e.m. (n = 3) in all panels. A two-sided Student’s t-test was used to generate the P values.
Extended Data Figure 4
Extended Data Figure 4. GA promotes GS and NR activities.
a, GS activities in roots of 2-week-old rice plants treated with 100 μM GA (GA3) and/or 2 μM paclobutrazol (PAC), genotypes as indicated. Data shown as mean ± s.e.m. (n = 3). A two-sided Student’s t-test was used to generate the P values. b, GS activities in shoots of plants treated with GA and/or PAC, genotypes and treatments as indicated in a. Data shown as mean ± s.e.m. (n = 3). A two-sided Student’s t-test was used to generate the P values. c, NR activities in shoots of plants treated with GA and/or PAC, genotypes and treatments as indicated in a. Data shown as mean ± s.e.m. (n = 3). A two-sided Student’s t-test was used to generate the P values.
Extended Data Figure 5
Extended Data Figure 5. BiFC visualisation of SLR1-OsGIF1-OsGRF4 interactions.
a, Details of constructs expressing OsGRF4 and variants deleted for specific domains. OsGRF4 contains the QLQ (Gln, Leu, Gln) and WRC (Trp, Arg, Cys) domains, positions as indicated. b, BiFC assays. Constructs expressing OsGRF4 or deletion variants (shown as in a) tagged with the N-terminus of YFP were co-transformed into tobacco leaf epidermal cells, together with constructs expressing OsGIF1 or SLR1 tagged with the C-terminus of YFP, respectively. Scale bar, 60 μm. c, BiFC assays. Constructs expressing OsGRF1 or related OsGRFs and OsGIFs family protein tagged with the N-terminus of YFP-tagged were co-transformed into tobacco leaf epidermal cells together with a construct expressing SLR1 tagged with the C-terminus of YFP. Scale bar, 60 μm. The pictures of BiFC assays represent one of the three experiments performed independently with similar results (panels b and c).
Extended Data Figure 6
Extended Data Figure 6. SLR1 inhibits OsGRF4-OsGIF1 self-promotion of OsGRF4 mRNA and OsGRF4 protein abundance.
a, OsGFR4 mRNA abundance, plant genotypes as indicated. Abundance shown relative to that in NJ6 (=1). Data shown as mean ± s.e.m. (n = 3). Different letters denote significant differences (P < 0.05, Duncan's multiple range test). b, The effects of GA and PAC on OsGRF4 mRNA abundance in 2-week-old NJ6 plants. Abundance shown relative to that in water treatment control (=1). Data shown as mean ± s.e.m. (n = 3). Different letters denote significant differences (P < 0.05, Duncan's multiple range test). c, ChIP-PCR OsGRF4-mediated enrichment (relative to input) of GCGG-containing OsGRF4 promoter fragments (marked with *). Data shown as mean ± s.e.m. (n = 3). Different letters denote significant differences (P < 0.05, Duncan's multiple range test). d, OsGRF4-activated promotion of transcription from the OsGRF4 gene promoter-luciferase reporter construct is enhanced by OsGIF1 and inhibited by SLR1. Abundance of LUC/REN shown relative to that in empty vector control (=1). Data shown as mean ± s.e.m. (n = 3). Different letters denote significant differences (P < 0.05, Duncan's multiple range test). e, OsGRF4 abundance (as detected by an anti-OsGRF4 antibody), plant genotypes as indicated. HSP90 serves as loading control. The pictures of western blots represent one of the three experiments performed independently with similar results.
Extended Data Figure 7
Extended Data Figure 7. The OsGRF4-SLR1 antagonism regulates carbon assimilation and plant growth.
a, b, Relative shoot abundances of C-fixation gene mRNAs. Abundances of transcripts of genes regulating photosynthesis (a), sucrose metabolism and transport/phloem loading (b) in NJ6, NJ6-sd1 and NJ6-sd1-OsGRF4ngr2 plants. Data shown as mean ± s.e.m. (n = 3). Abundances in NJ6 and NJ6-sd1-OsGRF4ngr2 expressed relative to NJ6-sd1 (= 1). Different letters denote significant differences (P < 0.05, Duncan's multiple range test). c, ChIP-PCR assays. Diagram depicts the OsPsbS1, OsTPS1 and OsSWEET11 promoters and regions used for ChIP-PCR, and GCGG-containing promoter fragment (marked with *) enrichment (relative to input). Data shown as mean ± s.e.m. (n = 3). Different letters denote significant differences (P < 0.05, Duncan's multiple range test). d, Transactivation assays. The LUC/REN activity obtained from a co-transfection with an empty effector construct and indicated reporter constructs was set to be one. Data shown as mean ± s.e.m. (n = 9). Different letters denote significant differences (P < 0.05, Duncan's multiple range test). e, Immunoblot detection of OsLhca1, OsLhca3, OsLhca4, OsLhcb2, OsPsaD and OsPsaE using antibodies as shown in genotypes as indicated. HSP90 serves as loading control. The pictures of western blots represent one of the three experiments performed independently with similar results. f-i, Comparisons of photosynthetic rates (f), biomass (g), C content (h) and C:N ratio (i) among NJ6, NJ6-sd1 and NJ6-sd1-OsGRF4ngr2 plants. Data shown as mean ± s.e.m. (n = 30). Different letters denote significant differences (P < 0.05, Duncan's multiple range test). j, Relative shoot abundances of mRNAs transcribed from cell-cycle regulatory genes in NJ6, NJ6-sd1 and NJ6-sd1-OsGFR4ngr2 plants. Transcription relative to the level in NJ6-sd1 plants (set to one). Data shown as mean ± s.e.m. (n = 3). Different letters denote significant differences (P < 0.05, Duncan's multiple range test). k, ChIP-PCR assays. Diagram depicts the OscycA1.1 and Oscdc2Os-3 promoters and regions (GCGG-containing fragment marked with *) used for ChIP-PCR. Data shown as mean ± s.e.m. (n = 3). Different letters denote significant differences (P < 0.05, Duncan's multiple range test).l, Transactivation assays from the OscycA1.1 and Oscdc2Os-3 promoters. Data shown as mean ± s.e.m. (n = 12). Different letters denote significant differences (P < 0.05, Duncan's multiple range test).
Extended Data Figure 8
Extended Data Figure 8. Natural allelic variation at OsGRF4 is associated with variation in plant and grain morphology and grain yield performance.
a, DNA polymorphisms in the promoter region of OsGRF4. Green-shaded regions indicate the three unique SNP variations associated with phenotypic variation in NM73 and RD23. b-f, Boxplots for plant height (b), grain length (c), grain width (d), the number of grains per panicle (e), and grain yield performance (f) of rice varieties carrying different OsGRF4 promoter haplotypes (Hap.; A, B or C). All data from plants grown in normal paddy-field fertilization conditions. Data shown as mean ± s.e.m. (Hap. A, n = 74; Hap. B, n = 28; Hap. C, n = 123). The violin map was constructed in R. Different letters above columns indicate statistically significant differences between groups (Tukey’s honestly significant difference (HSD) test, P < 0.05; panels b-f).
Extended Data Figure 9
Extended Data Figure 9. Agronomic traits displayed by 9311 and 9311-OsGRF4ngr2 plants grown at varying N fertilisation levels.
a, Flag leaf width. Data shown as mean ± s.e.m. (n = 30). A two-sided Student’s t-test was used to generate the P values. b, Culm width of the uppermost internode. Data shown as mean ± s.e.m. (n = 30). A two-sided Student’s t-test was used to generate the P values. c, 15NH4+ uptake. d, 15NO3- uptake. Data shown as mean ± s.e.m. (n = 30). A two-sided Student’s t-test was used to generate the P values. Rice root 15NH4+ (c) and 15NO3- (d) uptake rates of 4-week old plants grown in varying N supply (0.15N, 0.1875 mM NH4NO3; 0.3N, 0.375 mM NH4NO3; 0.6N, 0.75 mM NH4NO3; 1N, 1.25 mM NH4NO3). e, The number of grains per panicle. Data shown as mean ± s.e.m. (n = 30). A two-sided Student’s t-test was used to generate the P values. f, 1,000-grain weight. Data shown as mean ± s.e.m. (n = 30). A two-sided Student’s t-test was used to generate the P values. g, Harvest index. Data shown as mean ± s.e.m. (n = 30). A two-sided Student’s t-test was used to generate the P values. h, Dry biomass per plant. Data shown as mean ± s.e.m. (n = 30). A two-sided Student’s t-test was used to generate the P values.
Extended Data Figure 10
Extended Data Figure 10. Growth, N uptake and grain yield performance of WYJ7-dep1-1 and transgenic WYJ7-dep1-1 plants carrying the p35S::OsGRF4ngr2-GFP construct at varying levels of N fertilization.
a, Mature plant heights. Scale bar, 15 cm. The picture represents one of the three experiments performed independently with similar results. b-d, Root uptake rates for (b) 15NH4+, (c) 15NO3- and (d) 15NH4+ and 15NO3- combined. The 4-week-old rice plants grown in low N (0.3N, 0.375 mM NH4NO3) and high N (1N, 1.25 mM NH4NO3) conditions, respectively. Data shown as mean ± s.e.m. (n = 9; panels b-d). A two-sided Student’s t-test was used to generate the P values. e, Mature plant height. Data shown as mean ± s.e.m. (n = 30). A two-sided Student’s t-test was used to generate the P values. f, Heading date. Data shown as mean ± s.e.m. (n = 30). A two-sided Student’s t-test was used to generate the P values. g, The number of tillers per plant. Data shown as mean ± s.e.m. (n = 30). A two-sided Student’s t-test was used to generate the P values. h, The number of grains per panicle. Data shown as mean ± s.e.m. (n = 30). A two-sided Student’s t-test was used to generate the P values. i, Grain yield per plant. Data shown as mean ± s.e.m. (n = 30). A two-sided Student’s t-test was used to generate the P values.
Figure 1
Figure 1. DELLA accumulation inhibits growth, N-response and N-uptake of rice and wheat GRVs.
a, Indica rice variety Nanjing6 (NJ6) and near- isogenic NJ6-sd1 plants. Scale bar, 15 cm. b, Accumulation of SLR1. Heat shock protein 90 (HSP90) serves as loading control. The pictures of western blots represent one of the three experiments performed independently with similar results. c, d, Heights of (c) rice and (d) wheat plants. Data shown as mean ± s.e.m. (n = 30). e, 15NH4+ uptake rates in varying N supply (0.15N, 0.1875 mM NH4NO3; 0.3N, 0.375 mM NH4NO3; 0.6N, 0.75 mM NH4NO3; 1N, 1.25 mM NH4NO3). f, 15NO3- uptake rates in varying N supply (0.15N, 0.1875 mM Ca(NO3)2; 0.3N, 0.375 mM Ca(NO3)2; 0.6N, 0.75 mM Ca(NO3)2; 1N, 1.25 mM Ca(NO3)2). Data (e, f) shown as mean ± s.e.m. (n = 9). Different letters denote significant differences (P < 0.05; panels c-f; Duncan's multiple range test).
Figure 2
Figure 2. OsGRF4 regulates rice NH4+ uptake and growth response to N availability.
a, Variation in 15NH4+ uptake and grain yield. 4-week-old rice plants (15NH4+ uptake assays) were grown hydroponically with high N supply (1.25 mM NH4NO3). Data shown as mean ± s.e.m. (n = 6). Field-grown rice plants (yield assays) were grown with urea supply (210 kg/ha). Data shown as mean ± s.e.m. of six plots (each plot contained 220 plants) per line. b, QTL analysis. c, 15NH4+ uptake rate. d, Accumulation of OsGRF4. e, OsGRF4 transcript abundance in NJ6 roots grown in increasing N supply (0.15N, 0.1875 mM NH4NO3; 0.3N, 0.375 mM NH4NO3; 0.6N, 0.75 mM NH4NO3; 1N, 1.25 mM NH4NO3). Transcription relative to that of 1N (set to one). f, Accumulation of OsGRF4 in NJ6. g, Mature plant height of the rice osgrf4 mutant (Extended Data Fig. 1a). Scale bar, 15 cm. Data shown as mean ± s.e.m. (n = 20). ** P < 0.05 as compared to WT group by two-sided Student’s t-test. h, Accumulation of OsGRF4. HSP90 serves as loading control (panels d, f and h). i, 15NH4+ uptake rate. Data (c, i) shown as mean ± s.e.m. (n = 9). j, Dry weight of 4-week-old plants. Data (e, j) shown as mean ± s.e.m. (n = 3). Different letters denote significant differences (P < 0.05; panels c, i and j; Duncan's multiple range test). The pictures represent one of the three experiments performed independently with similar results (panels b, d, f and h).
Figure 3
Figure 3. OsGRF4 regulates expression of multiple N metabolism genes.
a, Mature plants. Scale bar, 15 cm. b, 15NH4+ and 15NO3- uptake rates. Data shown as mean ± s.e.m. (n = 9). c, Glutamine synthase (GS) and nitrate reductase (NR) activities in shoots of rice plants grown in paddy-field conditions with increasing urea supply. d, RNA-seq analysis. 4883 genes had transcript abundances down-regulated in NJ6-sd1 (versus NJ6; blue), 5395 genes had transcript abundances up-regulated in NJ6-OsGRF4ngr2 (versus NJ6; orange), with 642 genes common to both. e, f, Root (e) and shoot (f) mRNA abundances relative to NJ6 (set to one). g, Sequence motifs enriched in ChIP-seq with Flag-tagged OsGRF4. h, EMSA assays. The pictures (a, h) represent one of the three experiments performed independently with similar results. i, Flag-OsGRF4 mediated ChIP-PCR enrichment (relative to input) of GCGG-containing promoter fragments (marked with *) from OsAMT1.1 and OsGS1.2. Different letters denote significant differences (P < 0.05; panels b, e, f and i; Duncan's multiple range test). j, k, Transactivation assays. Data (c, e-f, i and j-k) shown as mean ± s.e.m. (n = 3). A two-sided Student’s t-test was used to generate the P values.
Figure 4
Figure 4. Competitive OsGRF4-OsGIF1-SLR1 interactions coordinate NH4+ uptake and assimilation.
a, 15NH4+ uptake rates in 4-week-old plants treated with 100 μM GA3 and/or 2 μM paclobutrazol (PAC). Data shown as mean ± s.e.m. (n = 9). b, Root mRNA abundance relative to the level in NJ6-sd1 plants (set to one). c, Extent of ChIP-PCR OsGRF4-mediated enrichment (relative to input) of GCGG-containing promoter fragments from OsAMT1.1 (fragment 5) and OsGS1.2 (fragment 2) (shown in Fig. 3i). Data (b, c) shown as mean ± s.e.m. (n = 3). d, BiFC assays. Scale bar, 60 μm. e, Co-IP experiments. f, FRET images. Scale bar, 200 μm. g, Mean N-FRET data for OsGIF1-CFP and OsGRF4-YFP channels. h, EMSA assays. The pictures represent one of the three experiments performed independently with similar results (d-f, h). i, Transactivation assays. The LUC/REN activity obtained from co-transfection with an empty effector construct and indicated reporter constructs was set to one. Data (g, h) shown as mean ± s.e.m. (n = 6). Different letters denote significant differences (P < 0.05; panels a-c, g and i; Duncan's multiple range test).
Figure 5
Figure 5. Elevated OsGRF4 abundance increases grain yield and NUE of rice and wheat GRVs without increasing mature plant height.
a, Appearance of mature plants. Scale bar, 15 cm. b, Plant height. c, Grain yield. Data shown as mean ± s.e.m. of six plots (each plot contained 220 plants) per line per N level. d, e, N distribution per plant (d) and ratio (%; e) of plants shown in b. ** P < 0.05, 9311-OsGRF4ngr2 compared with 9311 by two-sided Student’s t-test (panels d and e). f, C:N ratio of plants shown in b. Data (b, d-f) shown as mean ± s.e.m. (n = 30). g, Mature wheat plant morphology. Scale bar, 15 cm. h, Cross section of the uppermost internode of (left) KN199 and (right) KN199 p35S::OsGRF4ngr2-GFP wheat plants. Scale bar, 2 mm. i, Spike length. Scale bar, 5 cm. The pictures represent one of the three experiments performed independently with similar results (panels a, g-i). j, Biomass accumulation. Data shown as mean ± s.e.m. (n = 12). k, 15NO3- uptake rate. l, N distribution. Data (k, l) shown as mean ± s.e.m. (n = 9). ** P < 0.05, KN199 p35S::OsGRF4ngr2-GFP compared with KN199 by two-sided Student’s t-test. m, N concentrations. Data shown as mean ± s.e.m. (n = 20). n, Grain yield. o, Grain number. Data (n, o) shown as mean ± s.e.m. (n = 30). p, Harvest index. Data shown as mean ± s.e.m. (n = 6). A two-sided Student’s t-test was used to generate the P values (panels f, j-k and m-p). q, Overall grain yield. Data shown as mean ± s.e.m. (n = 60). Different letters denote significant differences (P < 0.05; panels b, c and q; Duncan's multiple range test).

Comment in

References

    1. Khush GS. Green revolution: preparing for the 21st century. Genome. 1999;42:646–655. - PubMed
    1. Pingali PL. Green Revolution: Impacts, limits, and the path ahead. Proc Natl Acad Sci USA. 2012;109:12302–12308. - PMC - PubMed
    1. Evenson RE, Gollin D. Assessing the impact of the green revolution, 1960 to 2000. Science. 2003;300:758–762. - PubMed
    1. Hedden P. The genes of the Green Revolution. Trends Genet. 2003;19:5–9. - PubMed
    1. Peng J, et al. Green revolution genes encode mutant gibberellin response modulators. Nature. 1999;400:256–261. - PubMed

Publication types