. 2018 Nov;11(6):1684-1693.
doi: 10.1038/s41385-018-0047-y. Epub 2018 Aug 15.

High-dimensional immune phenotyping and transcriptional analyses reveal robust recovery of viable human immune and epithelial cells from frozen gastrointestinal tissue

Affiliations

High-dimensional immune phenotyping and transcriptional analyses reveal robust recovery of viable human immune and epithelial cells from frozen gastrointestinal tissue

Liza Konnikova et al. Mucosal Immunol. 2018 Nov.

Abstract

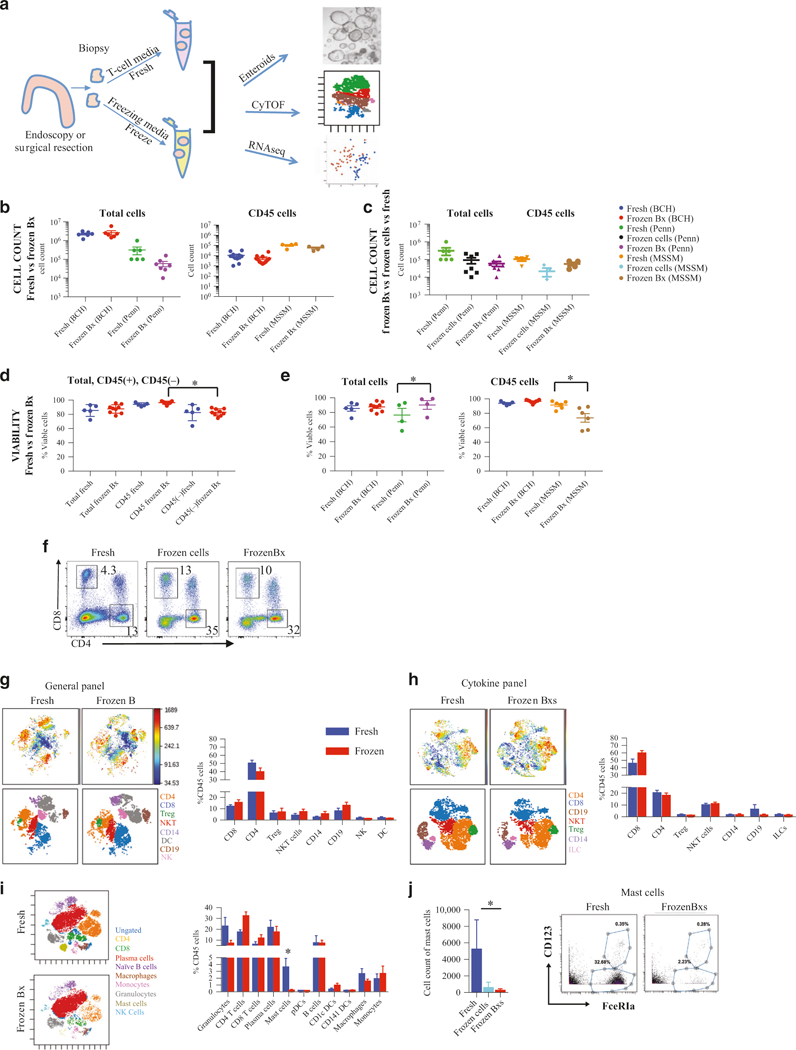
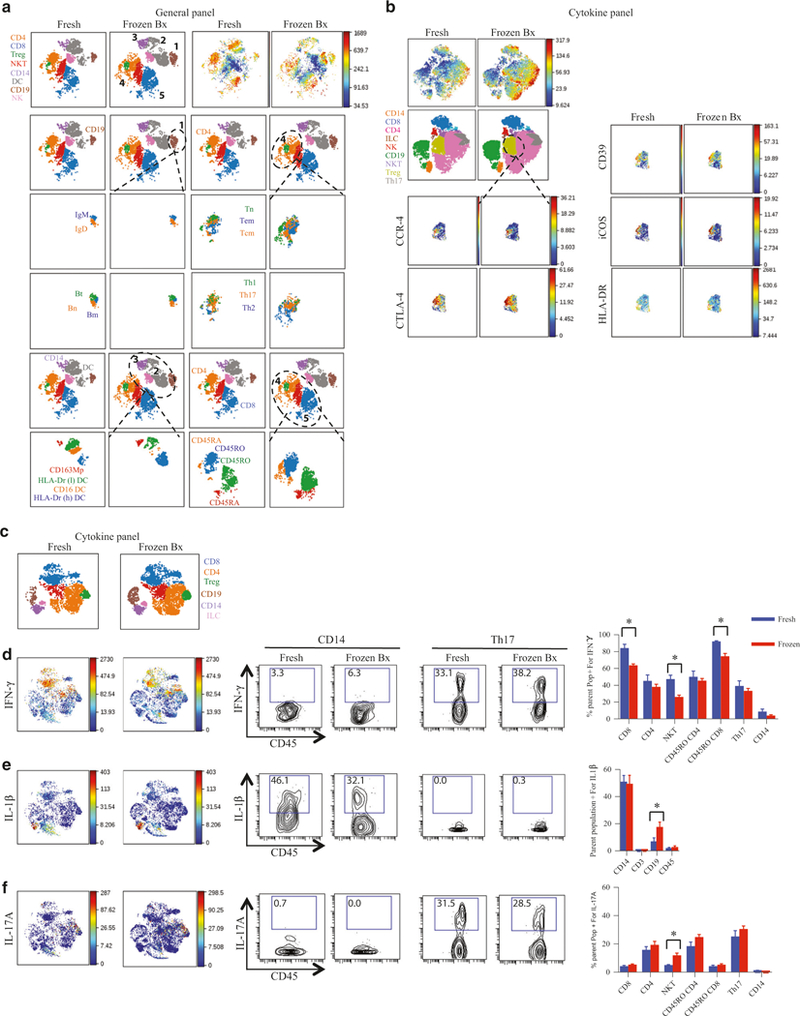
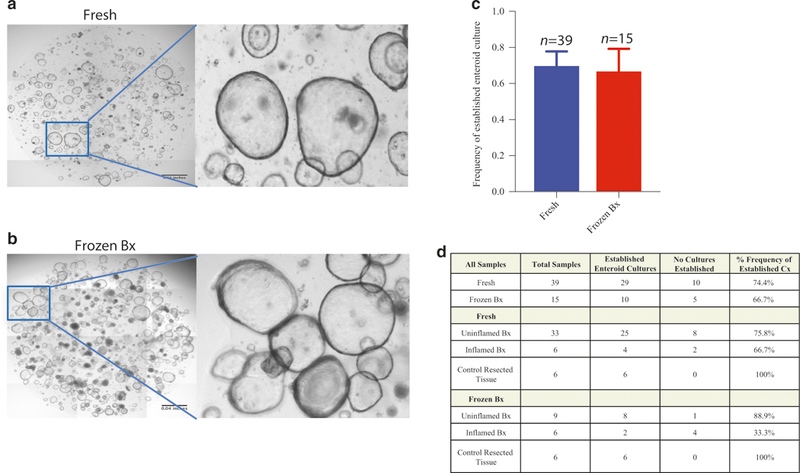
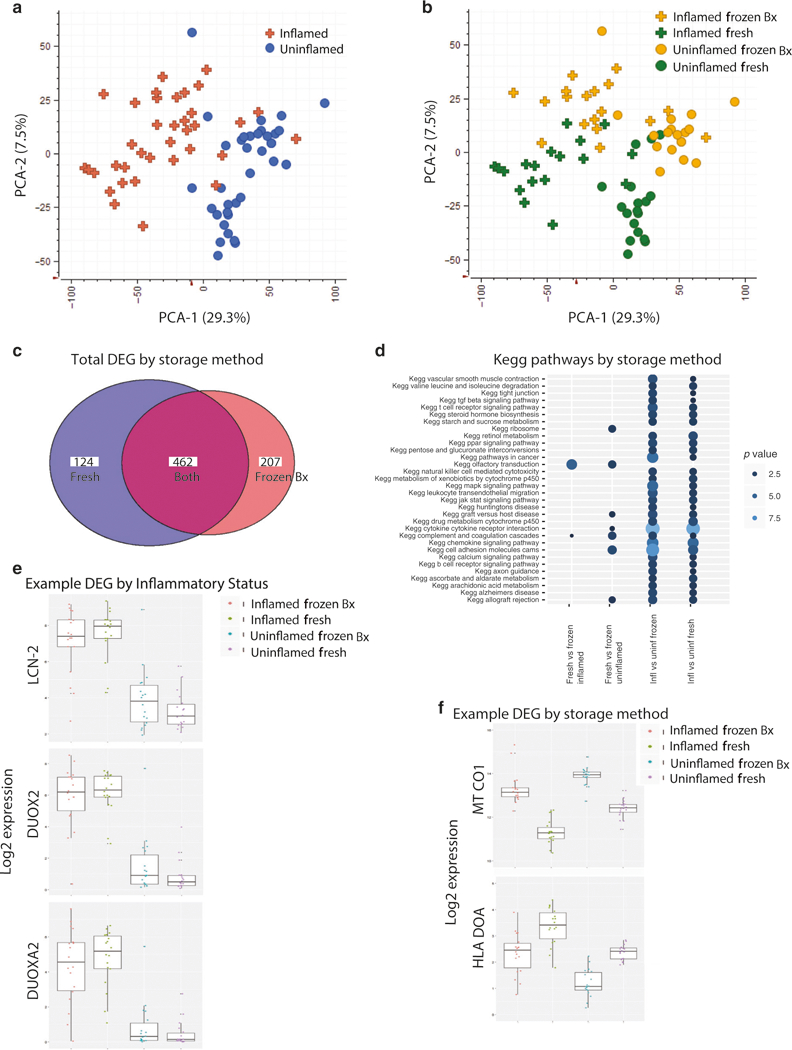
Simultaneous analyses of peripheral and mucosal immune compartments can yield insight into the pathogenesis of mucosal-associated diseases. Although methods to preserve peripheral immune cells are well established, studies involving mucosal immune cells have been hampered by lack of simple storage techniques. We provide a cryopreservation protocol allowing for storage of gastrointestinal (GI) tissue with preservation of viability and functionality of both immune and epithelial cells. These methods will facilitate translational studies allowing for batch analysis of mucosal tissue to investigate disease pathogenesis, biomarker discovery and treatment responsiveness.


Conflict of interest statement

Competing interests: Conflicts of Interest: S.B.S. is supported by grants or in-kind contributions from Pfizer, Janssen, Merck, and Regeneron. He is on the scientific advisory boards of Pfizer, Janssen, IFM Therapeutics, Lycera, Inc., Celgene, Pandion Therapeutics, and Applied Molecular Transport. He has consulted for Amgen and Hoffman La-Roche. Except for support from Pfizer that performed the RNA seq experiments in this work and assisted in the analytics, there are no conflicts of interest that are related to this work.

Figures

Fig. 1
Fig. 1
Gastrointestinal tissue can be cryopreserved with retention of cell viability. (a) Schematic obtaining intestinal biopsies by comparing immunophenotyping, establishment of enteroid cultures and transcriptional analysis of fresh or cryopreserved tissue. Intestinal tissue was prepared per the protocol outlined in (a) and single-cell suspensions obtained from either fresh biopsies or tissue frozen as biopsies and then processed were evaluated via CyTOF by staining with the “general” CyTOF panel and Rh for viability. Total and CD45+ cell count (b) from Boston Children’s Hospital (BCH), Mount Sinai School of Medicine (MSSM), and University of Pennsylvania School of Medicine (Penn). Cell count for fresh isolated cells (“fresh”), cells isolated fresh and then frozen (“frozen cells”), and frozen as biopsies and then processed (“frozen Bx”) were compared at MSSM and Penn sites (c). Total cell viability is shown and compared to immune cell viability (CD45+) and non-immune cell viability (CD45) for fresh versus frozen tissue evaluated at BCH (d) as well as total and CD45+ cell viability at MSSM and Penn (e). FACS analysis (f) of CD8+ and CD4+ T-cells comparing cells obtained “fresh” (cells isolated from fresh tissue), “frozen cells” (cells isolated fresh and then frozen), and “frozen Bx” (cells isolated from previously frozen biopsies). CD45+ viSNE plots from CyTOF analysis, using either the “general” panel (g) or the “cytokine” panel (h) of “fresh” or “frozen Bx.” The top two panels are ungated viSNE analysis for “fresh” (left) and “frozen Bx” (right) samples with a heat map of CD45. The bottom two panels are gated for the various marked immune cells populations. The percent of the various populations are quantified in the graph to the right. (i) CD45+ viSNE analysis of CyTOF using the “MSSM” panel comparing “fresh” (top) to “frozen Bx” (bottom) tissue and quantified to the right. Two-dimensional plots from “MSSM” panel CyTOF analysis of mast cells (j) are shown. Quantifications are to the left
Fig. 2
Fig. 2
Preservation of subpopulations of immune cells and their cytokine production. Single-cell suspensions obtained from either “fresh,” or “frozen Bx” were stained for CyTOF analysis with either “general panel” (a) or “cytokine panel” (b). All images are representative. CD45 is the marker for the ungated viSNE. a Various major immune populations are numbered 1–5 and then a more detailed analysis of these populations is shown below. The major populations being compared are outlined by the dotted lines. B-cells: CD19+. T-cells CD3+. Bn: CD19+CD27. Bm: CD19+CD27. Bt: CD19+CD38+CD24+. Tn: CD4+CCR7+CD45RA+. Tem: CD4+CCR7CD45RA. Tcm: CD4+CCR7+CD45RA. NK cells: CD3CD56+. Macrophages: CD14+. DC: CD14CD11c+. b Comparison of the markers expressed on the Treg populations between “fresh” and “frozen Bx” LPMCs. “Cytokine panel” was used for (c–f). c CD45+ viSNE color-coded for various immune populations. d–f Localization of the cells producing the indicated cytokines on the viSNE map on the left-hand side followed by the 2D FACS-like plots of either CD14+ (viable/CD45+/CD3/CD19/CD14+) or Th17 cells (viable/CD45+/CD3/CD4/CCR6+/CXCR-3) expressing the cytokines indicated (in the middle panels; number represent percentages of cells in gate) and then the quantification of the production of the cytokines indicated by various cell types (panel on the right). *p value <0.05
Fig. 3
Fig. 3
Successful intestinal enteroid generation from cryopreserved tissue. Organoids were either generated from fresh GI tissue obtained from IBD subjects, “fresh” (a) or from “Bx” (b). a, b Representative enteroid cultures. c Quantification of success rate of establishment of enteroid cultures. d Quantification of success rate of establishment of enteroid cultures segregated by patient conditions
Fig. 4
Fig. 4
Maintenance of unique gene expression patterns between inflamed and uninflamed tissue with cryopreservation. Matched inflamed and uninflamed tissue from UC subjects were stored in RNAlater (“fresh”) or in DMSO (“frozen Bx”) and then analyzed together by total RNAseq. PCA plots of the DEG showing segregation by inflammatory status (a) and method of storage (b) are shown. (c) Total number of DEG by the two methods. (d) Top affected pathways by the preservation method or by inflammatory status. (e) Representative genes that are differentially expressed depending on the inflammation status of the tissue. (f) Representative genes that are differentially affected by freezing method

References

    1. Neurath MF Current and emerging therapeutic targets for IBD. Nat. Rev. Gastroenterol. Hepatol. 14, 269–78 (2017). - PubMed
    1. Starr AE et al. Proteomic analysis of ascending colon biopsies from a paediatric inflammatory bowel disease inception cohort identifies protein biomarkers that differentiate Crohn’s disease from UC. Gut 66, 1573–83 (2017). - PMC - PubMed
    1. Barnes EL, Liew CC, Chao S & Burakoff R Use of blood based biomarkers in the evaluation of Crohn’s disease and ulcerative colitis. World J. Gastrointest. Endosc. 7, 1233–37 (2015). - PMC - PubMed
    1. Burakoff R et al. Blood-based biomarkers used to predict disease activity in Crohn’s disease and ulcerative colitis. Inflamm. Bowel Dis. 21, 1132–40 (2015). - PubMed
    1. Bendall SC, Nolan GP, Roederer M & Chattopadhyay PK A deep profiler’s guide to cytometry. Trends Immunol. 33, 323–32 (2012). - PMC - PubMed

Publication types