. 2018 Sep;19(9):942-953.
doi: 10.1038/s41590-018-0179-y. Epub 2018 Aug 13.

PLD3 and PLD4 are single-stranded acid exonucleases that regulate endosomal nucleic-acid sensing

Affiliations

PLD3 and PLD4 are single-stranded acid exonucleases that regulate endosomal nucleic-acid sensing

Amanda L Gavin et al. Nat Immunol. 2018 Sep.

Abstract

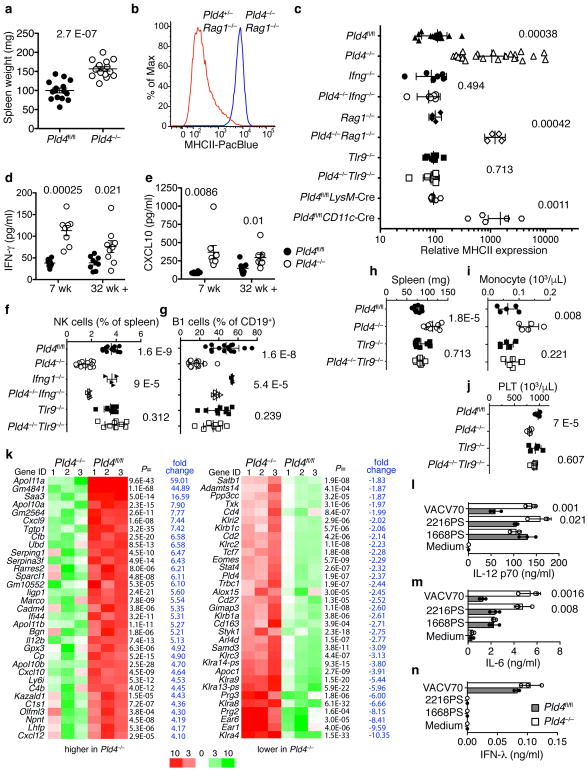
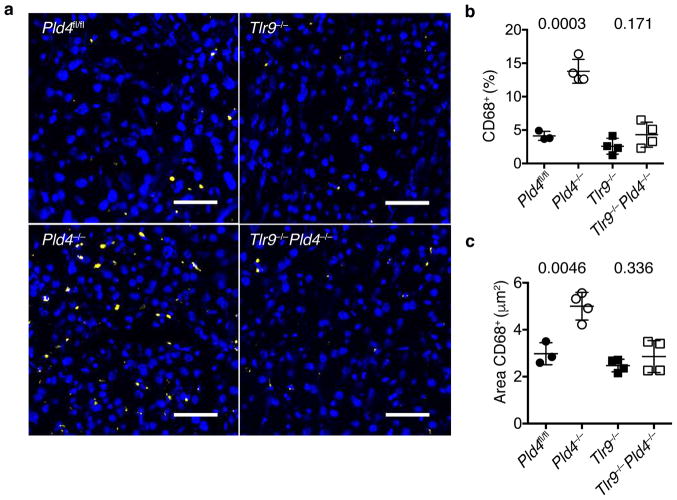
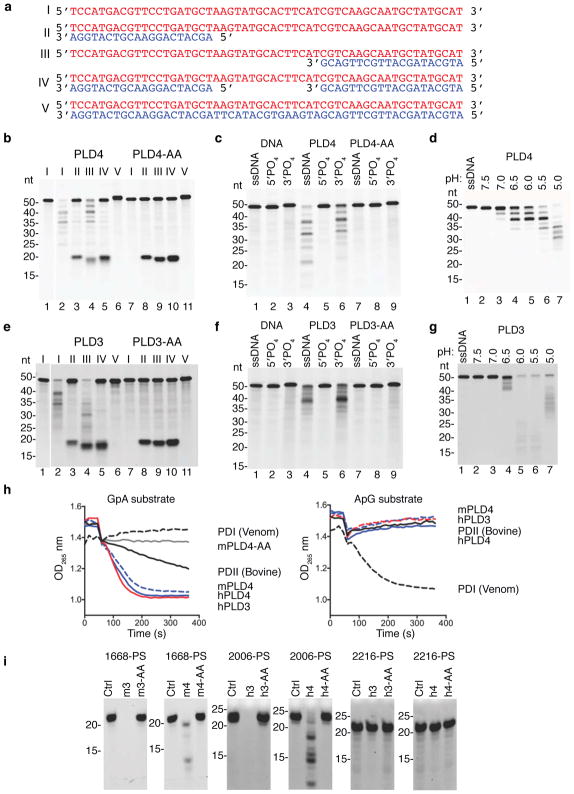
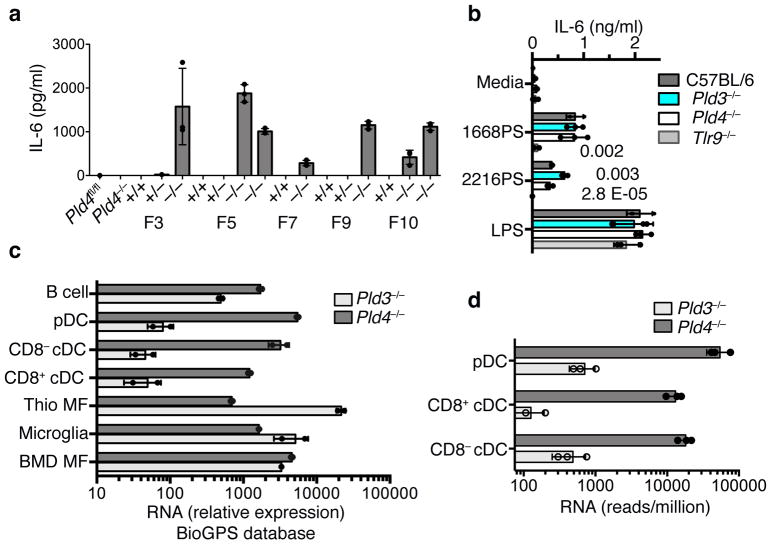
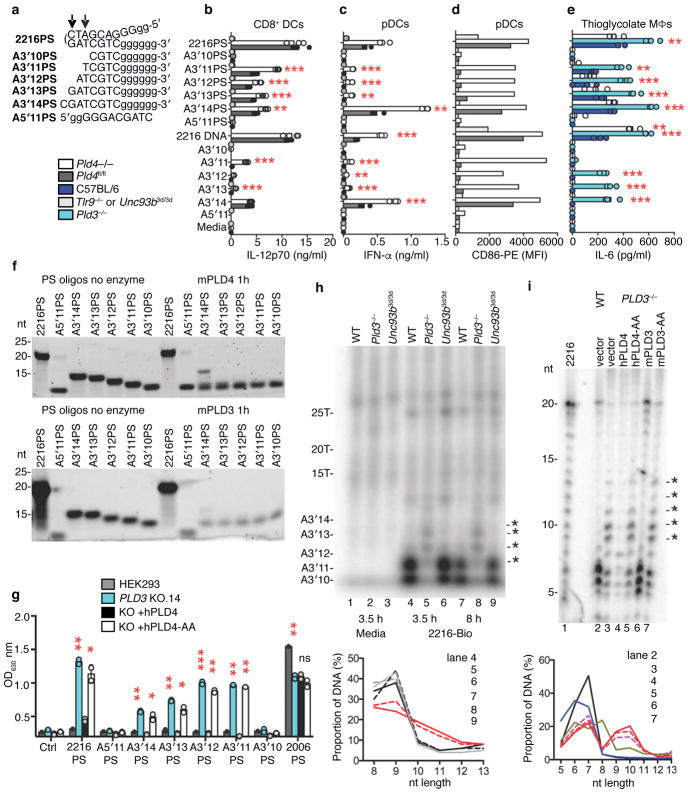
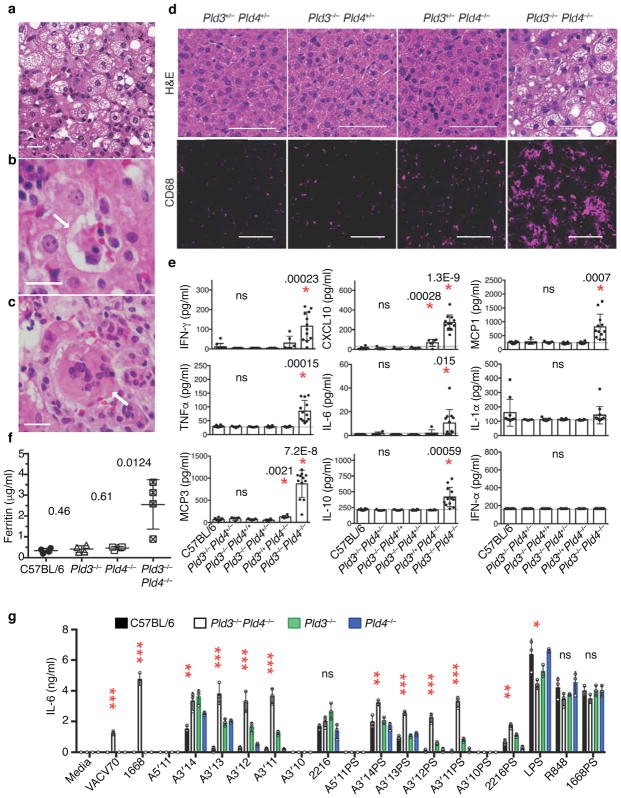
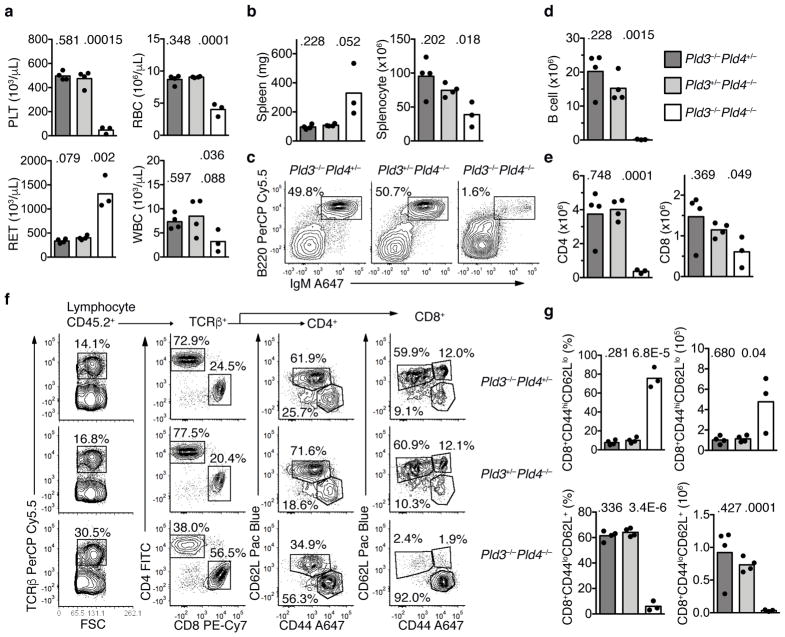
The sensing of microbial genetic material by leukocytes often elicits beneficial pro-inflammatory cytokines, but dysregulated responses can cause severe pathogenesis. Genome-wide association studies have linked the gene encoding phospholipase D3 (PLD3) to Alzheimer's disease and have linked PLD4 to rheumatoid arthritis and systemic sclerosis. PLD3 and PLD4 are endolysosomal proteins whose functions are obscure. Here, PLD4-deficient mice were found to have an inflammatory disease, marked by elevated levels of interferon-γ (IFN-γ) and splenomegaly. These phenotypes were traced to altered responsiveness of PLD4-deficient dendritic cells to ligands of the single-stranded DNA sensor TLR9. Macrophages from PLD3-deficient mice also had exaggerated TLR9 responses. Although PLD4 and PLD3 were presumed to be phospholipases, we found that they are 5' exonucleases, probably identical to spleen phosphodiesterase, that break down TLR9 ligands. Mice deficient in both PLD3 and PLD4 developed lethal liver inflammation in early life, which indicates that both enzymes are needed to regulate inflammatory cytokine responses via the degradation of nucleic acids.


Conflict of interest statement

Declaration of interests

The authors have no competing interests

Figures

Figure 1
Figure 1
Splenomegaly, IFN-γ-driven MHCII upregulation in peritoneal macrophages, and other TLR9-dependent anomalies in Pld4−/− mice. (a) Spleen weights of Pld4fl/fl compared to age-matched Pld4−/− mice (n=15,15). (b) MHCII expression on F4/80+-gated resident peritoneal macrophages from Pld4+/−Rag1−/− compared to Pld4−/−Rag1−/− mouse. Summary data (n=4,4) shown in (c). (c) Cell type-, IFN-γ-, and TLR9-dependence of PLD4 deficiency on MHCII upregulation in peritoneal macrophages (n=13,15,6,6,4,4,9,9,8,5 independent mice in groups listed from top to bottom). Plasma cytokine concentrations of (d) IFN-γ and (e) CXCL10 (7-wk-old mice, n=8/group; 32+wk-old mice, n=9/group). (f–j) Effects of compound deficiency of Pld4 and Tlr9 or Pld4 and Ifng on (f) splenic NK cell frequency, (g) peritoneal B1 cell frequency, (h) spleen weight, (i) monocyte counts, (j) blood platelets. n=12,12,4,4,9,9 represent values obtained from independent mice in groups listed from top to bottom in f and g; n=9 for each group in h; n=5 for each group in i and j. In (a,d–g) error bars show mean and SEM, c shows geometric standard deviation and h–j show linear standard deviation with each data point representing the value obtained from an independent mouse and P values calculated using unpaired 2-tailed T-test. (k) mRNA sequencing analysis comparing splenocytes of Pld4+/+Rag1−/− versus Pld4−/−Rag1−/− mice. Expression of all genes shown was significantly different in the two groups (false discovery rate ≤ 0.05 calculated using edgeR, n=3/group). (l–n) Cytokine responses of sorted splenic CD8+ DCs to the indicated TLR9 ligands. (l) IL-12p70, (m) IL-6, (n) IFN-λ (mean is shown for l–n, triplicate cultures, repeated in at least two independent experiments, unpaired 2-tailed T test).
Figure 2
Figure 2
Effect of Pld4 and Tlr9 deficiency on liver infiltration by CD68+ macrophages. (a) Frozen sections of liver from mice of the indicated genotypes were stained with Hoechst dye (blue) and antibody for CD68 (yellow). Scale bar indicates 50 μm. Analysis of (b) the percentages of liver cells staining with CD68 antibody relative to Hoechst 33258+ cells and (c) the area occupied by CD68+ cells in mice of the indicated genotypes. Each point in (b,c) represents the value measured in an independent mouse (mean and SD shown, n=3,4,4,4; P value calculated by unpaired 2-tailed T test).
Figure 3
Figure 3
Analysis of the nuclease activity of PLD4 and PLD3. (a) Roman numerals indicate each nucleic acid substrate tested. (b,c) Soluble recombinant mouse PLD4 or PLD4-AA (100 nM) was incubated with substrate (2.5 μM) in reaction buffer (50 mM MES pH 5.5, 100 mM NaCl) for 2 hours at 37°C, then analyzed by denaturing Tris-Borate-EDTA polyacrylamide gel electrophoresis. In b all oligonucleotides lacked 5′ or 3′ phosphate. (c) Substrate I that lacked phosphate (ssDNA) or carried phosphorylation on the 5′ or 3′ ends was left untreated (DNA) or was incubated with PLD4 or PLD4-AA. (d) Reactions using substrate I in buffers adjusted to the indicated pH. (e-g) Reactions were identical to b–d except that PLD3 or PLD3-AA proteins (10 nM) were used as indicated. In (b,e) photo is cropped between lanes 1 and 2 to eliminate additional undigested control lanes. (h) Assay of the release of adenosine by digestion of the indicated dinucleotides (left panel, GpA; right panel, ApG) was carried out as described using the indicated enzymes. PDI, snake venom phosphodiesterase; PDII (Bovine), calf spleen phosphodiesterase II (spleen exonuclease). (i) Digestion of the indicated PS-linked substrate ODNs (Table 1, 2.5 μM) with recombinant proteins (500 nM) in reaction buffer adjusted to pH 5.0 for PLD4 and pH 5.5 for PLD3, incubated at 37°C for 6 hours. Mouse and human PLD3 and PLD4 are abbreviated as m3, h3, m4, h4, respectively. nt, length in nucleotides. All experiments were repeated at least twice.
Figure 4
Figure 4
Exaggerated responses of Pld3−/− thioglycolate-elicited macrophages to an A-type TLR9 agonist and analysis of relative RNA expression of Pld3 and Pld4 in selected cell types. (a) Elevated IL-6 responses of thioglycolate-elicited macrophages from independent Pld3−/− founder lines to in vitro incubation with ODN 2216PS. Founder lines 3, 5, 7, 9, and 10 were outcrossed to C57BL/6 then intercrossed to yield heterozygosity or homozygosity of the Pld3 mutations indicated in Fig. S1j, or homozygosity of the wild-type Pld3 allele. Results shown are from triplicate cultures performed once, showing mean and SD. (b) TLR9-dependence and elevated responses of Pld3−/− thioglycolate-elicited macrophages. PLD3-deficient macrophages of founder line 7 were challenged with the indicated stimuli and the IL-6 response compared to Pld4−/−, Tlr9−/−, or wild-type cells as indicated. Bars show mean and points show values obtained in 3 separate cultures. P values calculated by two-tailed T test. These experiments were repeated at least twice. (c,d) Analysis of Pld3 and Pld4 expression. Points show independent RNA samples and bars show geometric mean. (c) RNA expression data from the BioGPS MOE430 Gene Atlas Data set of the indicated mouse cell types: including dendritic cells (CD8α+ DCs, CD8α DCs, and pDCs), B cells, bone marrow-derived macrophages (BMD MF), and thioglycolate-elicited macrophages (Thio MF). n=2,2 independent RNA samples. (d) RNA sequencing analysis of Pld3 and Pld4 expression in DC subsets. n=3,3; each data point was from sorted cells of independent pools of splenocytes from 10–14 mice.
Figure 5
Figure 5
Stimulatory ability and stability of 2216 and its fragments in the presence or absence of PLD3 or PLD4. (a) Synthetic substrates tested; PS-linked nucleotides (lower case). Arrows indicate the ability of DNase II to cut within the palindrome of 2216. (b–e) Cytokine responses of the indicated cell types to ODNs, 1 μM. Cells derived from (b–d) FLT3L DC cultures or (e) thioglycolate-elicited macrophages. (b) IL-12p70 responses of CD8+ DCs. (c) IFN-α responses of FLT3L DCs. (d) CD86 upregulation in CCR9+/B220+-gated (pDC) cells analyzed in c. Here, cells from replicate cultures were pooled for flow cytometry analysis, yielding a single sample per condition. (e) IL-6 responses of thioglycolate-elicited macrophages. In (b,c,e) bars show mean and points show values obtained in 3 separate cultures. (f) In vitro digestion by PLD4 (100 nM, upper panel) or PLD3 (10 nM, lower panel) of the substrates listed in a. These experiments were carried out twice with similar results. (g) 293HEK-BluehTLR9 clones deficient for PLD3 were assessed for TLR9 responses to the indicated ODNs. PLD3-deficient clone #14 was reconstituted with PLD4 or PLD4-AA expression constructs and challenged with the indicated ODNs (1 μM). NF-κB reporter activation was then measured. Plots show mean of duplicate cultures. P values calculated by 2-tailed T test. In b,c,e,g *, **, *** denote P< 0.05, .01, .001, respectively. This experiment was repeated at least twice with similar results. (h) Analysis of in vivo stability of 3′-biotin-tagged-2216 in thioglycolate-elicited macrophages. After the indicated duration of incubation, ODNs were isolated and visualized on a TBE-Urea acrylamide gel. Asterisks indicate ODN species increased in abundance in Pld3−/− lysates. Macrophages were from C57BL/6 (WT), PLD3-deficient or Unc93b13d/3d mice. (i) Similar analysis of 2216-biotin recovered after 6 h with PLD3−/− #10 HEK293-BluehTLR9 cells or cells that had been reconstituted with PLD3, PLD4, or nuclease dead variants PLD3-AA or PLD4-AA. 2216-biotin was radiolabeled as a size marker (2216-bio). Electrophoresis performed in 50 mM histidine buffer for higher resolution of small fragments. Panels below h,i quantitate relative intensity of bands in the 5–13 nt range of the indicated lanes above. Experiments in (h) were carried out twice and in (i) once.
Figure 6
Figure 6
Liver inflammation and elevated inflammatory cytokine production in Pld3−/−Pld4−/− mice. (a–c) Hematoxylin/eosin (H&E) staining of paraffin-embedded sections from Pld3−/−Pld4−/− livers; scale bars are 50 μm. Pathogenic features of disease include (a) vesicular hepatopathy (steatosis), (b) hemophagocytosis (arrow), and (c) hepatic multinucleate cells (arrow). (d) H&E analysis of liver sections of littermates with the indicated genotypes (upper panels, scale bar 50 μm) or CD68 immunofluorescent staining of frozen liver sections derived from different lobes of the same liver (lower, scale bar 100 μm). These data are representative of at least 3 mice/group. (e) Serum cytokines measured in 16–19 day-old mice of the indicated genotypes. n=10, 5, 7, 6, 6, 12 for C57BL/6, Pld3+/−Pld4+/−, Pld3−/−Pld4+/+, Pld3−/−Pld4+/−, Pld3+/+Pld4−/−, Pld3−/−Pld4−/−, respectively. P values calculated by two-tailed T test; asterisks indicate significant differences. Dotted lines in (e) indicate assay background. (f) Serum ferritin concentrations from indicated genotypes n= four/group. (g) IL-6 secretion by bone marrow-derived macrophages isolated from 19 day-old C57BL/6, Pld3−/−, Pld4−/− or Pld3−/−Pld4−/− mice after stimulation with indicated TLR agonists. Asterisks refer to significant differences between C57BL/6 and Pld3−/−Pld4−/−. *, **, *** denote P< 0.05, .01, .001, respectively. Significance of IL-6 responses assessed by unpaired two-tailed T-test. All plots show mean and SD of triplicate cultures; this experiment was repeated a second time with similar results.
Figure 7
Figure 7
Transfer of an inflammatory disease by transplantation of Pld3−/−Pld4−/− bone marrow. (a) Eight weeks post transfer, whole blood was analyzed for platelet (PLT), red blood cell (RBC), reticulocyte (RET) and white blood cell (WBC) counts from B6.SJL-CD45.1 recipient mice receiving bone marrow of the indicated genotypes: Pld3−/−Pld4+/− (dark grey bar), Pld3+/−Pld4−/− (light grey bar), Pld3−/−Pld4−/− (white bar). Bar indicates mean and symbols indicate individual recipient values. (b) Spleen weight (mg) and splenocyte count after erythrocyte lysis was determined 8 weeks post transfer. (c) Representative flow cytometry plots indicating recipient splenic CD45.2+-gated B cell populations stained with B220 and IgM from the indicated bone marrow donors. Summary data shown in d. (d) Numbers of donor (CD45.2+) B220+IgM+ B cells identified in spleens as gated in (c). (e) Numbers of CD45.2+TCRβ+CD4+ (left) or CD8+ (right) T cells from the spleens of recipient mice transferred with donor bone marrow of the indicated genotypes. (f) Representative flow cytometry plots of splenic CD45.2+ cells from mice receiving bone marrow of the indicated genotypes. Panels show gating and proportions of TCRβ+, CD4 and CD8 T cells. Cells gated on either CD4 or CD8 cells were further analyzed by CD62L and CD44 staining. Summary data shown in g. (g) Frequencies and numbers of CD8 T cells staining CD44hiCD62Llo (upper panel) or CD44loCD62L+ (lower panel) in the spleens of recipients receiving bone marrow of the indicated genotypes. n=4, 4, 3 for Pld3−/−Pld4+/−, Pld3+/−Pld4−/−, and Pld3−/−Pld4−/−, respectively. Two-tailed T test was used to calculate P values. This experiment was performed once.

References

    1. Schlee M, Hartmann G. Discriminating self from non-self in nucleic acid sensing. Nat Rev Immunol. 2016;16:566–580. - PMC - PubMed
    1. Barbalat R, Ewald SE, Mouchess ML, Barton GM. Nucleic acid recognition by the innate immune system. Annu Rev Immunol. 2011;29:185–214. - PubMed
    1. Rigby RE, Leitch A, Jackson AP. Nucleic acid-mediated inflammatory diseases. Bioessays. 2008;30:833–842. - PubMed
    1. Al-Mayouf SM, et al. Loss-of-function variant in DNASE1L3 causes a familial form of systemic lupus erythematosus. Nat Genet. 2011;43:1186–1188. - PubMed
    1. Napirei M, et al. Features of systemic lupus erythematosus in Dnase1-deficient mice. Nat Genet. 2000;25:177–181. - PubMed

Publication types

MeSH terms