

Ten-year trends in intensive care admissions for respiratory infections in the elderly
- PMID: 30112650
- PMCID: PMC6093821
- DOI: 10.1186/s13613-018-0430-6
Ten-year trends in intensive care admissions for respiratory infections in the elderly
Abstract
Background: The consequences of the ageing population concerning ICU hospitalisation need to be adequately described. We believe that this discussion should be disease specific. A focus on respiratory infections is of particular interest, because it is strongly associated with old age. Our objective was to assess trends in demographics over a decade among elderly patients admitted to the ICU for acute respiratory infections.
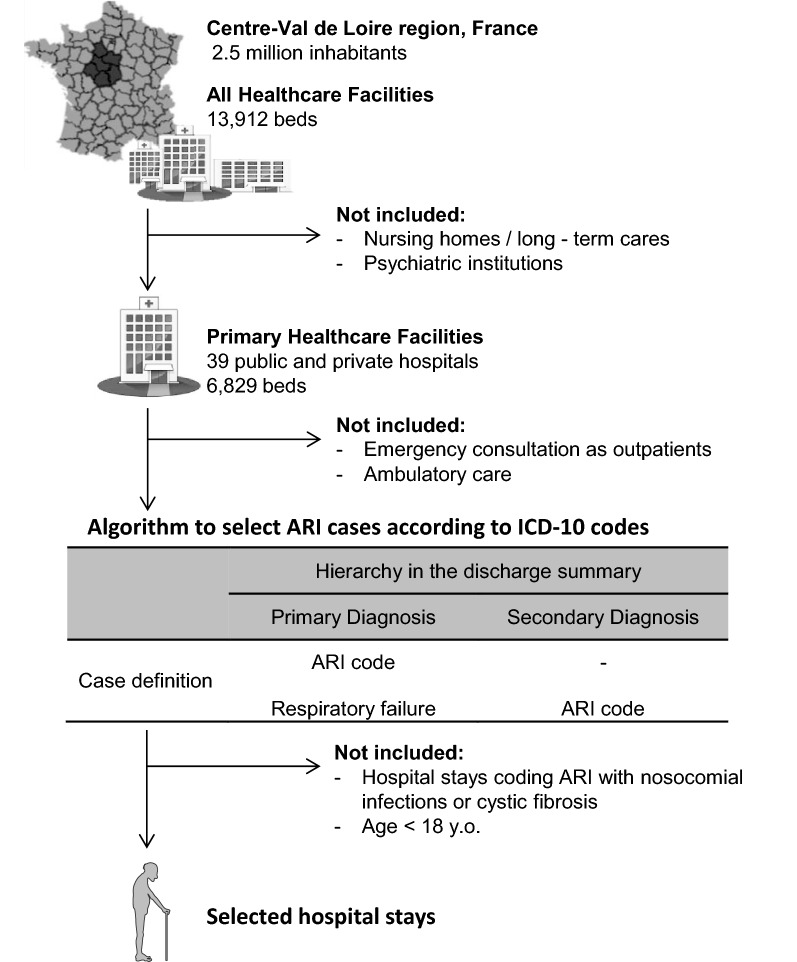
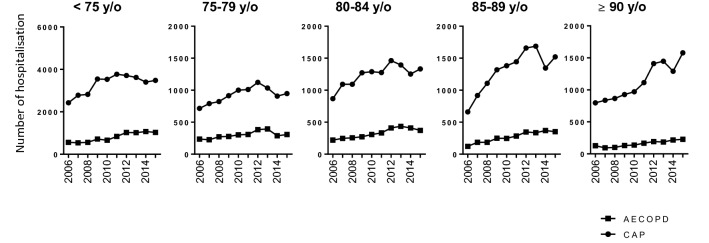
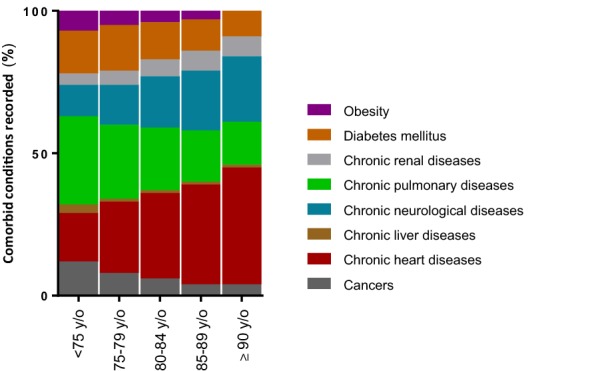
Methods: A cross-sectional study was performed between 2006 and 2015 based on hospital discharge databases in one French region (2.5 million inhabitants). Patients with acute respiratory infection were selected according to the specific ICD-10 diagnosis codes recorded, including acute exacerbation of chronic obstructive pulmonary disease (AECOPD) and community-acquired pneumonia (CAP). We also identified comorbid conditions based on any significant ICD-10 secondary diagnoses adapted from the Charlson and Elixhauser indexes.
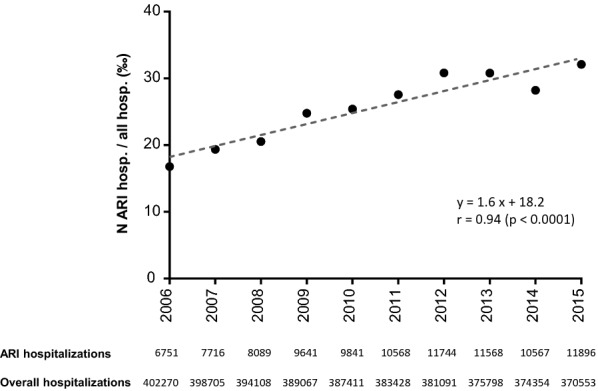
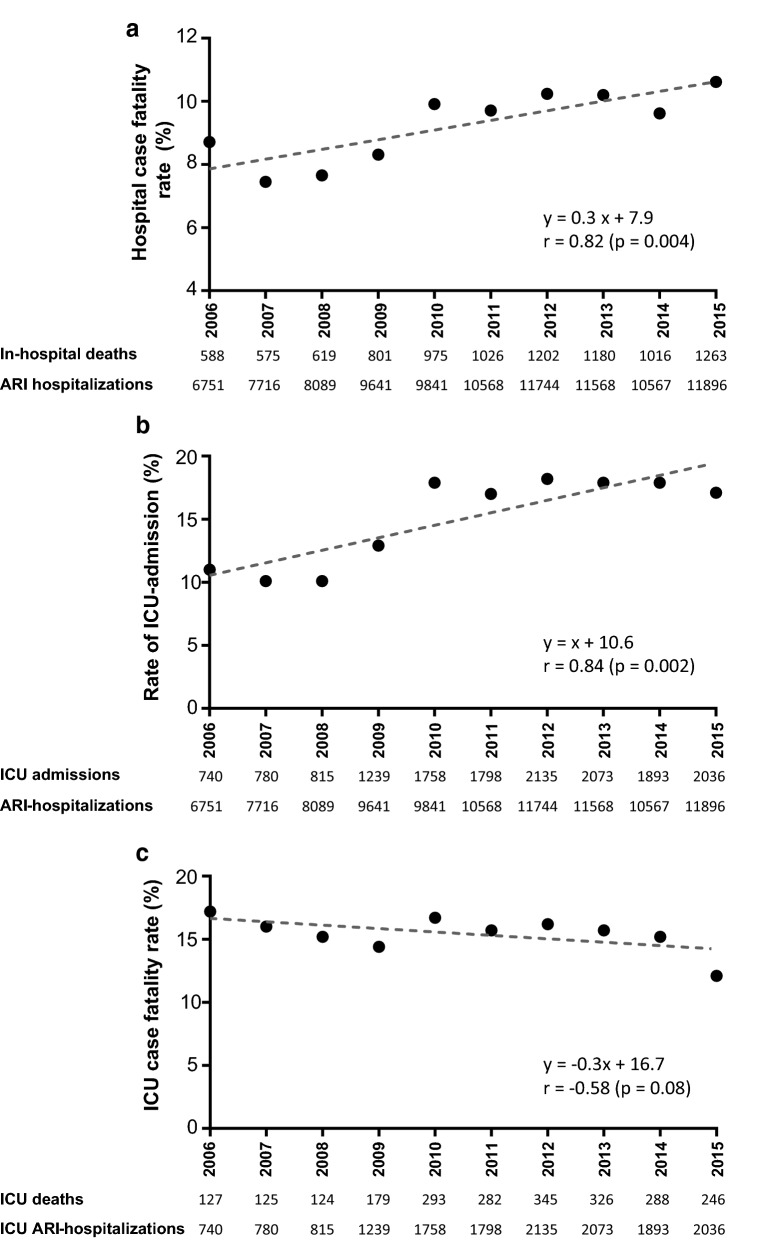
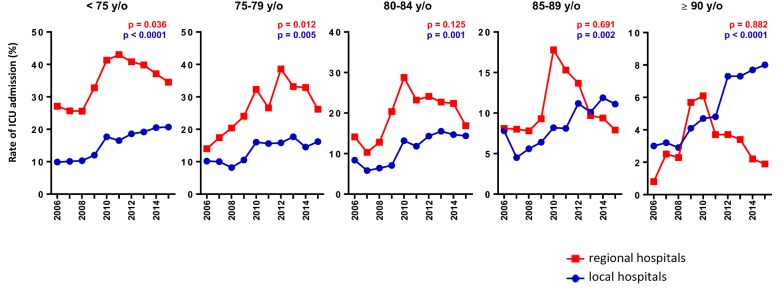
Results: A total of 98,381 hospital stays for acute respiratory infection were identified among the 3,856,785 stays over the 10-year period. The number of patients 75 y/o and younger increased 1.6-fold from 2006 to 2015, whereas the numbers of patients aged 85-89 and ≥ 90 y/o increased by 2.5- and 2.1-fold, respectively. Both CAP and AECOPD hospitalisations significantly increased for all age groups over the decade. ICU hospitalisations for respiratory infection increased 2.7-fold from 2006 to 2015 (p = 0.0002). The greatest increases in the use of ICU resources were for the 85-89 and ≥ 90 y/o groups, which corresponded to increases of 3.3- and 5.8-fold. Indeed, the proportion of patients hospitalized for respiratory infection in ICU that were elderly clearly grew during the decade: 11.3% were ≥ 85 y/o in 2006 versus 16.4% in 2015 (p < 0.0001). This increase in ICU hospitalisation rate of ageing patients was not associated with significant changes in the level of care or ICU mortality except for patients ≥ 90 y/o (for whom ICU mortality dropped from 40.9 to 22.3%, p = 0.03).
Conclusion: We observed a substantial increase in acute respiratory infection diagnoses associated with hospitalisation between 2006 and 2015, with a growing demand for critical care services. Both the absolute number and the percentage of elderly patient ICU admissions increased over the last decade, with the greatest increases being observed for patients 85 years and older.
Keywords: Elderly; Epidemiology; Intensive care unit; Respiratory infection.
Figures
References
-
- United Nations Population Division|Department of Economic and Social Affairs. http://www.un.org/en/development/desa/population/publications/ (2017). Accessed 23 Mar 2018.
-
- World Population Ageing 2013. http://www.un.org/en/development/desa/population/publications/pdf/ageing... (2017). Accessed 23 Mar 2018.
LinkOut - more resources
Full Text Sources
Other Literature Sources
Molecular Biology Databases
Miscellaneous
