. 2018 Sep 12;15(6):066011.
doi: 10.1088/1478-3975/aadad2.

A unified computational framework for modeling genome-wide nucleosome landscape

Affiliations

A unified computational framework for modeling genome-wide nucleosome landscape

Hu Jin et al. Phys Biol. .

Abstract

Nucleosomes form the fundamental building blocks of eukaryotic chromatin, and previous attempts to understand the principles governing their genome-wide distribution have spurred much interest and debate in biology. In particular, the precise role of DNA sequence in shaping local chromatin structure has been controversial. This paper rigorously quantifies the contribution of hitherto-debated sequence features-including G+C content, 10.5 bp periodicity, and poly(dA:dT) tracts-to three distinct aspects of genome-wide nucleosome landscape: occupancy, translational positioning and rotational positioning. Our computational framework simultaneously learns nucleosome number and nucleosome-positioning energy from genome-wide nucleosome maps. In contrast to other previous studies, our model can predict both in vitro and in vivo nucleosome maps in Saccharomyces cerevisiae. We find that although G+C content is the primary determinant of MNase-derived nucleosome occupancy, MNase digestion biases may substantially influence this GC dependence. By contrast, poly(dA:dT) tracts are seen to deter nucleosome formation, regardless of the experimental method used. We further show that the 10.5 bp nucleotide periodicity facilitates rotational but not translational positioning. Applying our method to in vivo nucleosome maps demonstrates that, for a subset of genes, the regularly-spaced nucleosome arrays observed around transcription start sites can be partially recapitulated by DNA sequence alone. Finally, in vivo nucleosome occupancy derived from MNase-seq experiments around transcription termination sites can be mostly explained by the genomic sequence. Implications of these results and potential extensions of the proposed computational framework are discussed.
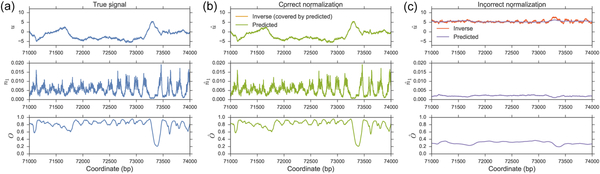

Figures

Figure 1:
Figure 1:
Incorrect estimation of nucleosome number may distort the inference of nucleosome-positioning energy. (a) True energy (top panel), n1 (middle panel), and occupancy O (bottom panel) in the simulation. (b) Using the true n1 and O from (a), nucleosome-positioning energy is calculated by solving the inverse problem (orange curve in top panel, hidden by the overlapping green curve). By fitting this calculated energy to a linear sequence model that depends only on GC, the positioning energy can be predicted based on sequence (green curve in top panel). n^1 (middle panel) and Ô (bottom panel) are predictions from this fitted linear energy model. (c) Same as (b) except that the true n1 is scaled down, so that the nucleosome number is now only 500 (see main text).
Figure 2:
Figure 2:
An example of a genomic locus illustrating that CEM nucleosome occupancy predictions better correlate with the observed profiles compared to LM predictions. (a) Observed (black curve), LM predicted (red curve), and CEM predicted (green curve) nucleosome occupancy for Zhang-MNase-invitro-ACF. (b) Same as (a), but for Kaplan-MNase-invitro-salt. (c) Same as (a), but for Zhang-MNase-invitro-salt. Each curve was standardized by subtracting the mean and then dividing by the standard deviation within the shown region.
Figure 3:
Figure 3:
Contributions from GC, SR, and polyA in shaping nucleosome occupancy at TSS and TTS. (a) Nucleosome-positioning energy in Model GC+SR+polyA attributable to GC (yellow curve), SR (green curve), and polyA (red curve) aligned and averaged at TSS of all genes. The total energy is shown in blue. Each energy component is subtracted by its genome-wide mean shown in the legends to facilitate visualization. (b) Same as (a), but aligned at TTS. (c) Observed (blue curve) and predicted nucleosome occupancy from Models GC (yellow curve), GC+SR (green curve), and GC+SR+polyA (red curve), aligned and averaged at TSS and normalized by the genome-wide mean. Pearson correlation coefficients between observation and prediction are shown in the legends. (d) Same as (c), but aligned at TTS.
Figure 4:
Figure 4:
The dependence of MNase-derived nucleosome occupancy on G+C content is substantially biased by MNase digestion. (a) Distribution of pairwise Pearson correlation coefficients between chemical-cleavage-derived nucleosome occupancy, GC, and polyA, calculated on 1000-bp intervals tiling the “good regions.” (b) Distribution of pairwise partial correlation coefficients between chemical-cleavage-derived nucleosome occupancy, GC, and polyA, conditioning on the third variable, calculated on 1000-bp intervals tiling the “good regions.” (c) A heatmap of nucleosome occupancy as a function of GC and polyA. The S. cerevisiae genome was divided into 1000-bp segments, and each segment was then assigned to a 2-dimensional bin of given GC and poly(dA:dT) content. Color indicates the average nucleosome occupancy in each bin. (d-f) Same as (a-c), but for MNase-derived nucleosome occupancy. (g) Median of the Pearson correlation coefficients of GC and polyA with MNase-derived nucleosome occupancy at different digestion levels, calculated on 1000-bp intervals tiling the “good regions.” Linear extrapolation was performed to infer the correlation coefficient at digestion time 0. (h) Same as (g), but for partial correlation coefficients.
Figure 5:
Figure 5:
Spatially-resolved sequence motifs, including the 10.5-bp periodicity, facilitate the rotational but not translational positioning of nucleosomes. (a) Cumulative distribution of absolute dyad-to-dyad distance between predicted and observed nucleosome positions. Grey curve represents a random control using non-overlapping uniformly distributed nucleosomes. (b) Distribution of dyad-to-dyad distance between predicted and observed nucleosome positions. (c) Distribution of absolute dyad-to-dyad distance between predicted and observed nucleosome positions mod 10 bp. (d) Distribution of dyad-to-dyad distance between redundant nucleosomes.
Figure 6:
Figure 6:
In-vivo nucleosome occupancy around TSS is partially determined by DNA sequence. Shown are the results using the Model GC+SR+polyA trained on McKnight2016-MNase-invivo-WT-log-80 [44]. (a) Observed (blue) and predicted (yellow) nucleosome occupancy aligned at TSS and averaged over all genes. (b) Genes were ranked by the Pearson correlation coefficient between observed and predicted nucleosome occupancy within ±1 kb of TSS and divided into quintiles (different colors). The distribution of these correlation coefficients are shown. (c) Observed (solid curves) and predicted (dashed curves) nucleosome occupancy aligned at TSS and averaged over the genes within each quintile from (b). Average DNase I hypersensitivity [46] (gray curve and shade) is also shown for genes within each quintile. (d) Enrichment analysis for expression variability [47]. All genes are ranked between 0 and 1 according to a variability measure. The median rank of genes within each quintile is shown. A permutation test is performed to assess whether the genes within each quintile are significantly enriched for high or low variability.
Figure 7:
Figure 7:
In-vivo nucleosome occupancy around TTS is primarily determined by DNA sequence. Shown are the results using the Model GC+SR+polyA trained on McKnight2016-MNase-invivo-WT-log-80 [44]. (a) Observed (blue) and predicted (yellow) nucleosome occupancy aligned at TTS and averaged over all genes. (b) Genes are ranked by the distance from their TTS to the closest TSS and divided into quintiles (different colors). The distribution of these distances are shown. (c) Observed (solid curves) and predicted (dashed curves) nucleosome occupancy aligned at TTS and averaged over the genes within each quintile from (b).

References

    1. Buckwalter JM, Norouzi D, Harutyunyan A, Zhurkin VB, and Grigoryev SA, “Regulation of chromatin folding by conformational variations of nucleosome linker dna,” Nucleic Acids Research, vol. 45, no. 16, pp. 9372–9387, 2017. - PMC - PubMed
    1. Hughes AL and Rando OJ, “Mechanisms underlying nucleosome positioning in vivo,” Annual review of biophysics, vol. 43, pp. 41–63, 2014. - PubMed
    1. Kaplan N, Moore IK, Fondufe-Mittendorf Y, Gossett AJ, Tillo D, Field Y, LeProust EM, Hughes TR, Lieb JD, Widom J, et al., “The DNA-encoded nucleosome organization of a eukaryotic genome,” Nature, vol. 458, no. 7236, pp. 362–366, 2009. - PMC - PubMed
    1. Zhang Y, Moqtaderi Z, Rattner BP, Euskirchen G, Snyder M, Kadonaga JT, Liu XS, and Struhl K, “Intrinsic histone-DNA interactions are not the major determinant of nucleosome positions in vivo,” Nature structural & molecular biology, vol. 16, no. 8, pp. 847–852, 2009. - PMC - PubMed
    1. Gaffney DJ, McVicker G, Pai AA, Fondufe-Mittendorf YN, Lewellen N, Michelini K, Widom J, Gilad Y, and Pritchard JK, “Controls of nucleosome positioning in the human genome,” PLoS Genetics, vol. 8, no. 11, p. e1003036, 2012. - PMC - PubMed

Publication types

LinkOut - more resources