

Cell tension and mechanical regulation of cell volume
- PMID: 30113884
- PMCID: PMC6254581
- DOI: 10.1091/mbc.E18-04-0213
Cell tension and mechanical regulation of cell volume
Abstract
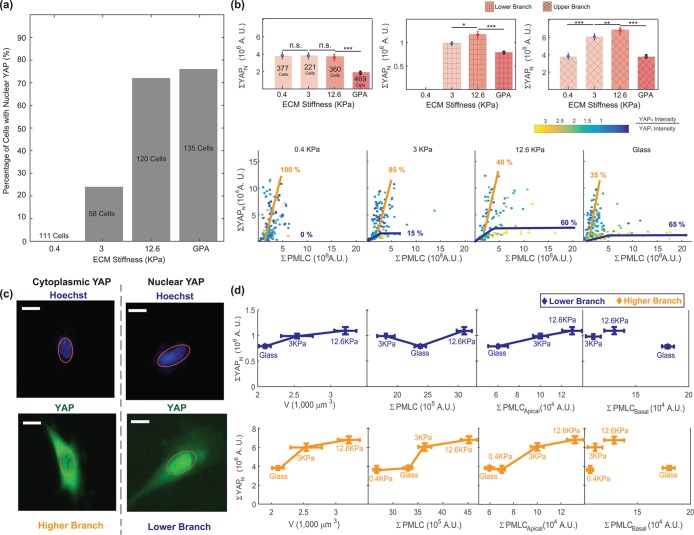
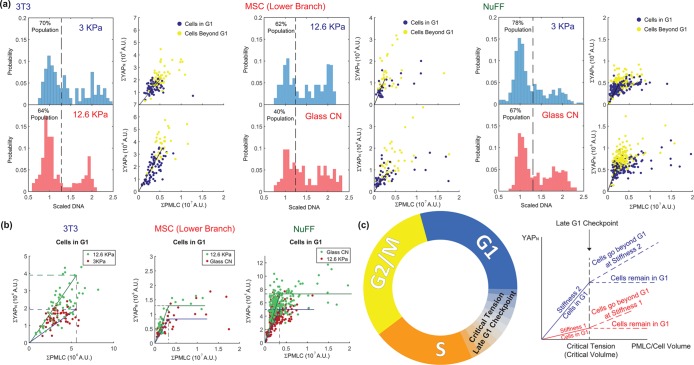
Animal cells use an unknown mechanism to control their growth and physical size. Here, using the fluorescence exclusion method, we measure cell volume for adherent cells on substrates of varying stiffness. We discover that the cell volume has a complex dependence on substrate stiffness and is positively correlated with the size of the cell adhesion to the substrate. From a mechanical force-balance condition that determines the geometry of the cell surface, we find that the observed cell volume variation can be predicted quantitatively from the distribution of active myosin through the cell cortex. To connect cell mechanical tension with cell size homeostasis, we quantified the nuclear localization of YAP/TAZ, a transcription factor involved in cell growth and proliferation. We find that the level of nuclear YAP/TAZ is positively correlated with the average cell volume. Moreover, the level of nuclear YAP/TAZ is also connected to cell tension, as measured by the amount of phosphorylated myosin. Cells with greater apical tension tend to have higher levels of nuclear YAP/TAZ and a larger cell volume. These results point to a size-sensing mechanism based on mechanical tension: the cell tension increases as the cell grows, and increasing tension feeds back biochemically to growth and proliferation control.
Figures
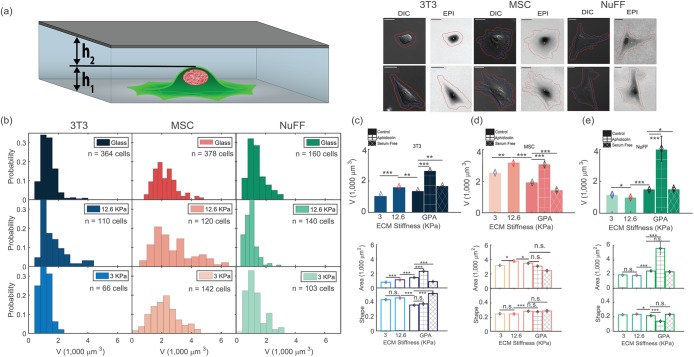
 . Distributions of adhesion areas and shapes are shown in Supplemental Figure S2. MSCs show the largest adhesion area at 12.6 kPa, but for NuFFs and 3T3s, the largest adhesion area occurs on glass substrates. (Scale bar = 10 μm; all error bars represent standard error. Statistical significance: *** p < 10–6; ** p < 0.001; * p < 0.01; n.s.: p > 0.05. Number of cells: for 3T3s: N = 66 on 3 kPa, N = 110 on 12.6 kPa, and N = 364 on collagen-coated glass; for MSCs: N = 142 on 3 kPa, N = 120 on 12.6 kPa, and N = 378 on collagen-coated glass; for NuFFs: N = 103 on 3 kPa, N = 140 on 12.6 kPa, and N = 160 on collagen-coated glass.)
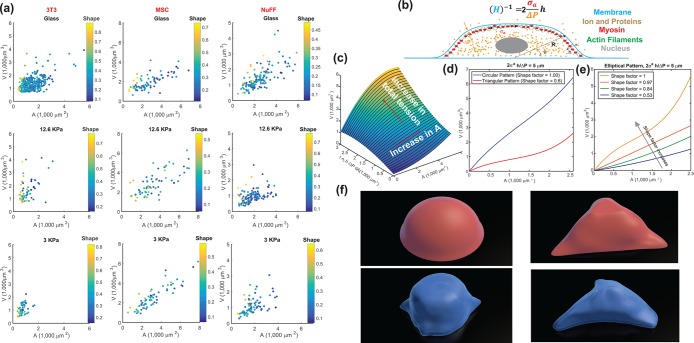
 , in the apical surface to balance the pressure difference. The mean curvature, H, is related to the apical surface shape R (see the Supplemental Material for more details), and h is the cortical thickness. (c) Model predictions of the cell volume as a function of total apical myosin and adhesion area. The model predicts that the cell volume increases with increasing adhesion area and total active myosin contraction. This figure assumes circular adhesion areas for the predicted volume. (d) Relationship between volume and area is dependent on adhesion shape. (e) Shape dependency on elliptical pattern illustrates that for the same
  , more circular cells are larger in size. This is consistent with data in a. All figures (c, d, and e) assume spatially homogeneous
  . (f) Representative 3D cell shapes reconstructed from confocal z-stack images (blue) are compared with model cell shapes (red) computed for the same adhesion shape.
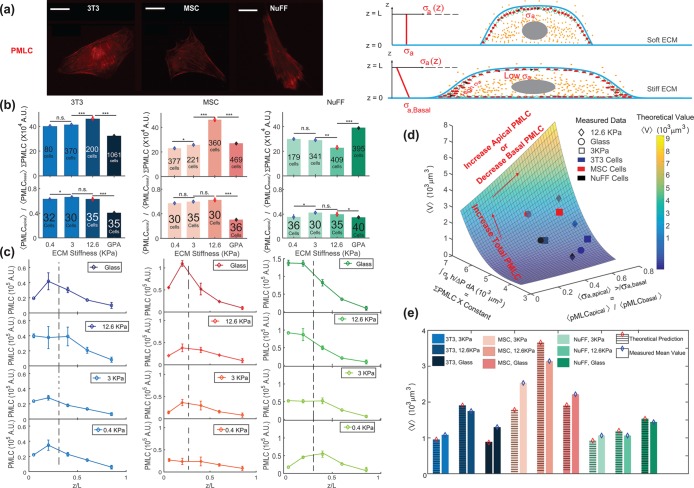
 (Supplemental Material). (e) The model predictions for volume across all stiffnesses are explicitly compared. (Scale bar = 10 μm. All error bars represent standard error. Statistical significance: ***p < 10–6; **p < 0.001; *p < 0.05; n.s.: p > 0.05. Number of cells for epifluorescence imaging: for 3T3s: N = 80 on 0.4 kPa, N = 370 on 3 kPa, N = 200 on 12.6 kPa, and N = 1061 on collagen-coated glass; for MSCs: N = 377 on 0.4 kPa, N = 221 on 3 kPa, N = 360 on 12.6 kPa, and N = 469 on collagen-coated glass; for NuFFs: N = 179 on 0.4 kPa, N = 341 on 3 kPa, N = 409 on 12.6 kPa, and N = 395 on collagen-coated glass. Number of cells for confocal microscopy: for 3T3s: N = 32 on 0.4 kPa, N = 30 on 3 kPa, and N = 35 on 12.6 kPa and on collagen-coated glass; for MSCs: N = 30 on 0.4 kPa and on 12.6 kPa, N = 35 on 3 kPa, and N = 36 on collagen-coated glass; for NuFFs: N = 36 on 0.4 kPa, N = 30 on 3 kPa, N = 35 on 12.6 kPa, and N = 40 on collagen-coated glass.)
References
-
- Bottier C, Gabella C, Vianay B, Buscemi L, Sbalzarini IF, Meiser J-J, Verkhovsky AB. (2011). Dynamic measurement of the height and volume of migrating cells by a novel fluorescence microscopy technique. Lab Chip , 2855–3863. - PubMed
-
- Brooks RF, Shields R. (1985). Cell growth, cell division and cell size homeostasis in Swiss 3T3 cells. Exp Cell Res , 1–6. - PubMed
-
- Cadart C, Zlotek-Zlotkiewicz E, Venkova L, Thouvenin O, Racine V, Le Berre M, Monnier S, Piel M. (2017). Fluorescence eXclusion measurement of volume in live cells. Methods Cell Biol , 103–120. - PubMed
Publication types
MeSH terms
Substances
Grants and funding
LinkOut - more resources
Full Text Sources
Other Literature Sources
