

Prevalence of Disabilities and Health Care Access by Disability Status and Type Among Adults - United States, 2016
- PMID: 30114005
- PMCID: PMC6095650
- DOI: 10.15585/mmwr.mm6732a3
Prevalence of Disabilities and Health Care Access by Disability Status and Type Among Adults - United States, 2016
Abstract
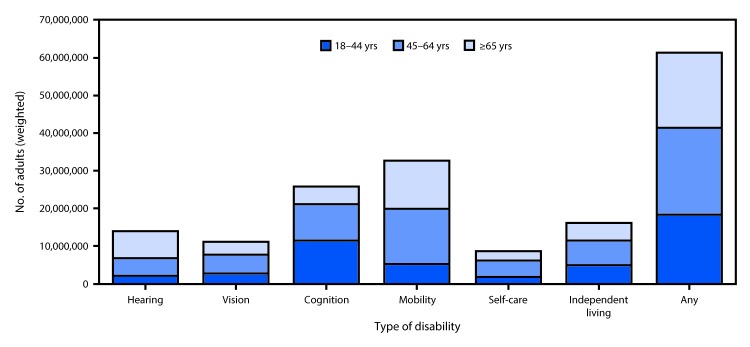
Persons with disabilities face greater barriers to health care than do those without disabilities (1). To identify characteristics of noninstitutionalized adults with six specific disability types (hearing, vision, cognition, mobility, self-care, and independent living),* and to assess disability-specific disparities in health care access, CDC analyzed 2016 Behavioral Risk Factor Surveillance System (BRFSS) data. The prevalences of disability overall and by disability type, and access to health care by disability type, were estimated. Analyses were stratified by three age groups: 18-44 years (young adults), 45-64 years (middle-aged adults), and ≥65 years (older adults). Among young adults, cognitive disability (10.6%) was the most prevalent type. Mobility disability was most prevalent among middle-aged (18.1%) and older adults (26.9%). Generally, disability prevalences were higher among women, American Indians/Alaska Natives (AI/AN), adults with income below the federal poverty level (FPL), and persons in the South U.S. Census region. Disability-specific disparities in health care access were prevalent, particularly among young and middle-aged adults. These data might inform public health programs of the sociodemographic characteristics and disparities in health care access associated with age and specific disability types and guide efforts to improve access to care for persons with disabilities.
Conflict of interest statement
No conflicts of interest were reported.
Figures
References
-
- Office of the Surgeon General. The Surgeon General’s call to action to improve the health and wellness of persons with disabilities. Rockville, MD; 2005. - PubMed
MeSH terms
LinkOut - more resources
Full Text Sources
Other Literature Sources
Medical
