. 2018 Jul 23;26(15):19100-19114.
doi: 10.1364/OE.26.019100.

Fidelity test for through-focus or volumetric type of optical imaging methods

Fidelity test for through-focus or volumetric type of optical imaging methods

Ravi Kiran Attota. Opt Express. .

Abstract

Rapid increase in interest and applications of through-focus (TF) or volumetric type of optical imaging in biology and other areas has resulted in the development of several TF image collection methods. Achieving quantitative results from images requires standardization and optimization of image acquisition protocols. Several standardization protocols are available for conventional optical microscopy where a best-focus image is used, but to date, rigorous testing protocols do not exist for TF optical imaging. In this paper, we present a method to determine the fidelity of the TF optical data using the TF scanning optical microscopy images.


Conflict of interest statement

Disclosures

The author declares no conflicts of interest related to this article.

Figures

Fig. 1
Fig. 1
Animation depicting a typical TSOM image construction process.
Fig. 2
Fig. 2
(a) A typical top-down optical image of the selected line. (b) The relative lateral displacement of the target image in the X-direction for the selected three conditions indicated at the top of the figure. Condition 1: the camera exposure time was 1 ms with simulated vibrations transmitted to the microscope from a running fan placed on the microscope. Condition 2: the camera exposure time was 1 ms without the fan. Condition 3: the camera exposure time was 500 ms without the fan. The measured standard deviations of the lateral movement under the three conditions are shown at the bottom.
Fig. 3
Fig. 3
(a) TSOM image of the selected line target at 100 nm step size. (b) Figure depicting relative orientations of the optical and the TSOM images.
Fig. 4
Fig. 4
D-TSOM images representing (a) typical non-mechanical sources of noise, and (b) zero noise. Numbers in the inset are MAV/OIR values.
Fig.5
Fig.5
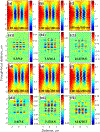
Effect of the simulated random mechanical lateral stage vibrations of different magnitudes during TF image collection. (a), (b), and (c) Typical TSOM images with 100 nm step size for lateral stage vibrations of 0 nm to ±20 nm, ±40 nm, and ±80 nm, respectively. (a1), (b1), and (c1) Typical D-TSOM images between two TSOM images generated similar to (a), (b), and (c), respectively. (d), (e), and (f) Typical TSOM images with 250 nm step size for lateral stage vibrations of 0 to ±20 nm, ±40 nm, and ±80 nm, respectively. (d1), (e1), and (f1) Typical D-TSOM images between two TSOM images generated similar to (d), (e), and (f), respectively. Numbers in the inset of (a) to (f) indicate lateral maximum vibrations and focus step size. Numbers in the inset of (a1) to (f1) indicate mean MAV/OIR values from 20 repeats.
Fig. 6
Fig. 6
Mean D-TSOM image noise levels as extracted by (a) MAV, and (b) OIR, for different simulated maximum lateral vibrations at two focus steps sizes of 100 nm and 250 nm. ‘Self’ indicates D-TSOM image obtained using random lateral vibrations applied on the same TSOM image. ‘Repeat’ indicates D-TSOM image obtained using random lateral vibrations applied on repeated collections of the TSOM images from the same line target. Error bars represent one standard deviation using 20 data points.
Fig. 7
Fig. 7
One standard deviation of the noise extracted using MAV and OIR metrics as a percentage of the mean values obtained from repeating the process 20 times for (a) lateral, and (b) axial vibrations. The D-TSOM images were extracted using random vibrations applied to the same (‘self’) TSOM image.
Fig.8
Fig.8
Effect of the simulated random mechanical stage vibrations in the focus (axial) direction of different magnitudes during TF image collection. (a), (b), and (c) Typical TSOM images with 100 nm step size for axial stage vibrations of 0 nm to ±20 nm ±40 nm, and ±80 nm, respectively. (a1), (b1), and (c1) Typical D-TSOM images between two TSOM images generated similar to (a), (b), and (c), respectively. (d), (e), and (f) Typical TSOM images with 250 nm step size for axial stage vibrations of 0 to ±20 nm, ±40 nm, and ±80 nm, respectively. (d1), (e1), and (f1) Typical D-TSOM images between two TSOM images generated similar to (d), (e), and (f), respectively. Numbers in the inset of (a) to (f) indicate axial maximum vibrations and focus step size. Numbers in the inset of (a1) to (f1) indicate mean MAV/OIR values from 20 repeats.
Fig. 9
Fig. 9
Mean D-TSOM image noise levels as extracted by (a) MAV, and (b) OIR, for the different simulated maximum axial vibrations at two focus steps sizes of 100 nm and 250 nm. ‘Self’ indicates D-TSOM image obtained using random axial vibrations applied on the same TSOM image twice. ‘Repeat’ indicates D-TSOM image obtained using random axial vibrations applied on repeated collections of TSOM images from the same line target. Error bars represent one standard deviation using 20 data points.
Fig. 10
Fig. 10
Mean D-TSOM image noise levels as extracted by (a) MAV, and (b) OIR, for the different simulated maximum lateral and axial vibrations together at two focus steps sizes of 100 nm and 250 nm. ‘Self’ indicates D-TSOM image obtained using random lateral and axial vibrations applied on the same TSOM image twice. ‘Repeat’ indicates D-TSOM image obtained using random lateral and axial vibrations applied on repeated collections of TSOM images from the same line target. Error bars represent one standard deviation using 20 data points.
Fig. 11
Fig. 11
Effect of the increased camera exposure time on the natural mechanical stage vibrations detected during TF image collection. (a), (b), (c) and (d) Typical TSOM images with 100 nm step size for different camera exposure. (a1), (b1), (c1) and (d1) Typical D-TSOM images between two TSOM images generated similar to (a), (b), (c) and (d), respectively. Numbers in the inset of (a) to (d) indicate camera exposure time and activation condition of the computer cooling fan placed on the microscope. Numbers in the inset of (a1) to (d1) indicate mean MAV/OIR values from 20 repeats.
Fig. 12
Fig. 12
Mean noise as measured by MAV/OIR with increased camera exposure time. The error bars represent one standard deviation using 20 measurements.
Fig. 13
Fig. 13
Tilt in the TSOM axis shown by dashed lines due to (a) the stage unidirectional lateral movement (in this case 10 nm lateral shift to the right for each focus step), and (b) misalignment of the aperture diaphragm (reproduced from [15]).

Similar articles

References

    1. Attota R, “Through-focus or volumetric type of optical imaging methods: a review,” J Biomed Opt 23, 1910019114 (2018). - PMC - PubMed
    1. von Diezmann A, Shechtman Y, and Moerner WE, “Three-Dimensional Localization of Single Molecules for Super-Resolution Imaging and Single-Particle Tracking,” Chem Rev 117, 7244–7275 (2017).. - PMC - PubMed
    1. Azaripour A, Lagerweij T, Scharfbillig C, Jadczak AE, Swaan B. v. d., Molenaar M, Waal R. v. d., Kielbassa K, Tigchelaar W, Picavet DI, Jonker A, Hendrikx EML, Hira VVV, Khurshed M, and Noorden CJFV, “Three-dimensional histochemistry and imaging of human gingiva,” Sci Rep-Uk 8, 1647 (2018). - PMC - PubMed
    1. Katona G, Szalay G, Maák P, Kaszás A, Veress M, Hillier D, Chiovini B, Vizi ES, Roska B, and Rózsa B, “Fast two-photon in vivo imaging with three-dimensional random-access scanning in large tissue volumes,” Nat Methods 9, 201 (2012). - PubMed
    1. Prabhat P, Ram S, Ward ES, and Ober RJ, “Simultaneous imaging of different focal planes in fluorescence microscopy for the study of cellular dynamics in three dimensions,” IEEE Transactions on NanoBioscience 3, 237242 (2004). - PMC - PubMed

LinkOut - more resources