

Deubiquitinase inhibitor PR-619 reduces Smad4 expression and suppresses renal fibrosis in mice with unilateral ureteral obstruction
- PMID: 30114247
- PMCID: PMC6095583
- DOI: 10.1371/journal.pone.0202409
Deubiquitinase inhibitor PR-619 reduces Smad4 expression and suppresses renal fibrosis in mice with unilateral ureteral obstruction
Abstract
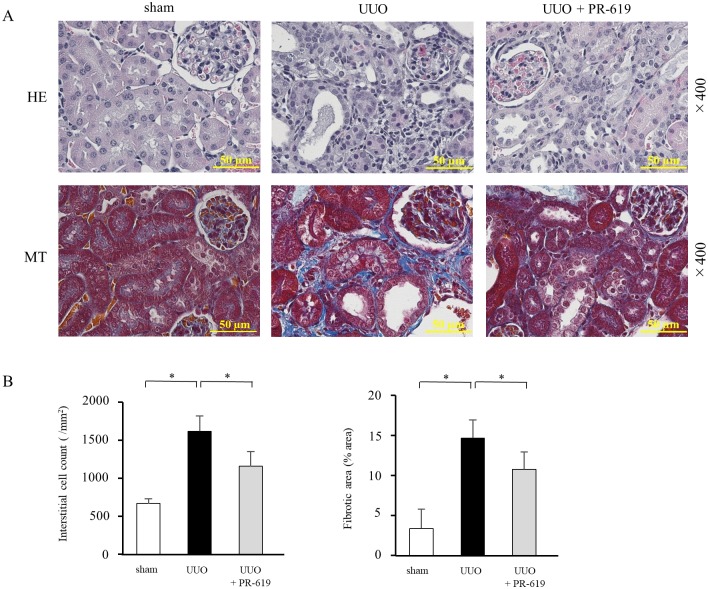
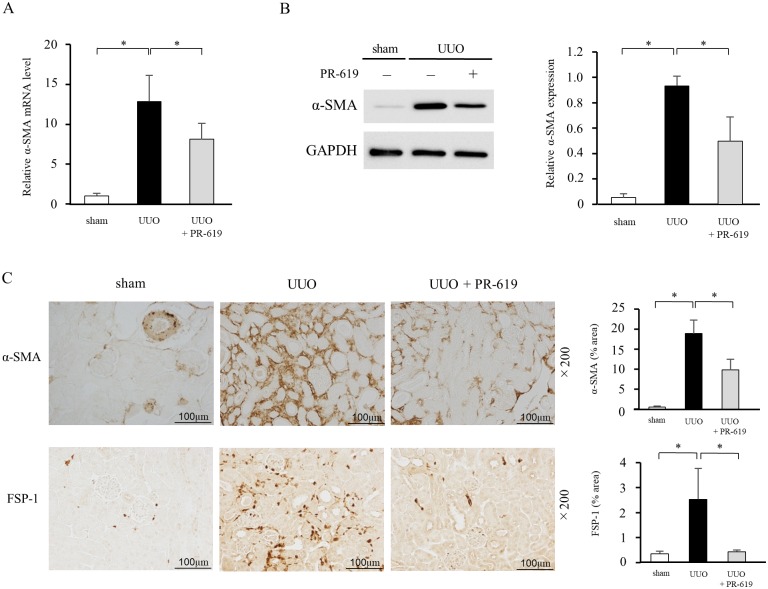
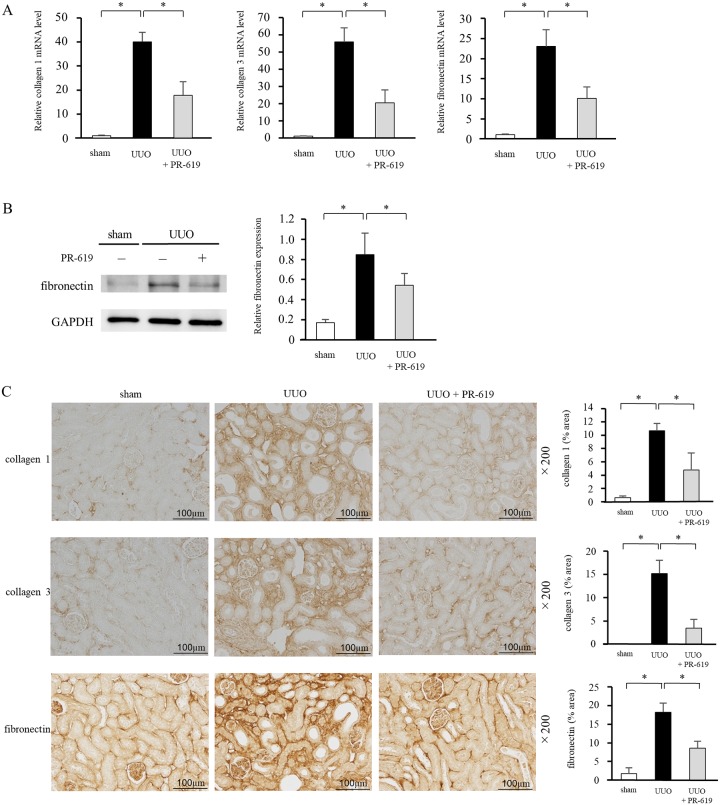
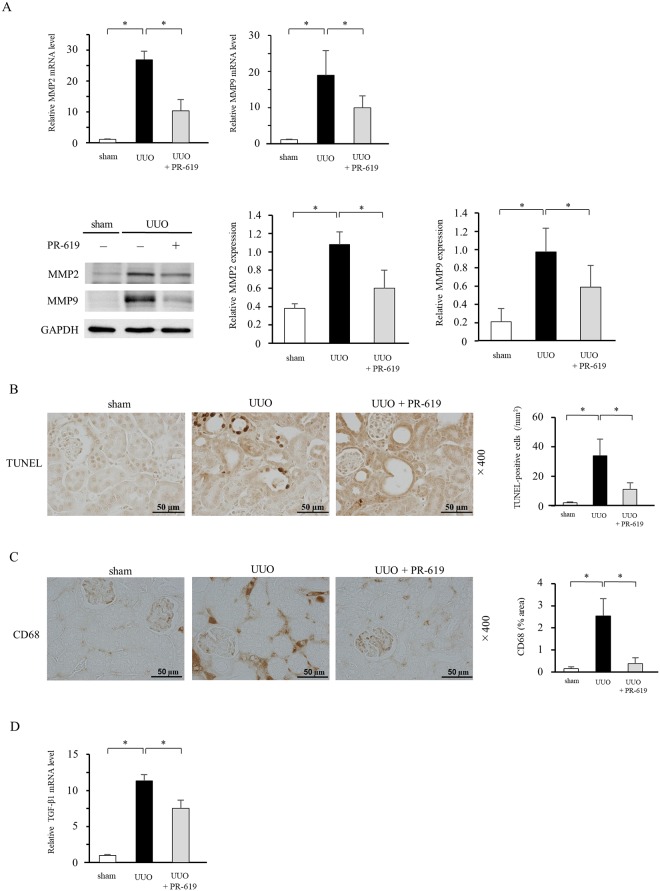
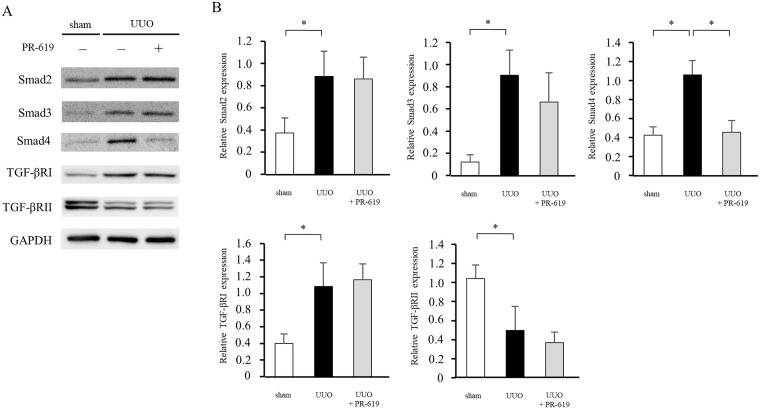
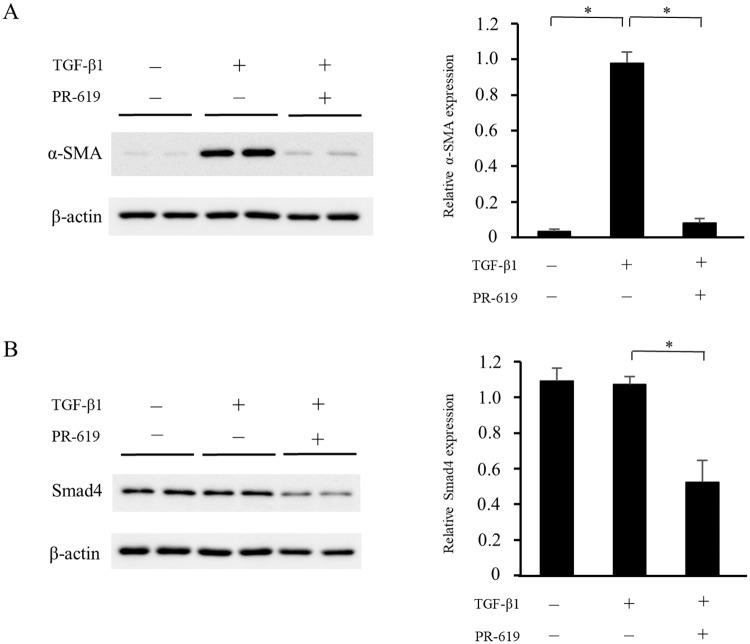
Deubiquitinating enzymes (DUBs) remove ubiquitin from their substrates and, together with ubiquitin ligases, play an important role in the regulation of protein expression. Although transforming growth factor (TGF)-β1-Smad signaling is a central pathway of renal fibrosis, the role of DUBs in the expression of TGF-β receptors and Smads during the development of renal fibrosis remains unknown. In this study, we investigated whether PR-619, a pan-DUB inhibitor, suppresses fibrosis in mice with unilateral ureteral obstruction (UUO) and TGF-β1-stimulated normal rat kidney (NRK)-49F cells, a rat renal fibroblast cell line. Either the vehicle (dimethyl sulfoxide) or PR-619 (100 μg) was intraperitoneally administered to mice after UUO induction once a day for 7 days. Administration of PR-619 attenuated renal fibrosis with downregulation of mesenchymal markers, extracellular matrix proteins, matrix metalloproteinases, apoptosis, macrophage infiltration, and the TGF-β1 mRNA level in UUO mice. Although type I TGF-β receptor (TGF-βRI), Smad2, Smad3, and Smad4 protein expression levels were markedly increased in mice with UUO, administration of PR-619 suppressed only Smad4 expression but not TGF-βRI, Smad2, or Smad3 expression. PR-619 also had an inhibitory effect on TGF-β1-induced α-smooth muscle actin expression and reduced Smad4 levels in NRK-49F cells. Our results indicate that PR-619 ameliorates renal fibrosis, which is accompanied by the reduction of Smad4 expression.
Conflict of interest statement
The authors have declared that no competing interests exist.
Figures
Similar articles
-
Anti-renal fibrosis effect of asperulosidic acid via TGF-β1/smad2/smad3 and NF-κB signaling pathways in a rat model of unilateral ureteral obstruction.Phytomedicine. 2019 Feb;53:274-285. doi: 10.1016/j.phymed.2018.09.009. Epub 2018 Sep 5. Phytomedicine. 2019. PMID: 30668407
-
Inhibition of spleen tyrosine kinase (syk) suppresses renal fibrosis through anti-inflammatory effects and down regulation of the MAPK-p38 pathway.Int J Biochem Cell Biol. 2016 May;74:135-44. doi: 10.1016/j.biocel.2016.03.001. Epub 2016 Mar 3. Int J Biochem Cell Biol. 2016. PMID: 26948651
-
The glucagon-like peptide-1 (GLP-1) analog liraglutide attenuates renal fibrosis.Pharmacol Res. 2018 May;131:102-111. doi: 10.1016/j.phrs.2018.03.004. Epub 2018 Mar 9. Pharmacol Res. 2018. PMID: 29530599
-
Oxidative stress in obstructive nephropathy.Int J Exp Pathol. 2011 Jun;92(3):202-10. doi: 10.1111/j.1365-2613.2010.00730.x. Epub 2010 Aug 27. Int J Exp Pathol. 2011. PMID: 20804541 Free PMC article. Review.
-
Functional analysis of deubiquitylating enzymes in tumorigenesis and development.Biochim Biophys Acta Rev Cancer. 2019 Dec;1872(2):188312. doi: 10.1016/j.bbcan.2019.188312. Epub 2019 Aug 23. Biochim Biophys Acta Rev Cancer. 2019. PMID: 31449841 Review.
Cited by
-
Smad4-dependent morphogenic signals control the maturation and axonal targeting of basal vomeronasal sensory neurons to the accessory olfactory bulb.Development. 2020 Apr 27;147(8):dev184036. doi: 10.1242/dev.184036. Development. 2020. PMID: 32341026 Free PMC article.
-
The Protective Effect of Zebularine, an Inhibitor of DNA Methyltransferase, on Renal Tubulointerstitial Inflammation and Fibrosis.Int J Mol Sci. 2022 Nov 14;23(22):14045. doi: 10.3390/ijms232214045. Int J Mol Sci. 2022. PMID: 36430531 Free PMC article.
-
TGF‑β/Smad signaling in chronic kidney disease: Exploring post‑translational regulatory perspectives (Review).Mol Med Rep. 2024 Aug;30(2):143. doi: 10.3892/mmr.2024.13267. Epub 2024 Jun 21. Mol Med Rep. 2024. PMID: 38904198 Free PMC article. Review.
-
Inhibition of deubiquitination by PR-619 induces apoptosis and autophagy via ubi-protein aggregation-activated ER stress in oesophageal squamous cell carcinoma.Cell Prolif. 2021 Jan;54(1):e12919. doi: 10.1111/cpr.12919. Epub 2020 Oct 31. Cell Prolif. 2021. PMID: 33129231 Free PMC article.
-
Dendrobium Mixture Ameliorates Diabetic Nephropathy in db/db Mice by Regulating the TGF-β1/Smads Signaling Pathway.Evid Based Complement Alternat Med. 2021 Sep 30;2021:9931983. doi: 10.1155/2021/9931983. eCollection 2021. Evid Based Complement Alternat Med. 2021. PMID: 34630622 Free PMC article.
References
-
- Nangaku M. Mechanisms of tubulointerstitial injury in the kidney: final common pathways to end-stage renal failure. Intern Med. 2004; 43: 9–17. - PubMed
Publication types
MeSH terms
Substances
LinkOut - more resources
Full Text Sources
Other Literature Sources
Research Materials
Miscellaneous
