

Measuring Subjective Probabilities: The Effect of Response Mode on the Use of Focal Responses, Validity, and Respondents' Evaluations
- PMID: 30114338
- PMCID: PMC7644146
- DOI: 10.1111/risa.13138
Measuring Subjective Probabilities: The Effect of Response Mode on the Use of Focal Responses, Validity, and Respondents' Evaluations
Abstract
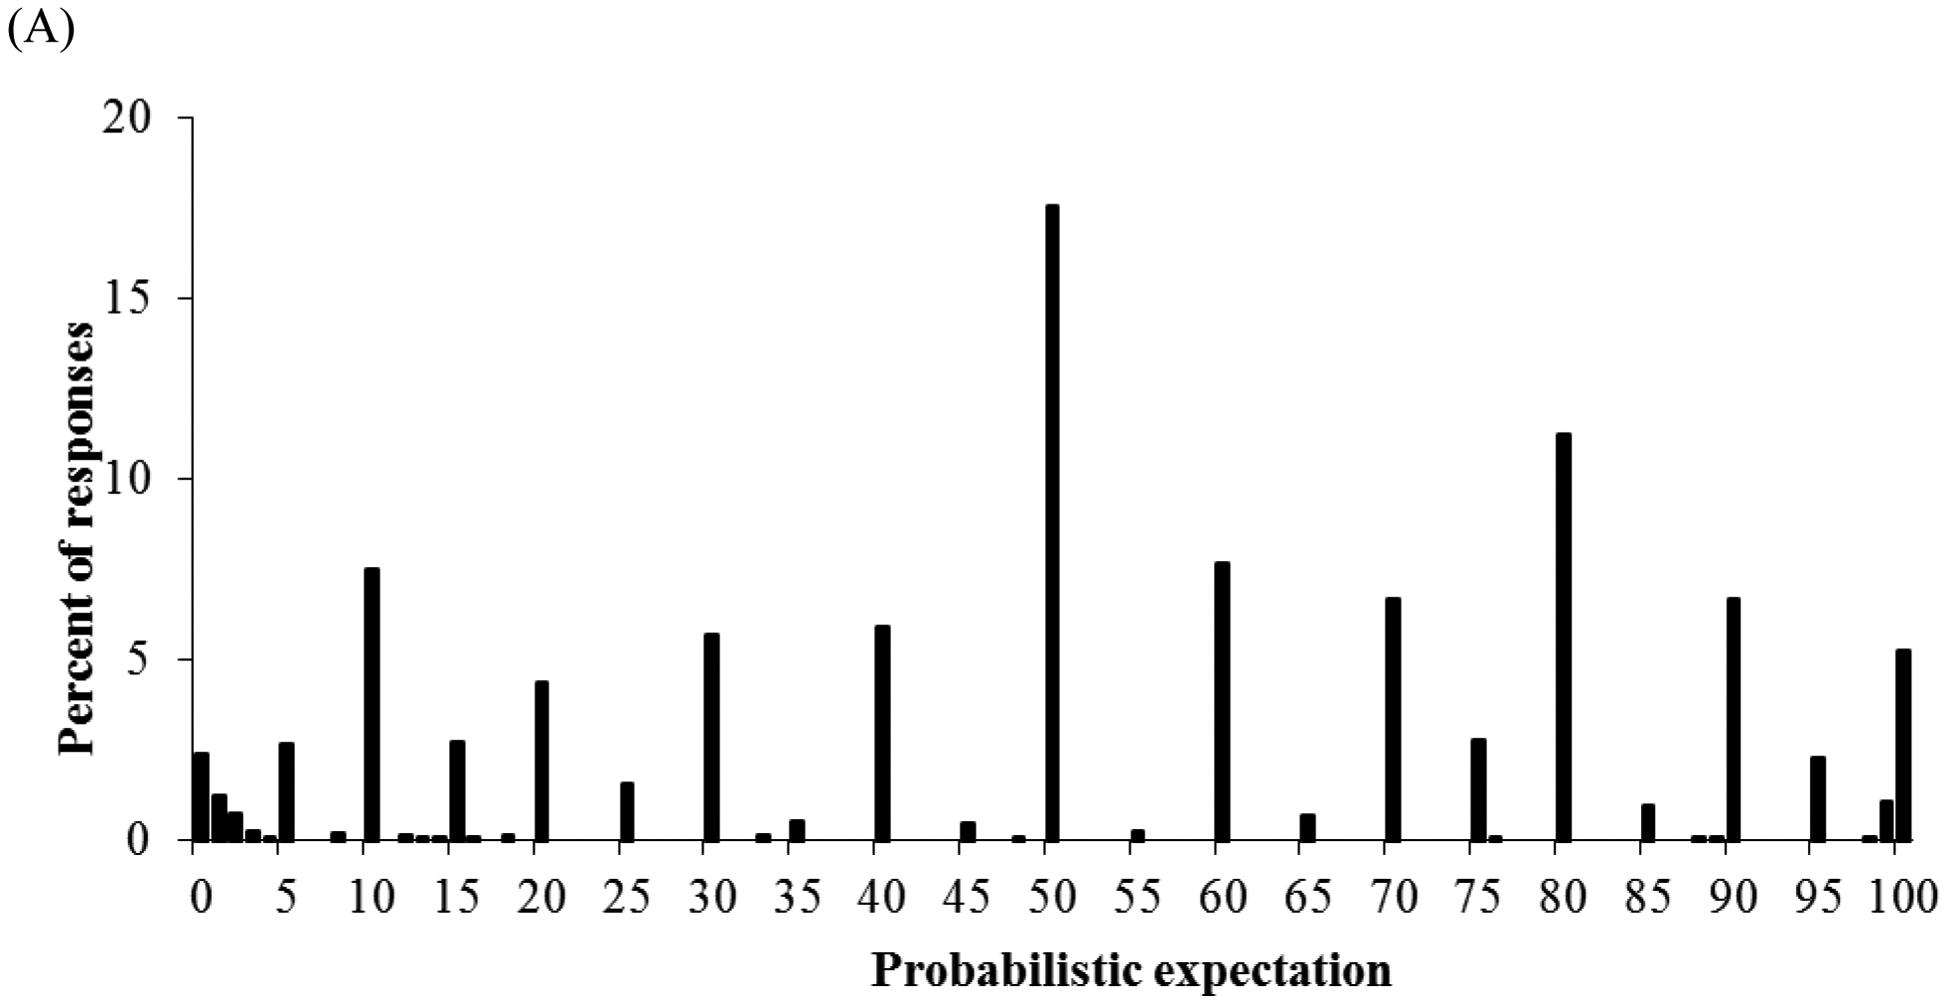
Subjective probabilities are central to risk assessment, decision making, and risk communication efforts. Surveys measuring probability judgments have traditionally used open-ended response modes, asking participants to generate a response between 0% and 100%. A typical finding is the seemingly excessive use of 50%, perhaps as an expression of "I don't know." In an online survey with a nationally representative sample of the Dutch population, we examined the effect of response modes on the use of 50% and other focal responses, predictive validity, and respondents' survey evaluations. Respondents assessed the probability of dying, getting the flu, and experiencing other health-related events. They were randomly assigned to a traditional open-ended response mode, a visual linear scale ranging from 0% to 100%, or a version of that visual linear scale on which a magnifier emerged after clicking on it. We found that, compared to the open-ended response mode, the visual linear and magnifier scale each reduced the use of 50%, 0%, and 100% responses, especially among respondents with low numeracy. Responses given with each response mode were valid, in terms of significant correlations with health behavior and outcomes. Where differences emerged, the visual scales seemed to have slightly better validity than the open-ended response mode. Both high-numerate and low-numerate respondents' evaluations of the surveys were highest for the visual linear scale. Our results have implications for subjective probability elicitation and survey design.
Keywords: Expectations; response mode; subjective probabilities.
© 2018 Society for Risk Analysis.
Figures


References
-
- Bruine de Bruin W, Downs JS, Murray PM, & Fischhoff B (2010). Can female adolescents tell whether they will test positive for Chlamydia infection? Medical Decision Making, 30, 189–193. - PubMed
-
- Bruine de Bruin W, Fischbeck PS, Stiber NA, & Fischhoff B (2002). What number is “fifty-fifty”? Redistributing excess 50% responses in risk perception studies. Risk Analysis, 22, 725–735. - PubMed
-
- Bruine de Bruin W, Fischhoff B, Millstein SG, & Halpern-Felsher BL (2000). Verbal and numerical expressions of probability: “It’s a fifty-fifty chance.” Organizational Behavior and Human Decision Processes, 81, 115–131. - PubMed
-
- Bruine de Bruin W, Parker AM & Fischhoff B (2007a). Individual differences in Adult Decision-Making Competence. Journal of Personality and Social Psychology, 92, 938–956. - PubMed
Publication types
MeSH terms
Grants and funding
LinkOut - more resources
Full Text Sources
Other Literature Sources
