

Processing of auditory novelty across the cortical hierarchy: An intracranial electrophysiology study
- PMID: 30114466
- PMCID: PMC6207077
- DOI: 10.1016/j.neuroimage.2018.08.027
Processing of auditory novelty across the cortical hierarchy: An intracranial electrophysiology study
Abstract
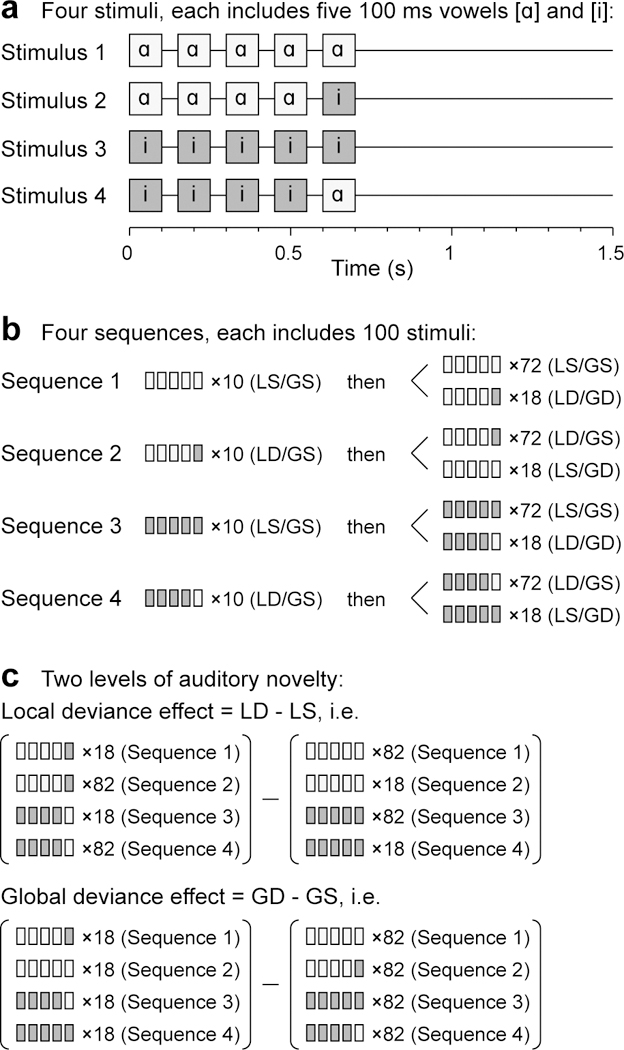
Under the predictive coding hypothesis, specific spatiotemporal patterns of cortical activation are postulated to occur during sensory processing as expectations generate feedback predictions and prediction errors generate feedforward signals. Establishing experimental evidence for this information flow within cortical hierarchy has been difficult, especially in humans, due to spatial and temporal limitations of non-invasive measures of cortical activity. This study investigated cortical responses to auditory novelty using the local/global deviant paradigm, which engages the hierarchical network underlying auditory predictive coding over short ('local deviance'; LD) and long ('global deviance'; GD) time scales. Electrocorticographic responses to auditory stimuli were obtained in neurosurgical patients from regions of interest (ROIs) including auditory, auditory-related and prefrontal cortex. LD and GD effects were assayed in averaged evoked potential (AEP) and high gamma (70-150 Hz) signals, the former likely dominated by local synaptic currents and the latter largely reflecting local spiking activity. AEP LD effects were distributed across all ROIs, with greatest percentage of significant sites in core and non-core auditory cortex. High gamma LD effects were localized primarily to auditory cortex in the superior temporal plane and on the lateral surface of the superior temporal gyrus (STG). LD effects exhibited progressively longer latencies in core, non-core, auditory-related and prefrontal cortices, consistent with feedforward signaling. The spatial distribution of AEP GD effects overlapped that of LD effects, but high gamma GD effects were more restricted to non-core areas. High gamma GD effects had shortest latencies in STG and preceded AEP GD effects in most ROIs. This latency profile, along with the paucity of high gamma GD effects in the superior temporal plane, suggest that the STG plays a prominent role in initiating novelty detection signals over long time scales. Thus, the data demonstrate distinct patterns of information flow in human cortex associated with auditory novelty detection over multiple time scales.
Keywords: Averaged evoked potential; Electrocorticography; High gamma; Human auditory cortex; Predictive coding.
Copyright © 2018 Elsevier Inc. All rights reserved.
Figures


Similar articles
-
Cortical responses to auditory novelty across task conditions: An intracranial electrophysiology study.Hear Res. 2021 Jan;399:107911. doi: 10.1016/j.heares.2020.107911. Epub 2020 Feb 11. Hear Res. 2021. PMID: 32081413 Free PMC article.
-
Auditory Predictive Coding across Awareness States under Anesthesia: An Intracranial Electrophysiology Study.J Neurosci. 2018 Sep 26;38(39):8441-8452. doi: 10.1523/JNEUROSCI.0967-18.2018. Epub 2018 Aug 20. J Neurosci. 2018. PMID: 30126970 Free PMC article.
-
Electrocorticographic delineation of human auditory cortical fields based on effects of propofol anesthesia.Neuroimage. 2017 May 15;152:78-93. doi: 10.1016/j.neuroimage.2017.02.061. Epub 2017 Feb 27. Neuroimage. 2017. PMID: 28254512 Free PMC article.
-
How do auditory cortex neurons represent communication sounds?Hear Res. 2013 Nov;305:102-12. doi: 10.1016/j.heares.2013.03.011. Epub 2013 Apr 17. Hear Res. 2013. PMID: 23603138 Review.
-
Auditory processing in the human cortex: An intracranial electrophysiology perspective.Laryngoscope Investig Otolaryngol. 2017 Apr 12;2(4):147-156. doi: 10.1002/lio2.73. eCollection 2017 Aug. Laryngoscope Investig Otolaryngol. 2017. PMID: 28894834 Free PMC article. Review.
Cited by
-
Cortical responses to auditory novelty across task conditions: An intracranial electrophysiology study.Hear Res. 2021 Jan;399:107911. doi: 10.1016/j.heares.2020.107911. Epub 2020 Feb 11. Hear Res. 2021. PMID: 32081413 Free PMC article.
-
Complex auditory regularity processing across levels of consciousness in coma: Stage 1 Registered Report.Brain Commun. 2024 Dec 21;7(1):fcae466. doi: 10.1093/braincomms/fcae466. eCollection 2025. Brain Commun. 2024. PMID: 39822953 Free PMC article.
-
Deep Relational Reasoning for the Prediction of Language Impairment and Postoperative Seizure Outcome Using Preoperative DWI Connectome Data of Children With Focal Epilepsy.IEEE Trans Med Imaging. 2021 Mar;40(3):793-804. doi: 10.1109/TMI.2020.3036933. Epub 2021 Mar 2. IEEE Trans Med Imaging. 2021. PMID: 33166251 Free PMC article.
-
Cortical encoding of melodic expectations in human temporal cortex.Elife. 2020 Mar 3;9:e51784. doi: 10.7554/eLife.51784. Elife. 2020. PMID: 32122465 Free PMC article.
-
Functional connectivity across the human subcortical auditory system using an autoregressive matrix-Gaussian copula graphical model approach with partial correlations.Imaging Neurosci (Camb). 2024;2:imag-2-00258. doi: 10.1162/imag_a_00258. Epub 2024 Aug 12. Imaging Neurosci (Camb). 2024. PMID: 39421593 Free PMC article.
References
-
- Alho K, 1995. Cerebral generators of mismatch negativity (MMN) and its magnetic counterpart (MMNm) elicited by sound changes. Ear Hear 16, 38–51. - PubMed
-
- Banks MI, Nourski KV, Kawasaki H, Howard III MA, 2017. Effects of propofol anesthesia on connectivity within the human auditory cortical hierarchy: An intracranial electrophysiological study. Society for Neuroscience 47th Annual Meeting, 489.19. Society for Neuroscience, Washington, DC.
-
- Baudena P, Halgren E, Heit G, Clarke JM, 1995. Intracerebral potentials to rare target and distractor auditory and visual stimuli. III. Frontal cortex. Electroencephalogr Clin Neurophysiol 94, 251–264. - PubMed
Publication types
MeSH terms
Grants and funding
LinkOut - more resources
Full Text Sources
Other Literature Sources
Research Materials
