

Firm responses to targeted consumer incentives: Evidence from reference pricing for surgical services
- PMID: 30114564
- PMCID: PMC10830325
- DOI: 10.1016/j.jhealeco.2018.06.012
Firm responses to targeted consumer incentives: Evidence from reference pricing for surgical services
Abstract
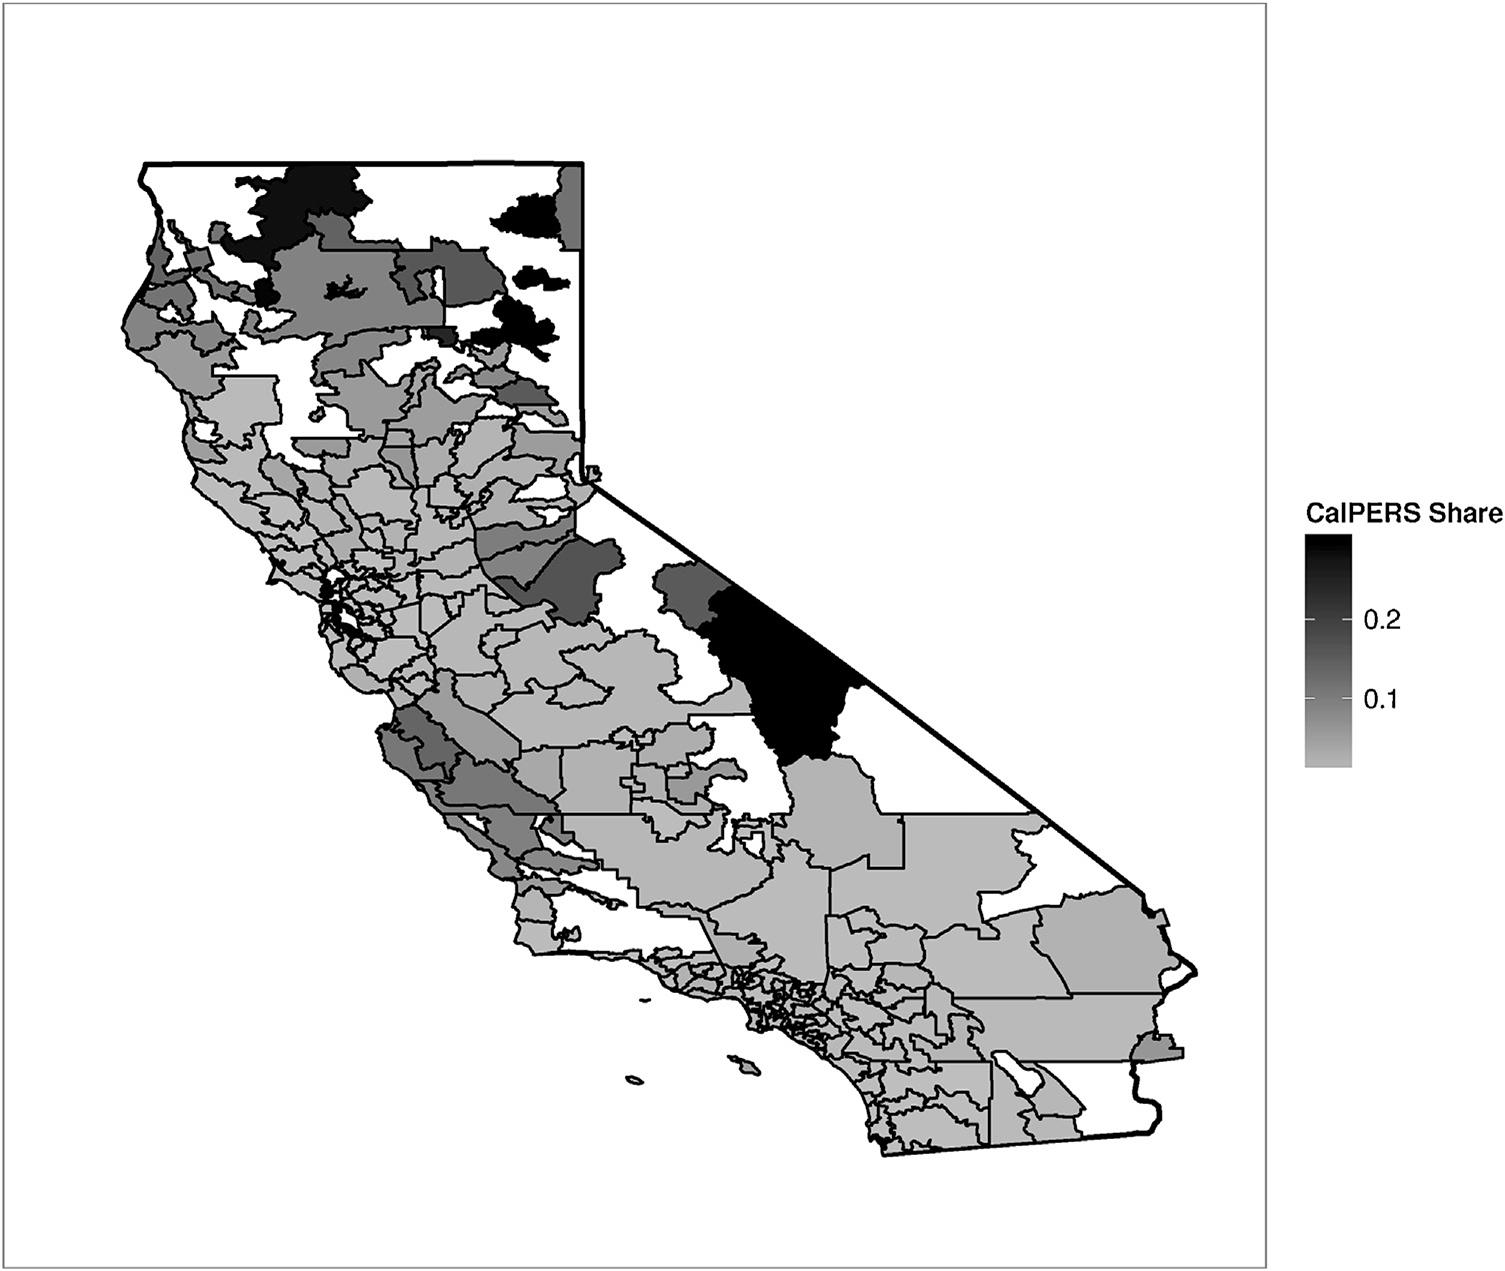
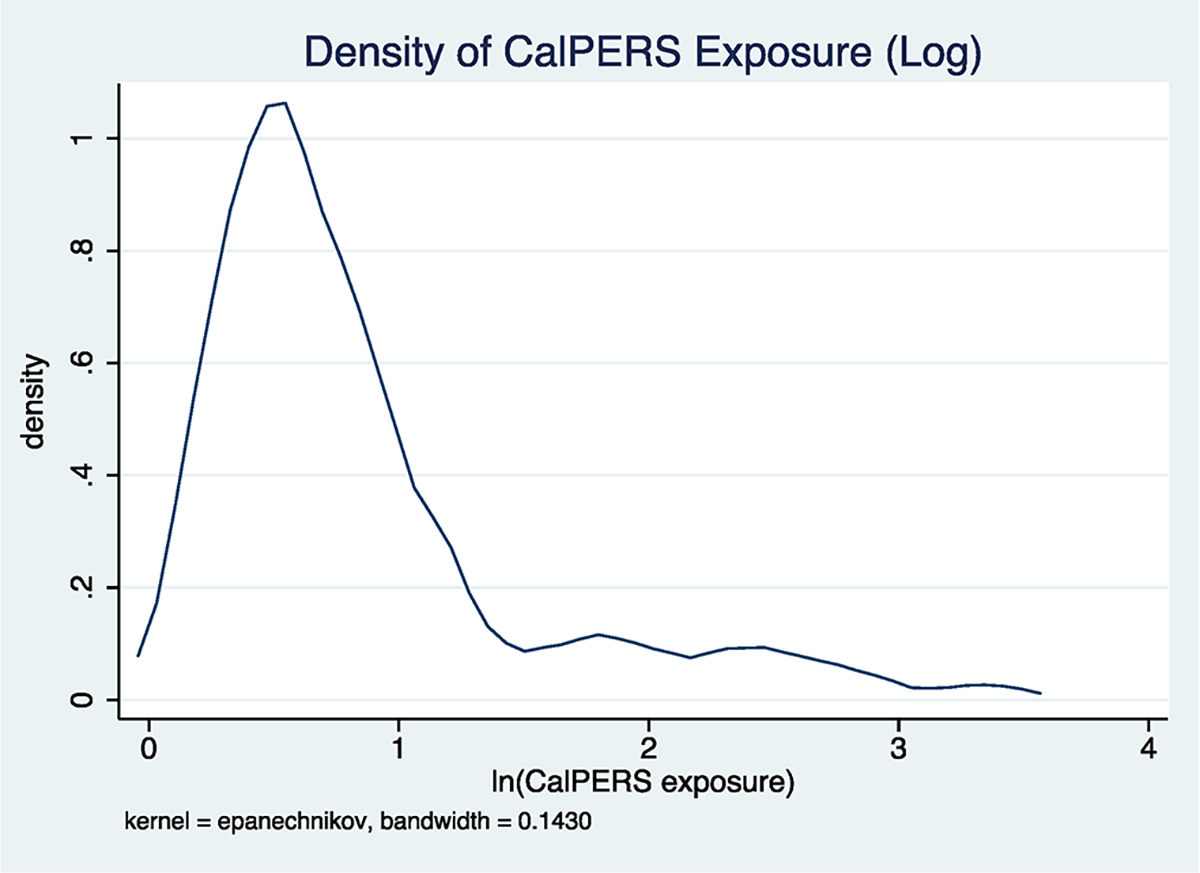
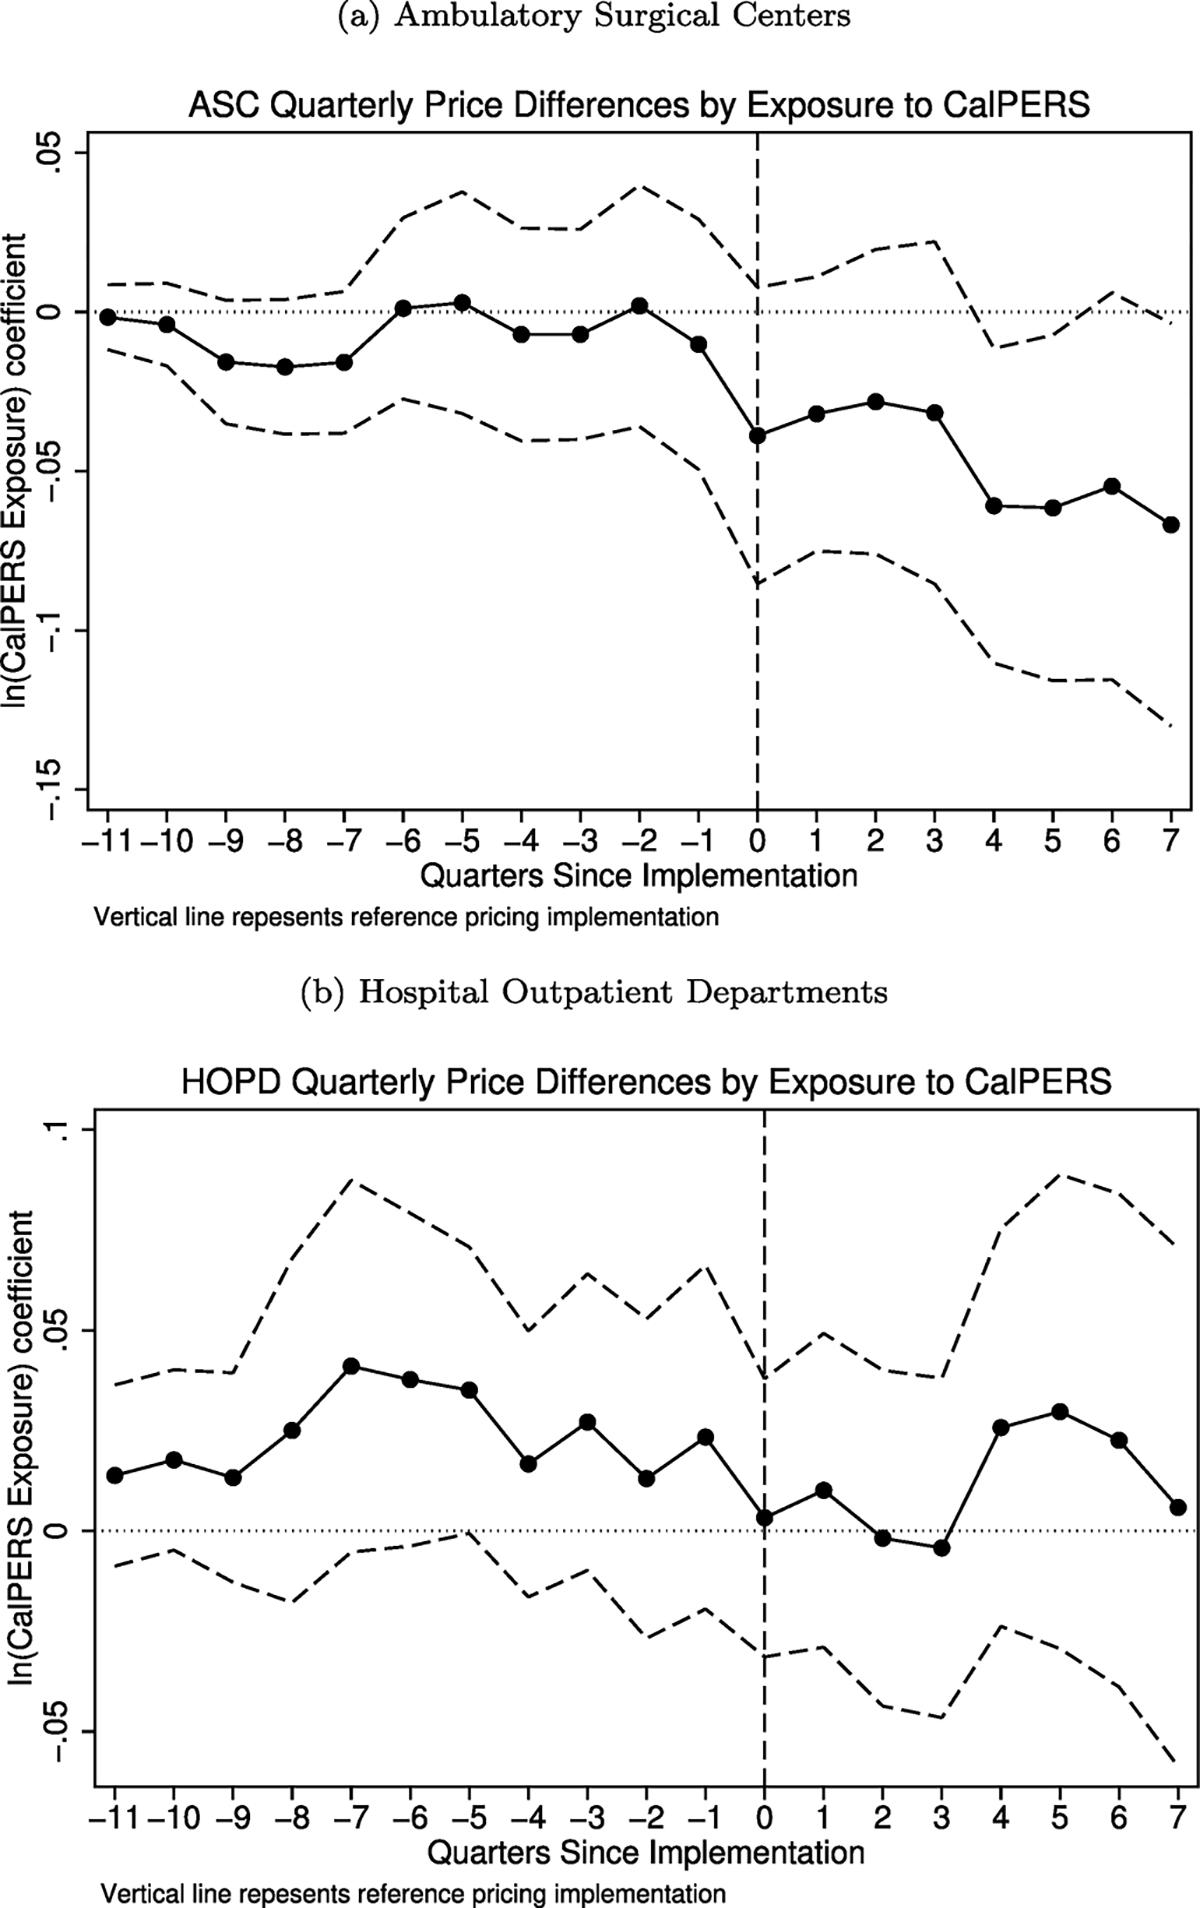
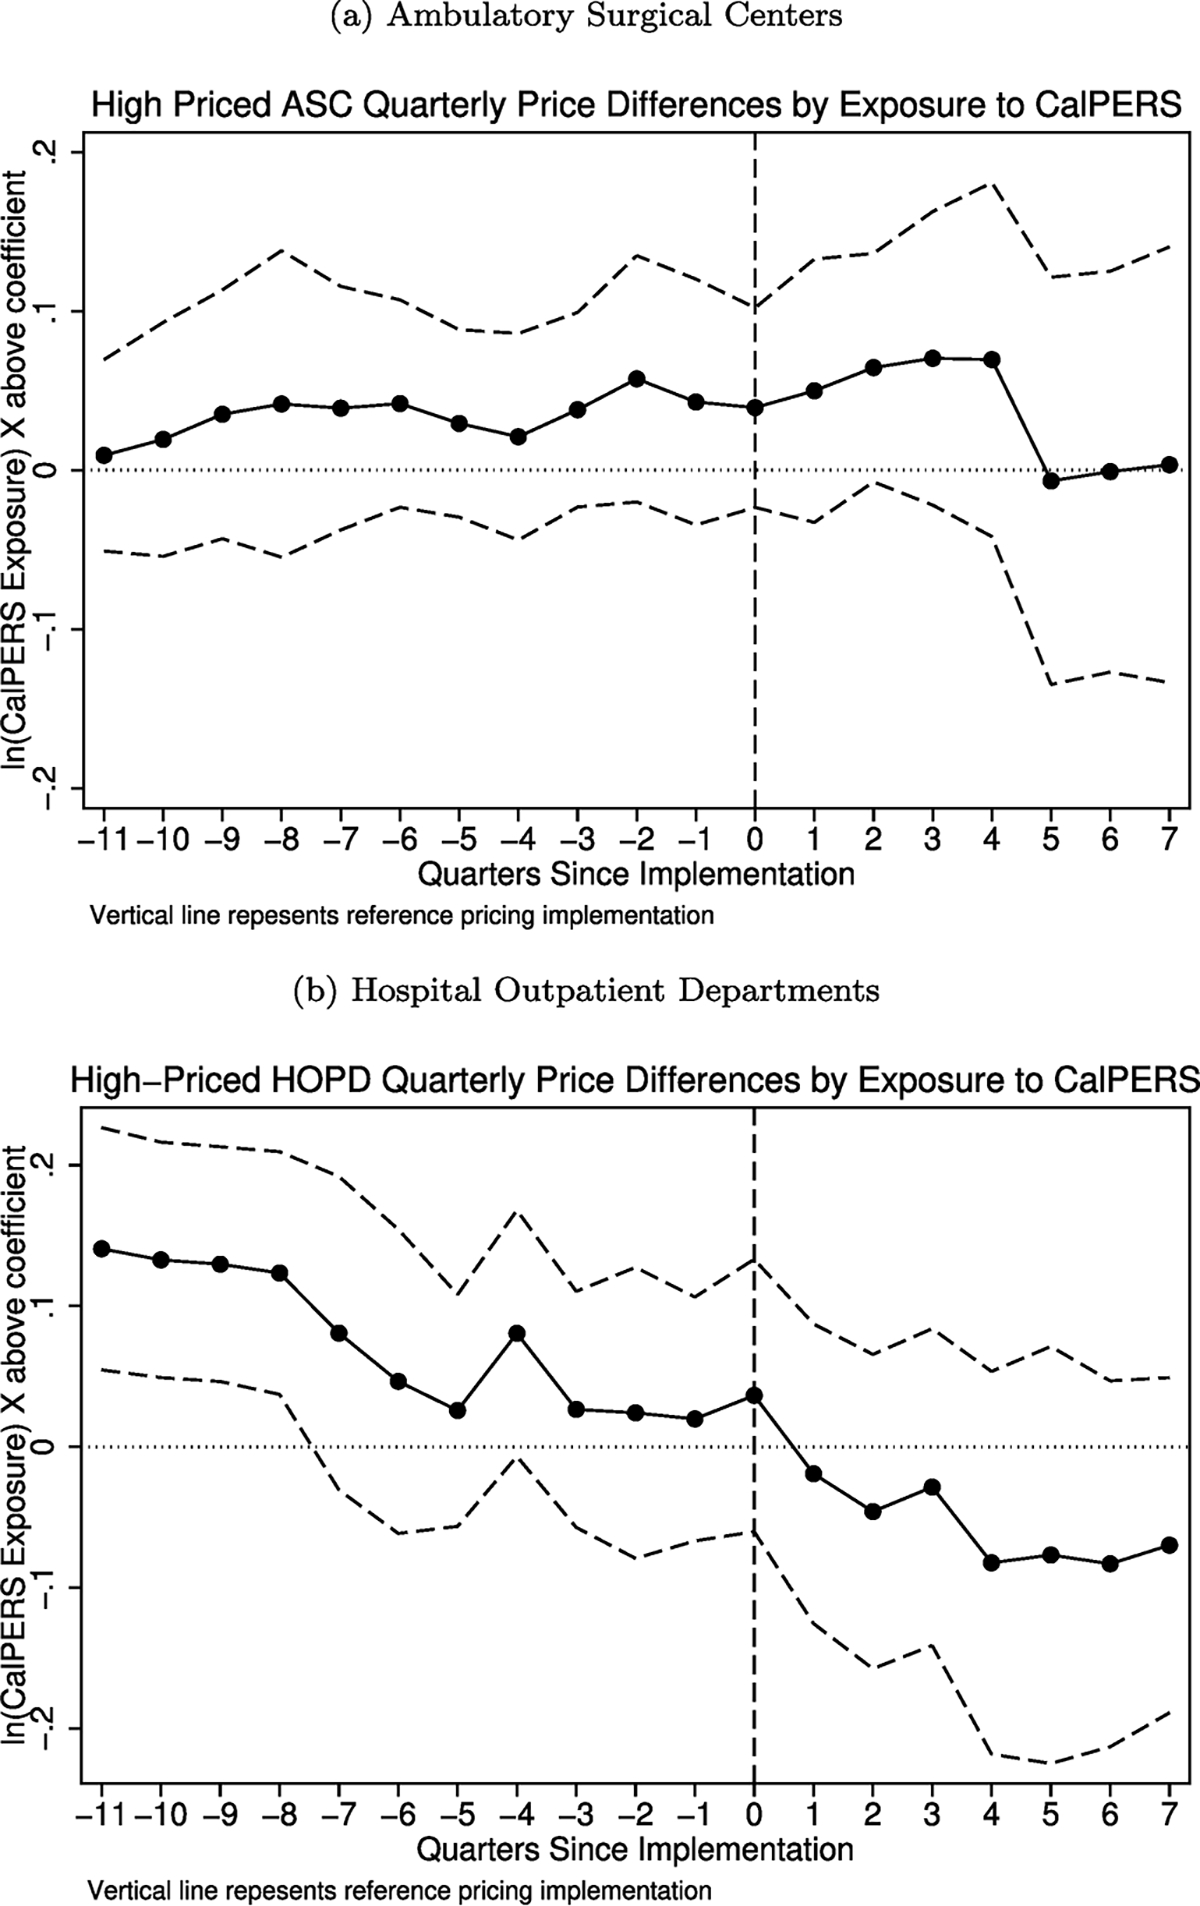
This paper examines how health care providers respond to a reference pricing insurance program that increases consumer cost sharing when consumers choose high-priced surgical providers. We use geographic variation in the population covered by the program to estimate supply-side responses. We find limited evidence of market segmentation and price reductions for providers with baseline prices above the reference price. Finally, approximately 75% of the reduction in provider prices is in the form of a positive externality that benefits a population not subject to the program.
Keywords: Health care markets; Provider prices; Reference pricing.
Copyright © 2018 Elsevier B.V. All rights reserved.
Figures

Similar articles
-
Managing imperfect competition by pay for performance and reference pricing.J Health Econ. 2018 Jan;57:131-146. doi: 10.1016/j.jhealeco.2017.11.002. Epub 2017 Nov 5. J Health Econ. 2018. PMID: 29274520
-
Healthcare payment incentives: a comparative analysis of reforms in Taiwan, South Korea and China.Appl Health Econ Health Policy. 2004;3(1):47-56. doi: 10.2165/00148365-200403010-00009. Appl Health Econ Health Policy. 2004. PMID: 15702940
-
Reference Pricing Changes The 'Choice Architecture' Of Health Care For Consumers.Health Aff (Millwood). 2017 Mar 1;36(3):524-530. doi: 10.1377/hlthaff.2016.1256. Health Aff (Millwood). 2017. PMID: 28264955 Free PMC article.
-
Impact of European pharmaceutical price regulation on generic price competition: a review.Pharmacoeconomics. 2010;28(8):649-63. doi: 10.2165/11535360-000000000-00000. Pharmacoeconomics. 2010. PMID: 20515079 Review.
-
Reference pricing of pharmaceuticals for Medicare: evidence from Germany, The Netherlands, and New Zealand.Front Health Policy Res. 2004;7:1-54. doi: 10.2202/1558-9544.1050. Front Health Policy Res. 2004. PMID: 15612334 Review.
Cited by
-
The Effects of Physician Vertical Integration on Referral Patterns, Patient Welfare, and Market Dynamics.J Public Econ. 2024 Oct;238:105175. doi: 10.1016/j.jpubeco.2024.105175. Epub 2024 Jul 25. J Public Econ. 2024. PMID: 39099735
-
Long-run growth of ambulatory surgery centers 1990-2015 and Medicare payment policy.Health Serv Res. 2022 Feb;57(1):66-71. doi: 10.1111/1475-6773.13707. Epub 2021 Jul 27. Health Serv Res. 2022. PMID: 34318499 Free PMC article.
-
Does managed competition constrain hospitals' contract prices? Evidence from the Netherlands.Health Econ Policy Law. 2020 Jul;15(3):341-354. doi: 10.1017/S1744133119000215. Epub 2019 Apr 11. Health Econ Policy Law. 2020. PMID: 30973119 Free PMC article.
-
Treatment consolidation after vertical integration: Evidence from outpatient procedure markets.J Health Econ. 2022 Jan;81:102569. doi: 10.1016/j.jhealeco.2021.102569. Epub 2021 Nov 27. J Health Econ. 2022. PMID: 34911008 Free PMC article.
-
Is physician location sensitive to changes in patients' financial responsibility?J Appl Econ. 2022;25(1):280-299. doi: 10.1080/15140326.2022.2041158. Epub 2022 Mar 9. J Appl Econ. 2022. PMID: 37008990 Free PMC article.
References
-
- Aouad M, Brown TT, Whaley C, 2018a. Quantile Treatment Effects of Reference Pricing. Working Paper. University of California, Berkeley.
-
- Barro JR, Huckman RS, Kessler DP, 2006. The effects of cardiac specialty hospitals on the cost and quality of medical care. J. Health Econ. 25 (4), 702–721. - PubMed
-
- Beeuwkes Buntin M, Haviland AM, McDevitt R, Sood N, 2011. Health-care spending and preventive care in high-deductible and consumer-directed health plans. Am. J. Manag. Care 17 (3), 222–230. - PubMed
Publication types
MeSH terms
Grants and funding
LinkOut - more resources
Full Text Sources
Other Literature Sources
Medical
