

doi: 10.1364/OE.26.014859.
Ultra-sensitive mid-infrared emission spectrometer with sub-ns temporal resolution
- PMID: 30114791
- PMCID: PMC11376500
- DOI: 10.1364/OE.26.014859
Item in Clipboard
Ultra-sensitive mid-infrared emission spectrometer with sub-ns temporal resolution
Opt Express.
.
Abstract
We evaluate the performance of a mid-infrared emission spectrometer operating at wavelengths between 1.5 and 6 μm based on an amorphous tungsten silicide (a-WSi) superconducting nanowire single-photon detector (SNSPD). We performed laser induced fluorescence spectroscopy of surface adsorbates with sub-monolayer sensitivity and sub-nanosecond temporal resolution. We discuss possible future improvements of the SNSPD-based infrared emission spectrometer and its potential applications in molecular science.
Figures
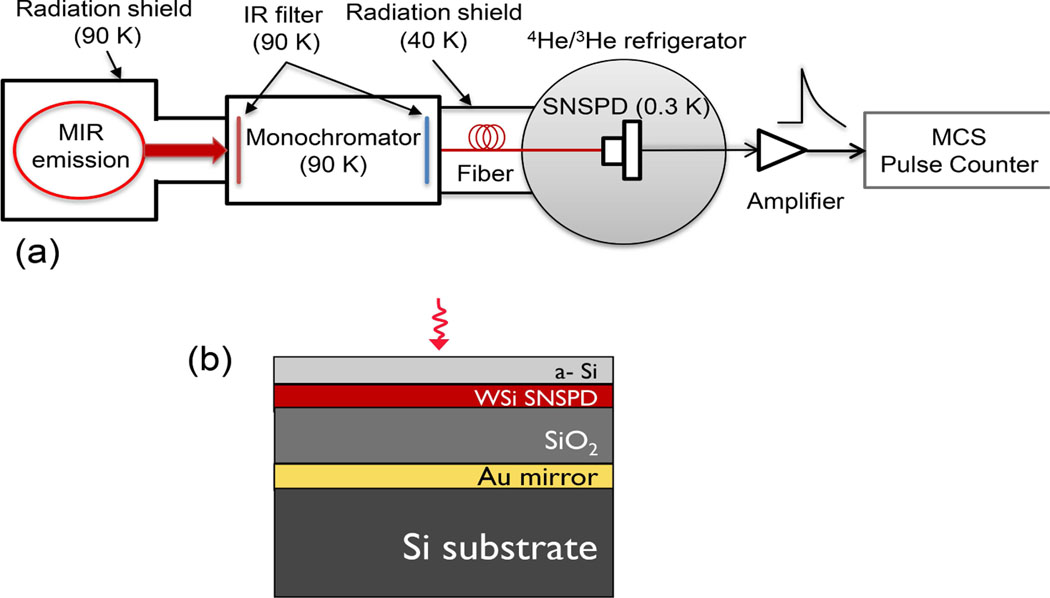
(a) Schematic of the infrared emission spectrometer equipped with a WSi SNSPD; (b) Optical stack of the WSi SNSPD. From top to bottom, 2.5-nm-thick amorphous silicon (a-Si), 3.5-nm-thick and 100-nm-wide WSi, 480-nm-thick SiO2 and 80-nm-thick gold. The fabricated WSi nanowire has a superconducting transition temperature of Tc ~2.5 K, and a resistance of 3 MΩ.
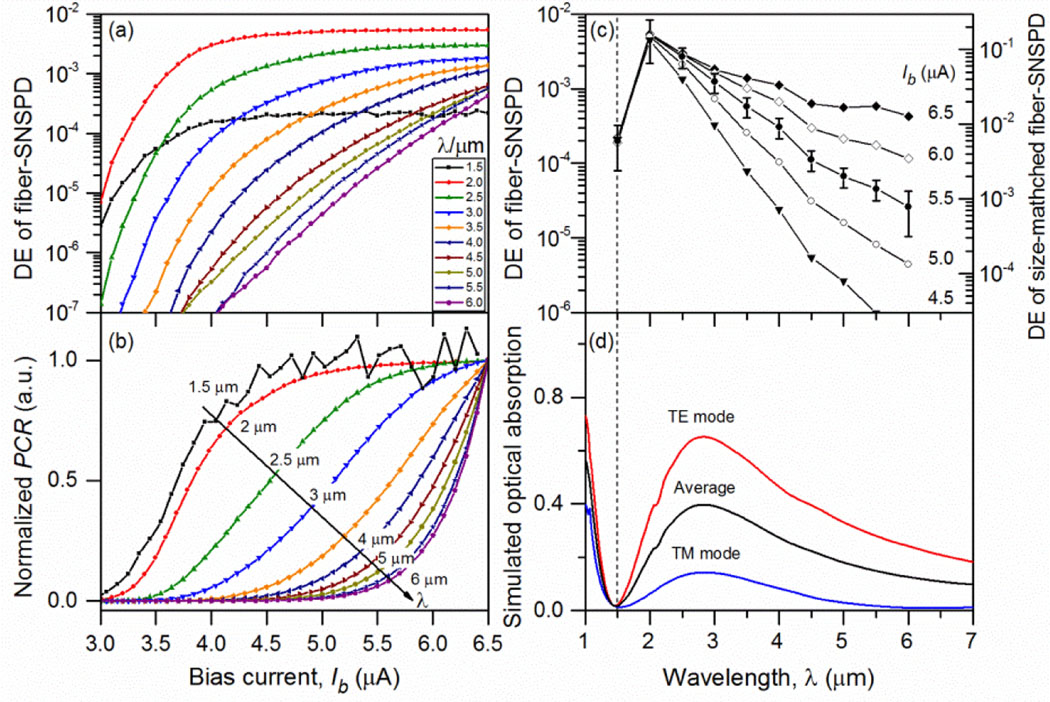
Detection efficiency (DE) of the fiber-SNSPD assembly. (a) Wavelength-dependent bias current () scans of DE at ; the switch current is ; (b) Normalized spectrum response of the WSi SNSPD plotted on a linear scale to illustrate the plateau in DE. At each wavelength, the measured scan curve is normalized to the photon counting rate (PCR) at . The 1.5 μm curve is noisy because of the low photon flux and the low system detection efficiency; (c) Wavelength-dependent DE obtained from data in Fig. 2(a) at several fixed . The error bars are only shown for data for clarity. The relative errors are in the range of 30%–50%, estimated based on uncertainties of the relative globar light intensity, the grating efficiency, and the SNSPD PCR measurements. The right-y axis shows the QE value when the size is matched between the SNSPD and the fiber, which results in 30 times higher fiber-coupling efficiency; (d) Wavelength-dependent optical absorption of the WSi SNSPD simulated based on parameters of the optical stack described in Fig. 1(b). The black absorption curve is the average of the TE mode (red curve) and TM mode (blue curve) absorption curves.
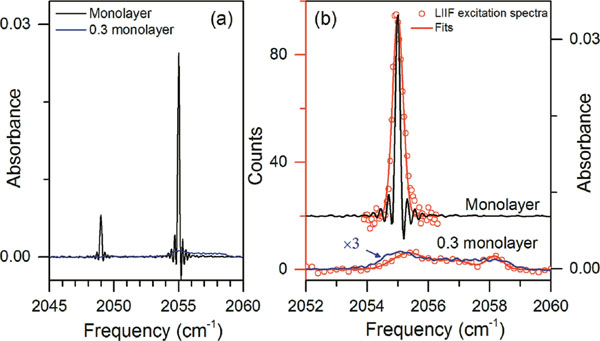
Infrared spectroscopy of a monolayer and a sub-monolayer (~0.3 monolayer) sample of 13C18O on NaCl (100) at . (a) FTIR absorption spectra in the fundamental transition region; (b) LIIF excitation spectra (red circle points). Here, the total first overtone fluorescence was measured with the monochromator grating replaced by a gold mirror. The red solid lines are a Gaussian peak fit for the monolayer spectrum and an empirical multiple-Gaussian peak fit for the submonolayer spectrum. For the submonolayer and monolayer spectra data 1000 laser shots (ca. 1.7 minutes) and 100 laser shots (10 seconds) were averaged, respectively. The signal integration time window was 0.05–1.05 ms and the SNSPD bias current was 4 μA. The same FTIR spectra shown in (a) are overlapped for comparison.
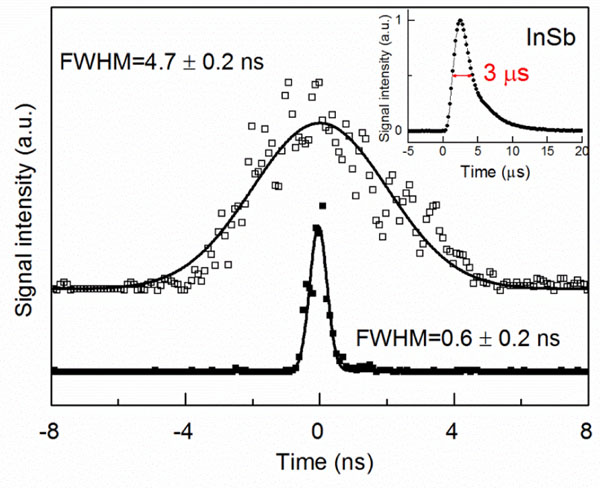
Temporal profiles obtained with the WSi SNSPD illuminated by scattered light pulses from a nanosecond (empty squares) and a picosecond laser (filled squares). Both lasers emit at . The laser intensities were heavily attenuated so that much less than one photon per pulse was detected. The measured laser profiles (100 ps/point) are fitted with Gaussians (black solid lines) to yield the FWHM values. The picosecond laser pulse has a specified FWHM ≈30 ps. The inset graph shows the response time of the InSb detector to the scattered nanosecond laser pulse.
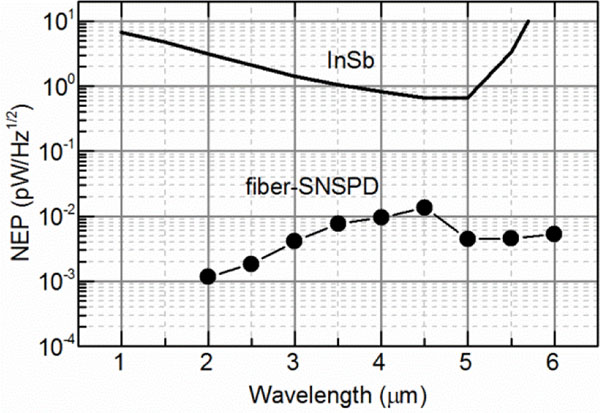
Calculated NEP (filled circles) of the fiber-coupled SNSPD detection system (see text) with at wavelengths between 2 and 6 μm. The solid curve is the typical NEP level of a commercial liquid-nitrogen-cooled InSb detector (Teledyne Judson [27]) with an active detector size of dia. 1mm.
References
-
- Gravrand O, Rothman J, Castelein P, Cervera C, Baier N, Lobre C, De Borniol E, Zanatta JP, Boulade O, Moreau V, Fieque B, and Chorier P, “Latest achievements on MCT IR detectors for space and science imaging,” in Infrared Technology and Applications Xlii, Andresen BF, Fulop GF, Hanson CM, and Norton PR, eds. (2016).
-
- Dam JS, Tidemand-Lichtenberg P, and Pedersen C, “Room-temperature mid-infrared single-photon spectral imaging,” Nat. Photonics 6(11), 788–793 (2012).
-
- Eisaman MD, Fan J, Migdall A, and Polyakov SV, “Invited Review Article: Single-photon sources and detectors,” Rev. Sci. Instrum 82(7), 071101 (2011). - PubMed
-
- Gol’tsman GN, Okunev O, Chulkova G, Lipatov A, Semenov A, Smirnov K, Voronov B, Dzardanov A, Williams C, and Sobolewski R, “Picosecond superconducting single-photon optical detector,” Appl. Phys. Lett 79(6), 705–707 (2001).
-
- Natarajan CM, Tanner MG, and Hadfield RH, “Superconducting nanowire single-photon detectors: physics and applications,” Supercond Sci Tech 25 (2012).
Grants and funding
LinkOut - more resources
Full Text Sources
Other Literature Sources
Miscellaneous
