

Cerebrospinal fluid synaptosomal-associated protein 25 is a key player in synaptic degeneration in mild cognitive impairment and Alzheimer's disease
- PMID: 30115118
- PMCID: PMC6097333
- DOI: 10.1186/s13195-018-0407-6
Cerebrospinal fluid synaptosomal-associated protein 25 is a key player in synaptic degeneration in mild cognitive impairment and Alzheimer's disease
Abstract
Background: There is accumulating evidence that synaptic loss precedes neuronal loss and correlates best with impaired memory formation in Alzheimer's disease (AD). Cerebrospinal fluid (CSF) synaptosomal-associated protein 25 (SNAP-25) is a newly discovered marker indicating synaptic damage. We here test CSF SNAP-25 and SNAP-25/amyloid-β42 (Aβ42) ratio as a diagnostic marker for predicting cognitive decline and brain structural change in the Alzheimer's Disease Neuroimaging Initiative (ADNI) database.
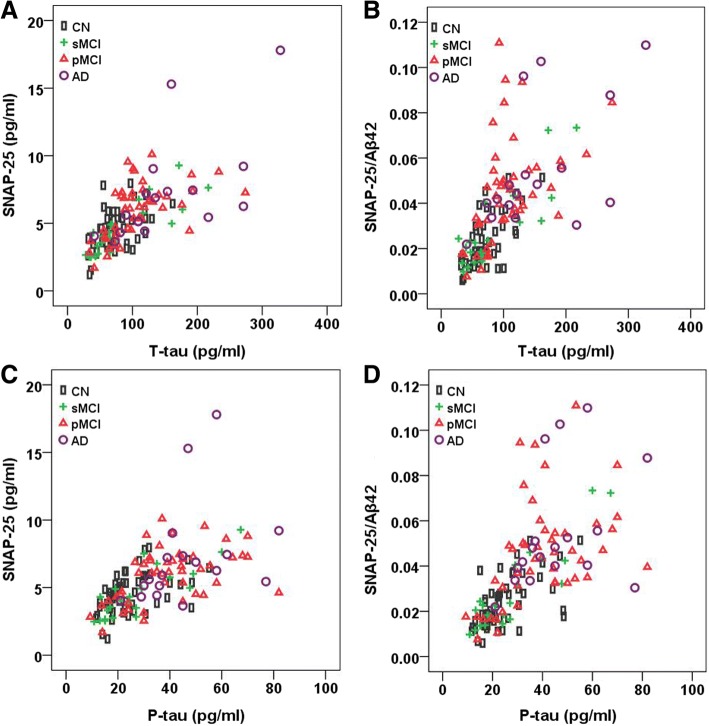
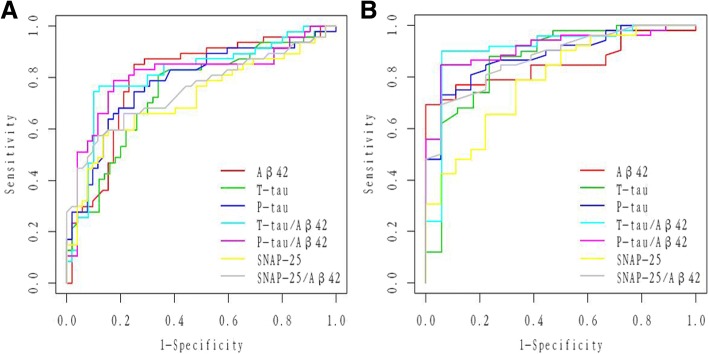
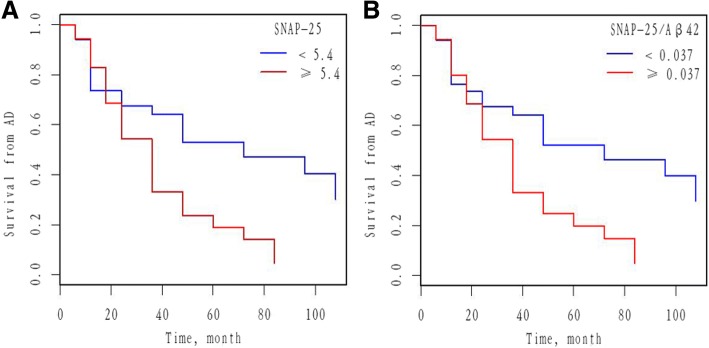
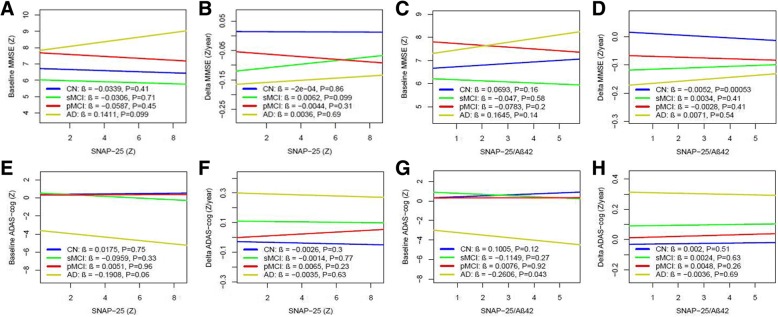
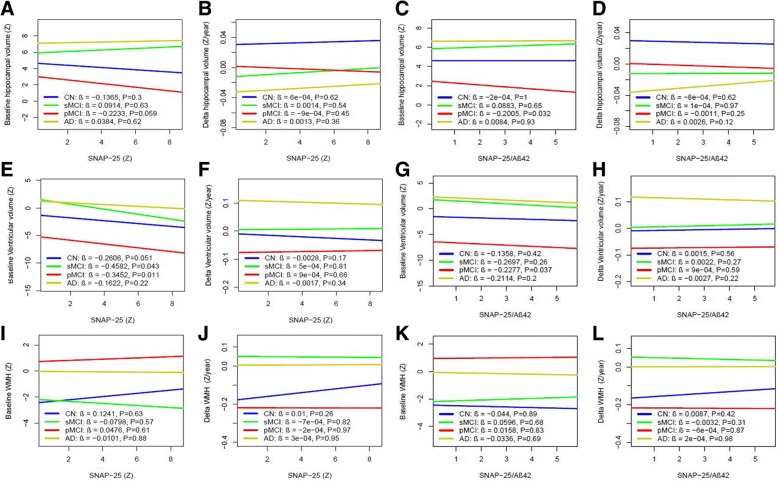
Methods: We stratified 139 participants from the ADNI database into cognitively normal (CN; n = 52), stable mild cognitive impairment (sMCI; n = 22), progressive MCI (pMCI; n = 47), and dementia due to AD (n = 18). Spearman correlation was performed to test the relationships between biomarkers. Overall diagnostic accuracy (area under the curve (AUC)) was obtained from receiver operating curve (ROC) analyses. Cox proportional hazard models tested the effect of CSF SNAP-25 and SNAP-25/Aβ42 measures on the conversion from MCI to AD. Relationships between the CSF SNAP-25 levels, SNAP-25/Aβ42 ratio, and diagnostic groups were tested with linear regressions. Linear mixed-effects models and linear regression models were used to evaluate CSF SNAP-25 and SNAP-25/Aβ42 as predictors of AD features, including cognition measured by the Mini-Mental State Examination (MMSE) and brain structure and white matter hyperintensity (WMH) measured by magnetic resonance imaging (MRI).
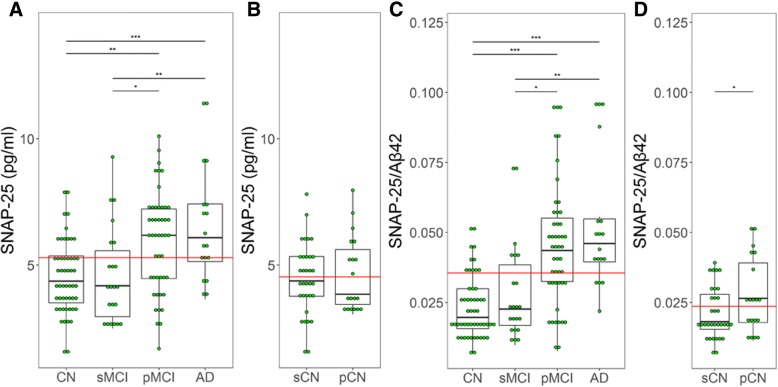
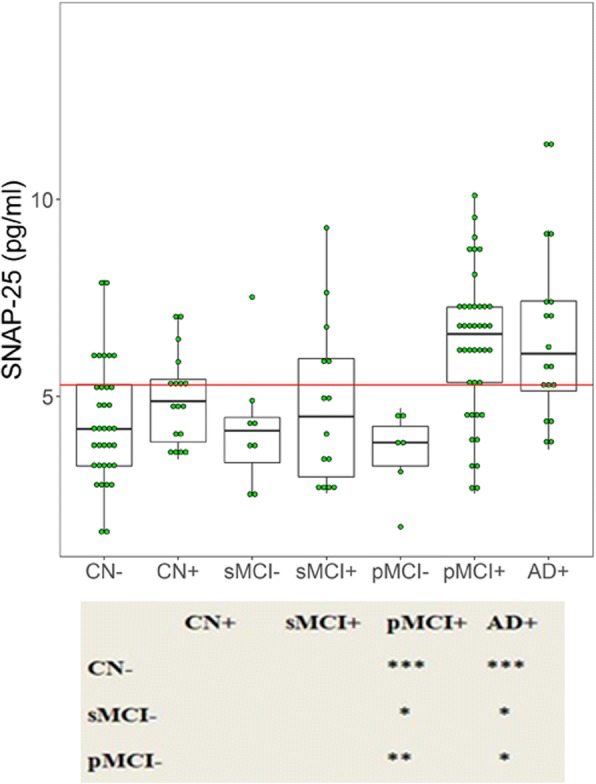
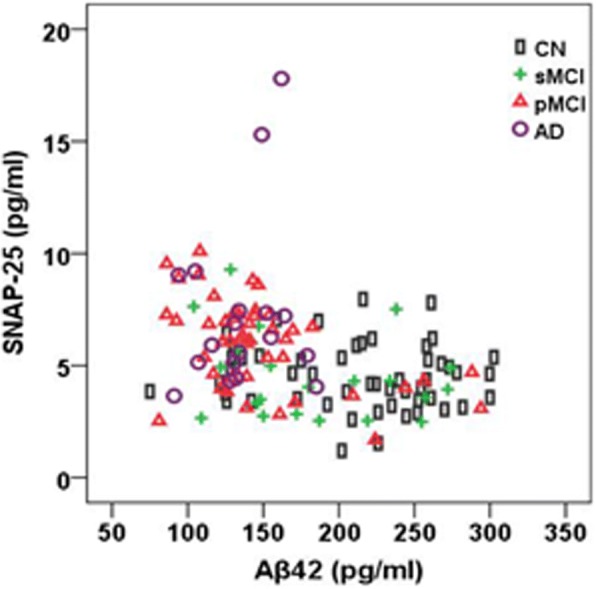
Results: CSF SNAP-25 and SNAP-25/Aβ42 were increased in patients with pMCI and AD compared with CN, and in pMCI and AD compared with sMCI. Cognitively normal subjects who progressed to MCI or AD during follow-up had increased SNAP-25/Aβ42 ratio compared with nonprogressors. CSF SNAP-25, especially SNAP-25/Aβ42, offers diagnostic utility for pMCI and AD. CSF SNAP-25 and SNAP-25/Aβ42 significantly predicted conversion from MCI to AD. In addition, elevated SNAP-25/Aβ42 ratio was associated with the rate of hippocampal atrophy in pMCI and the rate of change of cognitive impairment in CN over the follow-up period.
Conclusions: These data suggest that both CSF SNAP-25 and SNAP-25/Aβ42 ratio are already increased at the early clinical stage of AD, and indicate the promise of CSF SNAP-25 and SNAP-25/Aβ42 ratio as diagnostic and prognostic biomarkers for the earliest symptomatic stage of AD.
Keywords: Alzheimer’s disease; Amyloid-β; Synaptic loss; Synaptosomal-associated protein 25.
Conflict of interest statement
Ethics approval and consent to participate
The ADNI study was approved by the Institutional Review Boards of all the participating institutions. Informed written consent was obtained from all subjects at each center.
Consent for publication
All authors approved the final manuscript for submission and gave consent for publication.
Competing interests
The authors declare that they have no competing interests.
Publisher’s Note
Springer Nature remains neutral with regard to jurisdictional claims in published maps and institutional affiliations.
Figures
Similar articles
-
Choroid plexus volume as a novel candidate neuroimaging marker of the Alzheimer's continuum.Alzheimers Res Ther. 2024 Jul 3;16(1):149. doi: 10.1186/s13195-024-01520-w. Alzheimers Res Ther. 2024. PMID: 38961406 Free PMC article.
-
Concordance and Diagnostic Accuracy of [11C]PIB PET and Cerebrospinal Fluid Biomarkers in a Sample of Patients with Mild Cognitive Impairment and Alzheimer's Disease.J Alzheimers Dis. 2015;45(4):1077-88. doi: 10.3233/JAD-142952. J Alzheimers Dis. 2015. PMID: 25649653
-
Osteopontin: A novel marker of pre-symptomatic sporadic Alzheimer's disease.Alzheimers Dement. 2024 Sep;20(9):6008-6031. doi: 10.1002/alz.14065. Epub 2024 Jul 28. Alzheimers Dement. 2024. PMID: 39072932 Free PMC article.
-
2014 Update of the Alzheimer's Disease Neuroimaging Initiative: A review of papers published since its inception.Alzheimers Dement. 2015 Jun;11(6):e1-120. doi: 10.1016/j.jalz.2014.11.001. Alzheimers Dement. 2015. PMID: 26073027 Free PMC article. Review.
-
Advantages and disadvantages of the use of the CSF Amyloid β (Aβ) 42/40 ratio in the diagnosis of Alzheimer's Disease.Alzheimers Res Ther. 2019 Apr 22;11(1):34. doi: 10.1186/s13195-019-0485-0. Alzheimers Res Ther. 2019. PMID: 31010420 Free PMC article. Review.
Cited by
-
Plasma vesicle-associated membrane protein 2 and glial fibrillary acidic protein associate with synaptic density in older adults without dementia.Brain Commun. 2025 May 27;7(4):fcaf207. doi: 10.1093/braincomms/fcaf207. eCollection 2025. Brain Commun. 2025. PMID: 40620474 Free PMC article.
-
Fluid Biomarkers for Synaptic Dysfunction and Loss.Biomark Insights. 2020 Aug 21;15:1177271920950319. doi: 10.1177/1177271920950319. eCollection 2020. Biomark Insights. 2020. PMID: 32913390 Free PMC article. Review.
-
Increased levels of the synaptic proteins PSD-95, SNAP-25, and neurogranin in the cerebrospinal fluid of patients with Alzheimer's disease.Alzheimers Res Ther. 2022 Apr 23;14(1):58. doi: 10.1186/s13195-022-01002-x. Alzheimers Res Ther. 2022. PMID: 35461266 Free PMC article.
-
Cerebrospinal Fluid Biomarkers of Alzheimer's Disease: Current Evidence and Future Perspectives.Brain Sci. 2021 Feb 10;11(2):215. doi: 10.3390/brainsci11020215. Brain Sci. 2021. PMID: 33578866 Free PMC article. Review.
-
Serial Cerebrospinal Fluid Sampling Reveals Trajectories of Potential Synaptic Biomarkers in Early Stages of Alzheimer's Disease.J Alzheimers Dis. 2024;100(s1):S103-S114. doi: 10.3233/JAD-240610. J Alzheimers Dis. 2024. PMID: 39121126 Free PMC article.
References
-
- Furuya TK, Silva PN, Payao SL, Bertolucci PH, Rasmussen LT, De Labio RW, Braga IL, Chen ES, Turecki G, Mechawar N, Mill J, Smith MA. Analysis of SNAP25 mRNA expression and promoter DNA methylation in brain areas of Alzheimer's disease patients. Neuroscience. 2012;220:41–46. doi: 10.1016/j.neuroscience.2012.06.035. - DOI - PubMed
Publication types
MeSH terms
Substances
Grants and funding
LinkOut - more resources
Full Text Sources
Other Literature Sources
Medical
