. 2018 Aug 17;19(1):112.
doi: 10.1186/s13059-018-1475-4.

Optical and physical mapping with local finishing enables megabase-scale resolution of agronomically important regions in the wheat genome

Affiliations

Optical and physical mapping with local finishing enables megabase-scale resolution of agronomically important regions in the wheat genome

Gabriel Keeble-Gagnère et al. Genome Biol. .

Abstract

Background: Numerous scaffold-level sequences for wheat are now being released and, in this context, we report on a strategy for improving the overall assembly to a level comparable to that of the human genome.

Results: Using chromosome 7A of wheat as a model, sequence-finished megabase-scale sections of this chromosome were established by combining a new independent assembly using a bacterial artificial chromosome (BAC)-based physical map, BAC pool paired-end sequencing, chromosome-arm-specific mate-pair sequencing and Bionano optical mapping with the International Wheat Genome Sequencing Consortium RefSeq v1.0 sequence and its underlying raw data. The combined assembly results in 18 super-scaffolds across the chromosome. The value of finished genome regions is demonstrated for two approximately 2.5 Mb regions associated with yield and the grain quality phenotype of fructan carbohydrate grain levels. In addition, the 50 Mb centromere region analysis incorporates cytological data highlighting the importance of non-sequence data in the assembly of this complex genome region.

Conclusions: Sufficient genome sequence information is shown to now be available for the wheat community to produce sequence-finished releases of each chromosome of the reference genome. The high-level completion identified that an array of seven fructosyl transferase genes underpins grain quality and that yield attributes are affected by five F-box-only-protein-ubiquitin ligase domain and four root-specific lipid transfer domain genes. The completed sequence also includes the centromere.

Keywords: Megabase-scale integration; Optical/physical maps Grain quality; Wheat sequence finishing; Yield.


Conflict of interest statement

Competing interests

PR, SB, and M-AN have competing commercial interests as employees and stockholders of Gydle, which is a commercial company that provides bioinformatics analysis software and services. This does not alter the authors’ adherence to all of the Genome Biology policies on sharing data and materials. The remaining authors declare that they have no competing interests.

Publisher’s Note

Springer Nature remains neutral with regard to jurisdictional claims in published maps and institutional affiliations.

Figures

Fig. 1
Fig. 1
Gydle assembly (top tracks) aligned to the IWGSC RefSeq v1.0 chromosome 7A pseudomolecule (bottom tracks, see [1]) at positions 14.5 - 17.2 Mb. The top two tracks show BAC pools 7AS-11848, 7AS-11877 and 7AS-00257 aligned to Bionano maps 7AS_0072 and 7AS_0036. The BAC pool assemblies are finished with no gaps or ambiguities and have resolved repeat arrays which are collapsed in the IWGSC RefSeq v1.0 assembly. Depending on the coverage of BACs, regions of the IWGSC RefSeq v1.0 assembly are either covered by a single BAC pool, covered by multiple BAC pools (such as the 30 Kb of overlap between 7AS-11848 and 7AS-11877) or not covered by any BAC pool (such as between 7AS-11877 and 7AS-00257). The Gydle assembly increased the assembled sequence length by a total of 169 Kb across the region covered by these three pools (approximately 8%)
Fig. 2
Fig. 2
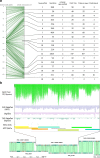
a Alignment of MAGIC/CSxRenan genetic map (left axis, Additional file 2b) against IWGSC RefSeq v1.0 chromosome 7A (right axis). On the right axis, ticks denote the boundaries of the 18 super-scaffolds defined in this manuscript. The table summarizes the assembly information integrated in each super-scaffold (see also Additional files 4b and 5). Some cross-overs in the alignment of the MAGIC and IWGSC genetic maps reflect ambiguities that can arise as a result of the high and distributed repetitive sequence content of the wheat genome combined with the fact that the MAGIC map is based on a multiple cross between 8 modern varieties and the physical map is Chinese Spring. In some cases the map suggested no linkage between markers located in a physical contig. If re-examination of the physical contig indicated a ‘weak link’ in the physical contig assembly (example shown in Additional file 8: Figure S3), then the assembly was split into ‘a’ and ‘b’ contigs. If the physical contig evidence was unambiguous, the markers were set aside for reconsideration in light of more evidence being obtained. b An example of a locally finished sequence (BAC pool 7AS-11826; 655 Kb) showing integration of multiple data types: paired-end Illumina data from BACs (top, green); three independent mate-pair libraries; Minimum tiling path (MTP) BAC start and end points, based on mapping junction with vector; Bionano optical map alignments. Note that coverage of BAC pool data varies depending on double and triple coverage of BACs in MTP. Sequence is contiguous with no gaps. The assembled sequence joined two Bionano maps. This 655 Kb contig included the P450 gene, TaCYP78A3, shown to be associated with variation in grain size [48]
Fig. 3
Fig. 3
Detail of local region associated with fructan content. a The 7AS island containing 7AS-11582. b Optical maps (7AS-0064 and 7AS-0049) aligned against the finished sequence for 7AS-11582. c Finished Gydle sequence for 7AS-11582 (top) with alignments of matching contigs/scaffolds from IWGSC RefSeq v1.0 (orange), TGAC (cyan) and PacBio (yellow) assemblies. Gaps are indicated by white space between HSPs and differences by black bars. Vertical pink links indicate regions of the finished sequence not present in any other assembly
Fig. 4
Fig. 4
Gydle island containing the core yield region (defined by blue dotted lines, coordinates 671,200,000–675,300,000 bp). Assembled Gydle stage 2 sequences (orange, stage 2 with the genome segments based on BAC pools) aligned to Bionano maps (horizontal blue bars) in the top panel. The genome sequence within the bold dotted blue box in the top panel is the stage 3, finished, genome sequence region. The lower panel displays pairwise LD values (D’, [37]) between a total of 203 gene-based SNPs in same region across 863 diverse bread wheat accessions. Only common SNPs with high minor allele frequency (MAF > 0.3) are shown because common SNPs have high ability to define extent of LD and historical recombination patterns in diverse collections. The SNPs present within 2000 bp on either side of gene were included in this analysis. Color code: Bright red D’ = 1.0 and LOD > 2.0 (high LD); light shades of red indicate D’ < 1.0 and LOD > 2.0 (low-medium LD); white indicates D’ < 1.0 and LOD < 2.0 (no LD or complete decay)
Fig. 5
Fig. 5
a The 7A centromere. The top panel shows cross-over counts from an analysis of 900 lines (only cross-overs from 465 lines shown; see Additional file 1) of a MAGIC population (10 Mb bin size) across the entire chromosome and identifies a region of zero recombination traditionally associated with the centromere. The second panel shows this region is the primary location of the Cereba TEs that define wheat centromeres. Within this region we also identified a compact cluster of Tai 1 sequence elements shown in red. The third panel indicates the location of the breakpoints that generated the 7AS and 7AL telosomes, and the bottom panel shows the Gydle islands (sequences in orange) and Bionano maps (7AS in green, 7AL in blue) for this region tiling the IWGSC RefSeq v1.0 (gray) from 340 Mb to 370 Mb. The break in both the Gydle and Bionano maps in the 349 Mb region is referenced in the text as well as Fig. 6a as a possible location of CENH3 binding sites. b The 7A centromere aligned to rice chromosome 8. Lines indicate syntenic genes, with conserved gene models between the two centromere regions highlighted in blue. Equivalent locations of the CENH3 binding sequences shown on the right and left sides. The CENH3 plot for the rice 8 centromere (right side) was modified from Yan et al. [26]
Fig. 6
Fig. 6
IWGSC RefSeq v1.0 chromosome 7A 338 Mb to 388 Mb region. a Dotplot of 338 Mb to 388 Mb region against the 10 Mb between 358 Mb and 368 Mb and indicates two regions (blue boxes) that are speculated to be integral to the centromere structure and involved in in situ CENH3 protein-antibody binding (Additional file 8: Figure S6); the left box at ca. 349 Mb is suggested to have an incomplete genome assembly due to a breakdown in the assembly process as indicated in Fig. 5a (lower panel), since both the Gydle and Bionano maps have breaks in the 349 Mb region. b ChIP-seq CENH3 data (SRA accessions SRR1686799 and SRR1686800) aligned to the 338 Mb to 388 Mb region, counted in 10 Kb bins. c Raw CSS reads of 7AS (SRA accession SRR697723) aligned to the 338 Mb to 388 Mb region (see also Additional file 8: Figure S7). d Raw CSS reads of 7AL (SRA accession SRR697675) aligned to the 338 Mb to 388 Mb region (see also Additional file 8: Figure S7). The dotted blue box indicates a segment of the 7AL centromere that is duplicated as discussed in the text. Unique alignments are shown in blue in both c and d and show the clear boundaries of 7AS and 7AL telosomes as well as a deletion in the 7AL telosome. Reads with multiple mapped locations are shown in red (single location selected randomly) and indicate that the core CRW region is represented in the raw 7AS reads, although at lower levels than on 7AL. Counts in bins of 100 Kb

References

    1. The International Wheat Genome Sequencing Conosrtium. Shifting the limits in wheat research and breeding through a fully annotated and anchored reference genome sequence. Science. 2018. 10.1126/science.aar7191. - PubMed
    1. The International Wheat Genome Sequencing Consortium A chromosome-based draft sequence of the hexaploid bread wheat (Triticum aestivum) genome. Science. 2014;345:1251788. doi: 10.1126/science.1251788. - DOI - PubMed
    1. Clavijo BP, Kettleborough G, Heavens D, Chapman H, Lipscombe J, Barker T, Lu F-H, McKenzie N, Raats D, Ramirez-Gonzalez RH, Coince A, Peel N, Percival-Alwyn L, Duncan O, Trösch J, Yu G, Bolser DM, Namaati G, Kerhornou A, Spannagl M, Gundlach H, Haberer G, Davey RP, Fosker C, Di Palma FD, Phillips AL, Millar AH, Kersey PJ, Uauy C, Krasileva KW, Swarbreck D, Bevan MW, Clark MD. An improved assembly and annotation of the allohexaploid wheat genome identifies complete families of agronomic genes and provides genomic evidence for chromosomal translocations. Genome Res. 2017;27:885–896. doi: 10.1101/gr.217117.116. - DOI - PMC - PubMed
    1. Zimin AV, Puiu D, Hall R, Kingan S, Salzberg SL (2017), The first near-complete assembly of the hexaploid bread wheat genome, Triticum aestivum. GigaScience;6:1–7. - PMC - PubMed
    1. Eversole K, Rogers J, Keller B, Appels R, Feuillet C. Achieving sustainable cultivation of wheat, Part 1, Chap. 2. Cambridge: Burleigh-Dodds Science Publishing; 2017. Sequencing and assembly of the wheat genome.

Publication types