Review
. 2018 Sep;47(3):515-536.
doi: 10.1016/j.gtc.2018.04.004. Epub 2018 Jun 29.

The Natural History of Colorectal Polyps: Overview of Predictive Static and Dynamic Features

Affiliations
Review

The Natural History of Colorectal Polyps: Overview of Predictive Static and Dynamic Features

Perry J Pickhardt et al. Gastroenterol Clin North Am. 2018 Sep.

Abstract

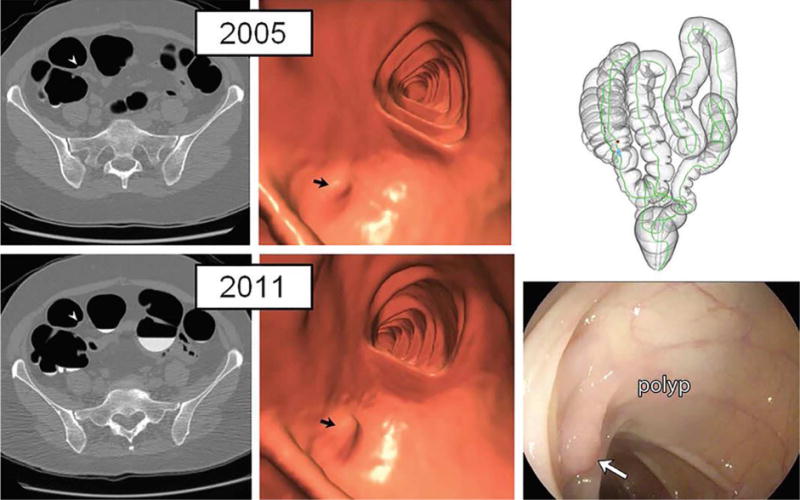
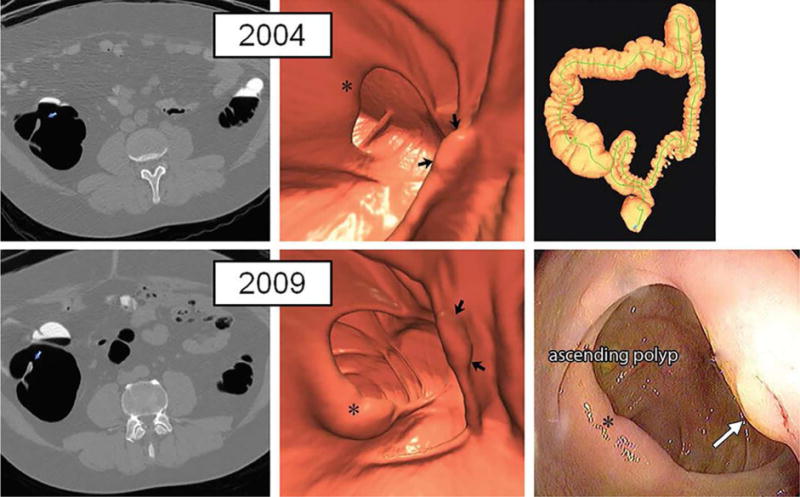
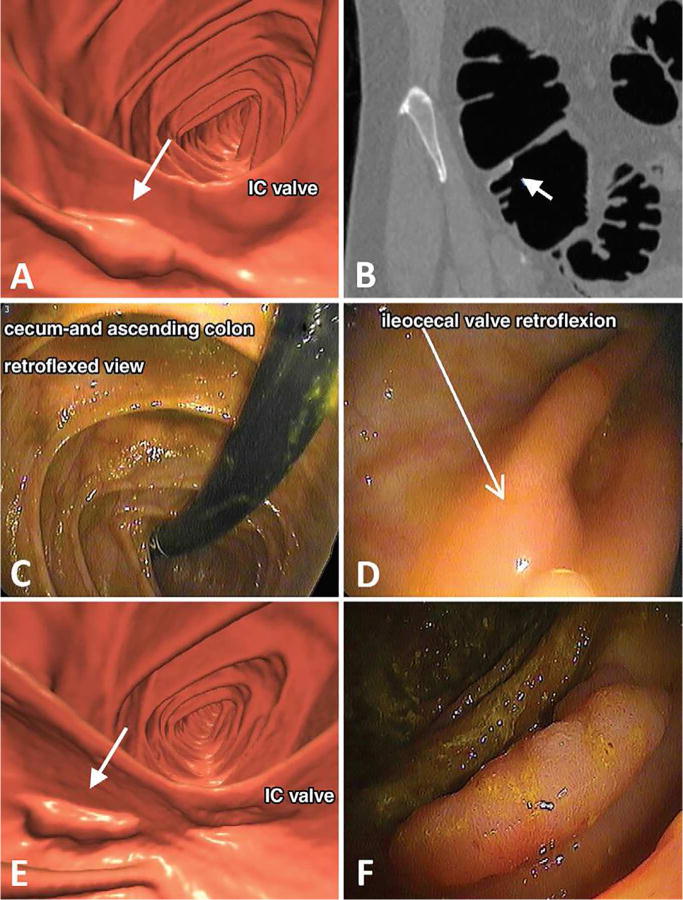
For decades, colorectal screening strategies have been largely driven by static features, particularly polyp size. Although cross-sectional features of polyp size, morphology, and location are important determinants of clinical relevance before histology, they lack any dynamic information on polyp growth rates. Computed tomography colonography allows for in vivo surveillance of colorectal polyps, providing volumetric growth rates that are providing new insights into tumorigenesis. In this article, existing cross-sectional and longitudinal data on colorectal polyps are reviewed, with an emphasis on how these features may affect clinical relevance and patient management.

Keywords: CT colonography; Colorectal cancer; Colorectal polyps; Optical colonoscopy; Virtual colonoscopy.


Figures

Figure 1
Figure 1. Carpet lesions (flat superficially spreading tumors)
Three-dimensional CTC map (upper row, left) shows anatomic locations (one red dot for each patient) of colorectal carpet lesions detected at CTC in our experience. Except for two cases, all carpet lesions were located in the proximal right colon or rectosigmoid colon. The remaining images are from a cecal carpet lesion detected at CTC screening in a 50-year-old man. Three-dimensional colon map (upper row, middle) and 3D endoluminal CTC view (upper row, right) show three CAD marks in the cecum (yellow dots and blue regions with arrows, respectively), which identify focal areas of a broad 3.5-cm carpet lesion. The lesion is located across from the normal-appearing ileocecal. Transverse 2D images in polyp window (lower row, left) and soft-tissue window (lower row, middle) confirm a flat soft-tissue lesion (arrows). Note the etching of positive oral contrast material on the surface of the lesion, which is better seen on soft tissue windowing. The lesion was confirmed at same-day colonoscopy (lower row, right) and proved to be a tubulovillous adenoma without high-grade dysplasia after laparoscopic right hemicolectomy. From Pickhardt PJ, Lam VP, Weiss JM, et al. Carpet Lesions Detected at CT Colonography: Clinical, Imaging, and Pathologic Features. Radiology 2014;270:435-43; with permission.
Figure 2
Figure 2. Sessile serrated polyps (SSPs) detected at screening CTC
Three different patients with right-sided SSPs (each row corresponds to one patient) detected at screening CTC. Optical colonoscopy images (left images in each row) depict the flat, subtle nature of these large right-sided polyps. CTC 3D endoluminal images show the corresponding appearance that led to detection and same-day referral for polypectomy at colonoscopy. Notice that the polyps are slightly more prominent and protruding at CTC compared with the OC. Transverse 2D CTC images (right images) demonstrate how the 3D appearance represents a combination of the flat polyp and the overlying adherent tagging contrast agent (arrows). Magnified images (insets on lower 2 rows) better depict the subtle soft-tissue thickening underneath the overlying contrast cap. From Kim DH, Matkowskyj KA, Lubner MG, et al. Serrated Polyps at CT Colonography: Prevalence and Characteristics of the Serrated Polyp Spectrum. Radiology 2016;280:455-63; with permission.
Figure 3
Figure 3. Malignant right-sided polyp in ascending colon missed at initial colonoscopic evaluation
Three-dimensional colon map (right) shows the location of a large polyp in the ascending colon at CTC; 3D endoluminal CTC view shows the large polypoid lesion on or adjacent to a fold. This patient was enrolled in the DoD CTC screening trial. This polyp was not found at initial colonoscopy immediately following CTC. However, after segmental unblinding of the CTC results, the polyp was eventually found after several attempts to reposition the instrument because of repeated slippage in this region. Invasive adenocarcinoma was confirmed at surgery. From Pickhardt PJ, Nugent PA, Mysliwiec PA, et al. Location of adenomas missed by optical colonoscopy. Annals of Internal Medicine 2004;141:352-9; with permission.
Figure 4
Figure 4. Interval progression of small colorectal polyps in two patients undergoing CTC surveillance
3D colon map from CTC (A) showing the location of a small sigmoid polyp (arrow, red dot), which measured 7.8 mm at the index screening examination (B). Polyp segmentation for volume measurement is shown on both 3D and 2D (inset) views of B. At follow-up CTC 1 year later (C), the polyp grew only 0.8 mm in linear size but showed a 50% increase in volume (to 205 mm3). The lesion proved to be a tubulovillous adenoma after polypectomy at same-day colonoscopy (inset). 3D colon map (D) in a second patient showing the location of three small polyps in the right colon (arrows, red dots). 3D images from the index CTC (E) and surveillance CT colonography 16 months later (F) show a small sessile polyp in the proximal transverse colon that increased from 6.0 mm to 8.0 mm, but increased in volume by 203% (153% per year). Similar growth was seen with the two cecal polyps (not shown). The polyp in the transverse colon was a tubular adenoma, whereas the cecal lesions were both tubulovillous adenomas. From Pickhardt PJ, Kim DH, Pooler BD, et al. Assessment of volumetric growth rates of small colorectal polyps with CT colonography: a longitudinal study of natural history. Lancet Oncol 2013;14:711-20; with permission.
Figure 5
Figure 5. Polyp regression at computed tomography colonography (CTC) surveillance
3D colon map (A) showing the location of a 6.2 mm polyp in the descending colon (arrows, red dot) detected at screening CTC (B). Surveillance CTC two years later (C) showed no interval change in size. By the time of continued surveillance (D), 6.4 years after the initial CTC, the polyp had completely resolved. Detection of the small polyp on the intermediate CT colonography in 2007 essentially excludes the possibility of a false-positive interpretation. From Pickhardt PJ, Kim DH, Pooler BD, et al. Assessment of volumetric growth rates of small colorectal polyps with CT colonography: a longitudinal study of natural history. Lancet Oncol 2013;14:711-20; with permission.
Figure 6
Figure 6. Polyp growth according to histological subgroup
Polyp growth categories are shown according to the definition 20% volume change per year as progression or regression. Note overall mean growth in adenomas, especially those that are advanced. From Pickhardt PJ, Kim DH, Pooler BD, et al. Assessment of volumetric growth rates of small colorectal polyps with CT colonography: a longitudinal study of natural history. Lancet Oncol 2013;14:711-20; with permission.
Figure 7
Figure 7. Diminutive polyp at initial CT colonography screening that grew to small size at follow-up screening 6 years later in an asymptomatic woman (61 years old at initial screening)
Top: two-dimensional (2D) (left) and three-dimensional (3D) (middle) images from the initial CTC screening in 2005 show a diminutive lesion (arrowhead for 2D, arrow for 3D) measuring less than 5 mm in the proximal transverse colon. The specific colonic location is indicated on the colon map (right) by the red dot. We do not report isolated diminutive lesions at CT colonography screening. Bottom: 2D (left) and 3D (middle) images from repeat CT colonography screening in 2011 show that the sessile polyp has grown in the intervening 6 years, now measuring 7 mm (arrowhead for 2D, arrow for 3D). The polyp was confirmed (arrow) and removed at same-day colonoscopy (right) and proved to be a tubular adenoma at pathologic evaluation. The vast majority of diminutive lesions do not progress to non-diminutive size. From Pickhardt PJ, Pooler BD, Mbah I, et al. Colorectal Findings at Repeat CT Colonography Screening after Initial CT Colonography Screening Negative for Polyps Larger than 5 mm. Radiology 2017;282:139-48; with permission.
Figure 8
Figure 8. Large right-sided flat serrated lesion missed at initial CTC screening that was detected at follow-up screening 5 years later in an asymptomatic man (50 years old at initial screening)
Top: two-dimensional (2D) (left) and three-dimensional (3D) (middle) images from the initial CT colonography screening in 2004 show a subtle flat lesion (arrows) was missed in the ascending colon just distal to the ileocecal valve (*). The specific colonic location is indicated on the colon map (right) by the red dot. Little or no contrast material coating of the polyp surface is seen. Bottom: 2D (left) and 3D (middle) images from repeat CT colonography screening in 2009 show the same flat lesion (arrows), which measured 12 mm without significant change in size from 2004. The lesion now demonstrates subtle contrast coating, which increases conspicuity and reader confidence. The polyp was confirmed (arrow) and removed at same-day colonoscopy (right) and proved to be a sessile serrate polyp at pathologic evaluation. The asterisk indicates ileocecal valve. From Pickhardt PJ, Pooler BD, Mbah I, et al. Colorectal Findings at Repeat CT Colonography Screening after Initial CT Colonography Screening Negative for Polyps Larger than 5 mm. Radiology 2017;282:139-48; with permission.
Figure 9
Figure 9. Large advanced tubular adenoma missed at initial non-blinded OC after prospective detection at initial CT colonography screening
A, Three-dimensional (3D) endoluminal CTC view shows a 2-cm sessile polyp (arrow) detected behind a cecal fold adjacent to the ileocecal (IC) valve. B, Coronal two-dimensional (2D) CTC image confirms a true mucosal-based polyp (arrow). A diminutive rectal lesion (not shown) was also detected and incidentally noted in the CT colonography report. C, D, Retroflexed images from same-day OC referral show the (C) cecum and ascending colon and (D) dedicated evaluation of the ileocecal valve fold (arrow in D). The polyp was not found despite previous knowledge of specific location and thorough inspection. The diminutive rectal lesion was confirmed and proved to be a hyperplastic polyp. The OC report recommended follow-up OC in 5 years. E, Because of the standard expert discordant review process, repeat CT colonography with same-day OC, if needed, was recommended, and repeat CT colonography 9 months later shows the 2-cm polyp (arrow). F, Repeat OC performed by a different gastroenterologist confirms the large polyp behind a fold, which was resected and proved to be a tubular adenoma, advanced according to size criteria (10 mm). From Pooler BD, Kim DH, Weiss JM, et al. Colorectal Polyps Missed with Optical Colonoscopy Despite Previous Detection and Localization with CT Colonography. Radiology 2016;278:422-429; with permission.
Figure 10
Figure 10. Small polyps often carried multiple pathogenic mutations
(A) Mutation profile of polyps with known growth fates is shown. Only well-annotated, known pathogenic variants are included. (B) Small polyps had 0–3 pathogenic mutations. Horizontal lines represent the mean (p-value=0.044). The difference between polyps with one mutation and those with two or more was significant. (C) The pathology of polyps with known growth fates (A) compared with mutation frequency. (D) The mutations can be classified as public, that is, clonal with an adjusted allele frequency of ≥30% or private, that is, subclonal with an adjusted allele frequency of 5%–30%. Small polyps with only private mutation(s) tended to regress. Private only versus public only and public and private were significantly different. From Sievers CK, Zou LS, Pickhardt PJ, et al. Subclonal diversity arises early even in small colorectal tumours and contributes to differential growth fates. Gut 2017;66:2132-40; with permission.
Figure 11
Figure 11. The cancer punctuated equilibrium model of colon tumor evolution better explains the variability of colorectal polyp growth
CTC images from the initial (a) and final (b) scans from a patient with polyp that had an annual volumetric growth rate of 59% that was followed over 2.1 years prior to polypectomy. Black arrows point to the polyp that was followed longitudinally. (c) and (d) are possible evolutionary trajectories for a growing polyp. Shading under the line represent levels of intratumoral heterogeneity with punctuation events creating the greatest amount of heterogeneity. Tumorigenesis may begin with a punctuation event or periods of stasis and gradualism, a second punctuation event may provide enough molecular diversity allowing for malignant transformation. (e) and (f) are CTC images from the initial and final scans from a patient with polyp that had an annual volumetric growth rate of −33% that was followed over 0.9 years prior to polypectomy. (g) and (h) are possible evolutionary trajectories for a regressing polyp. Tumor regression may occur with the emergence of a negative or immunogenic phenotype acquired during a period of gradualism or via a punctuation event. From Sievers CK, Grady WM, Halberg RB, et al. New insights into the earliest stages of colorectal tumorigenesis. Expert Rev Gastroenterol Hepatol 2017;11:723-9; with permission.

References

    1. Pickhardt PJ, Hain KS, Kim DH, Hassan C. Low rates of cancer or high-grade dysplasia in colorectal polyps collected from computed tomography colonography screening. Clin Gastroenterol Hepatol. 2010;8:610–5. - PubMed
    1. Pickhardt PJ, Kim DH. Colorectal cancer screening with CT colonography: key concepts regarding polyp prevalence, size, histology, morphology, and natural history. American Journal of Roentgenology. 2009;193:40–6. - PubMed
    1. Lieberman D, Moravec M, Holub J, Michaels L, Eisen G. Polyp Size and Advanced Histology in Patients Undergoing Colonoscopy Screening: Implications for CT Colonography. Gastroenterology. 2008 - PMC - PubMed
    1. Ponugoti PL, Cummings OW, Rex DK. Risk of cancer in small and diminutive colorectal polyps. Dig Liver Dis. 2017;49:34–7. - PubMed
    1. Hassan C, Pickhardt PJ, Kim DH, et al. Systematic review: distribution of advanced neoplasia according to polyp size at screening colonoscopy. Aliment Pharmacol Ther. 2010;31:210–7. - PubMed

Publication types