

MRI-based treatment planning for brain stereotactic radiosurgery: Dosimetric validation of a learning-based pseudo-CT generation method
- PMID: 30115539
- PMCID: PMC7775641
- DOI: 10.1016/j.meddos.2018.06.008
MRI-based treatment planning for brain stereotactic radiosurgery: Dosimetric validation of a learning-based pseudo-CT generation method
Abstract
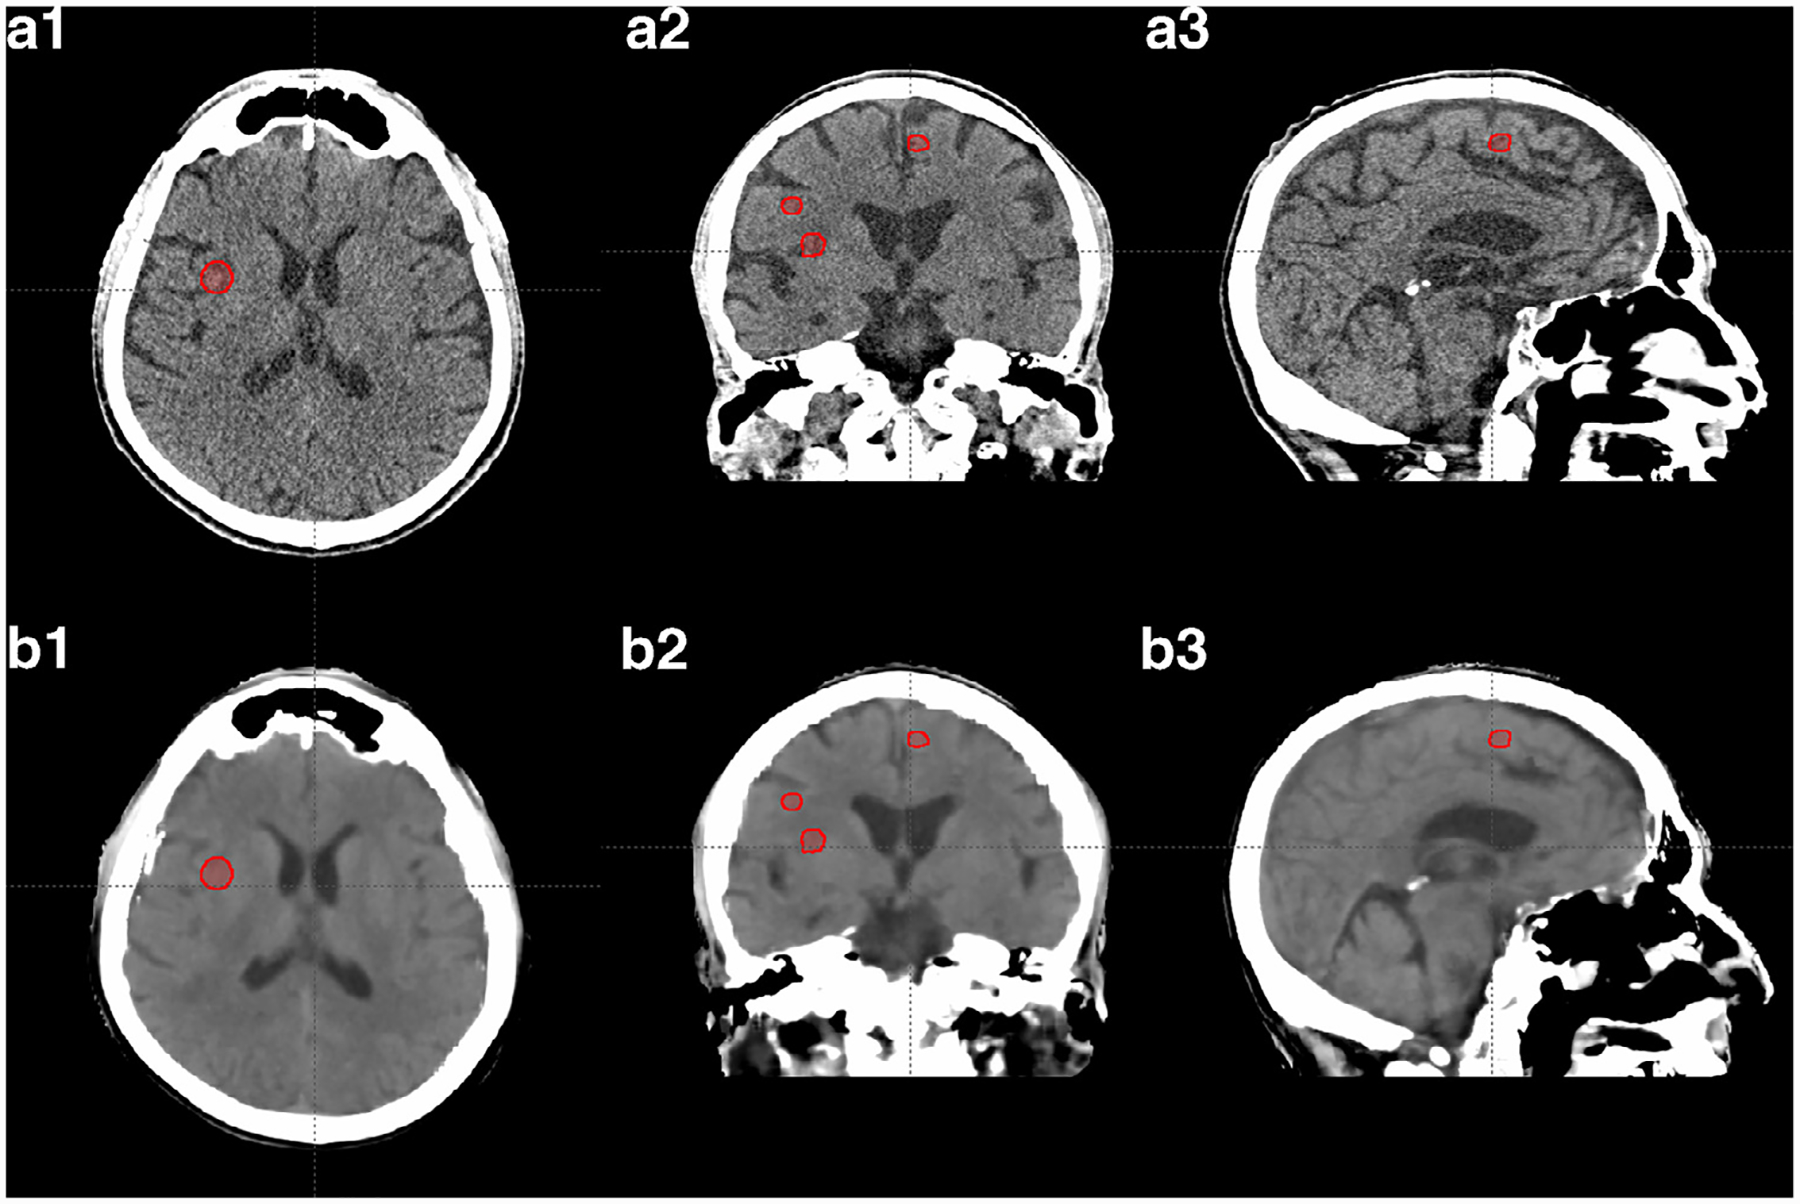
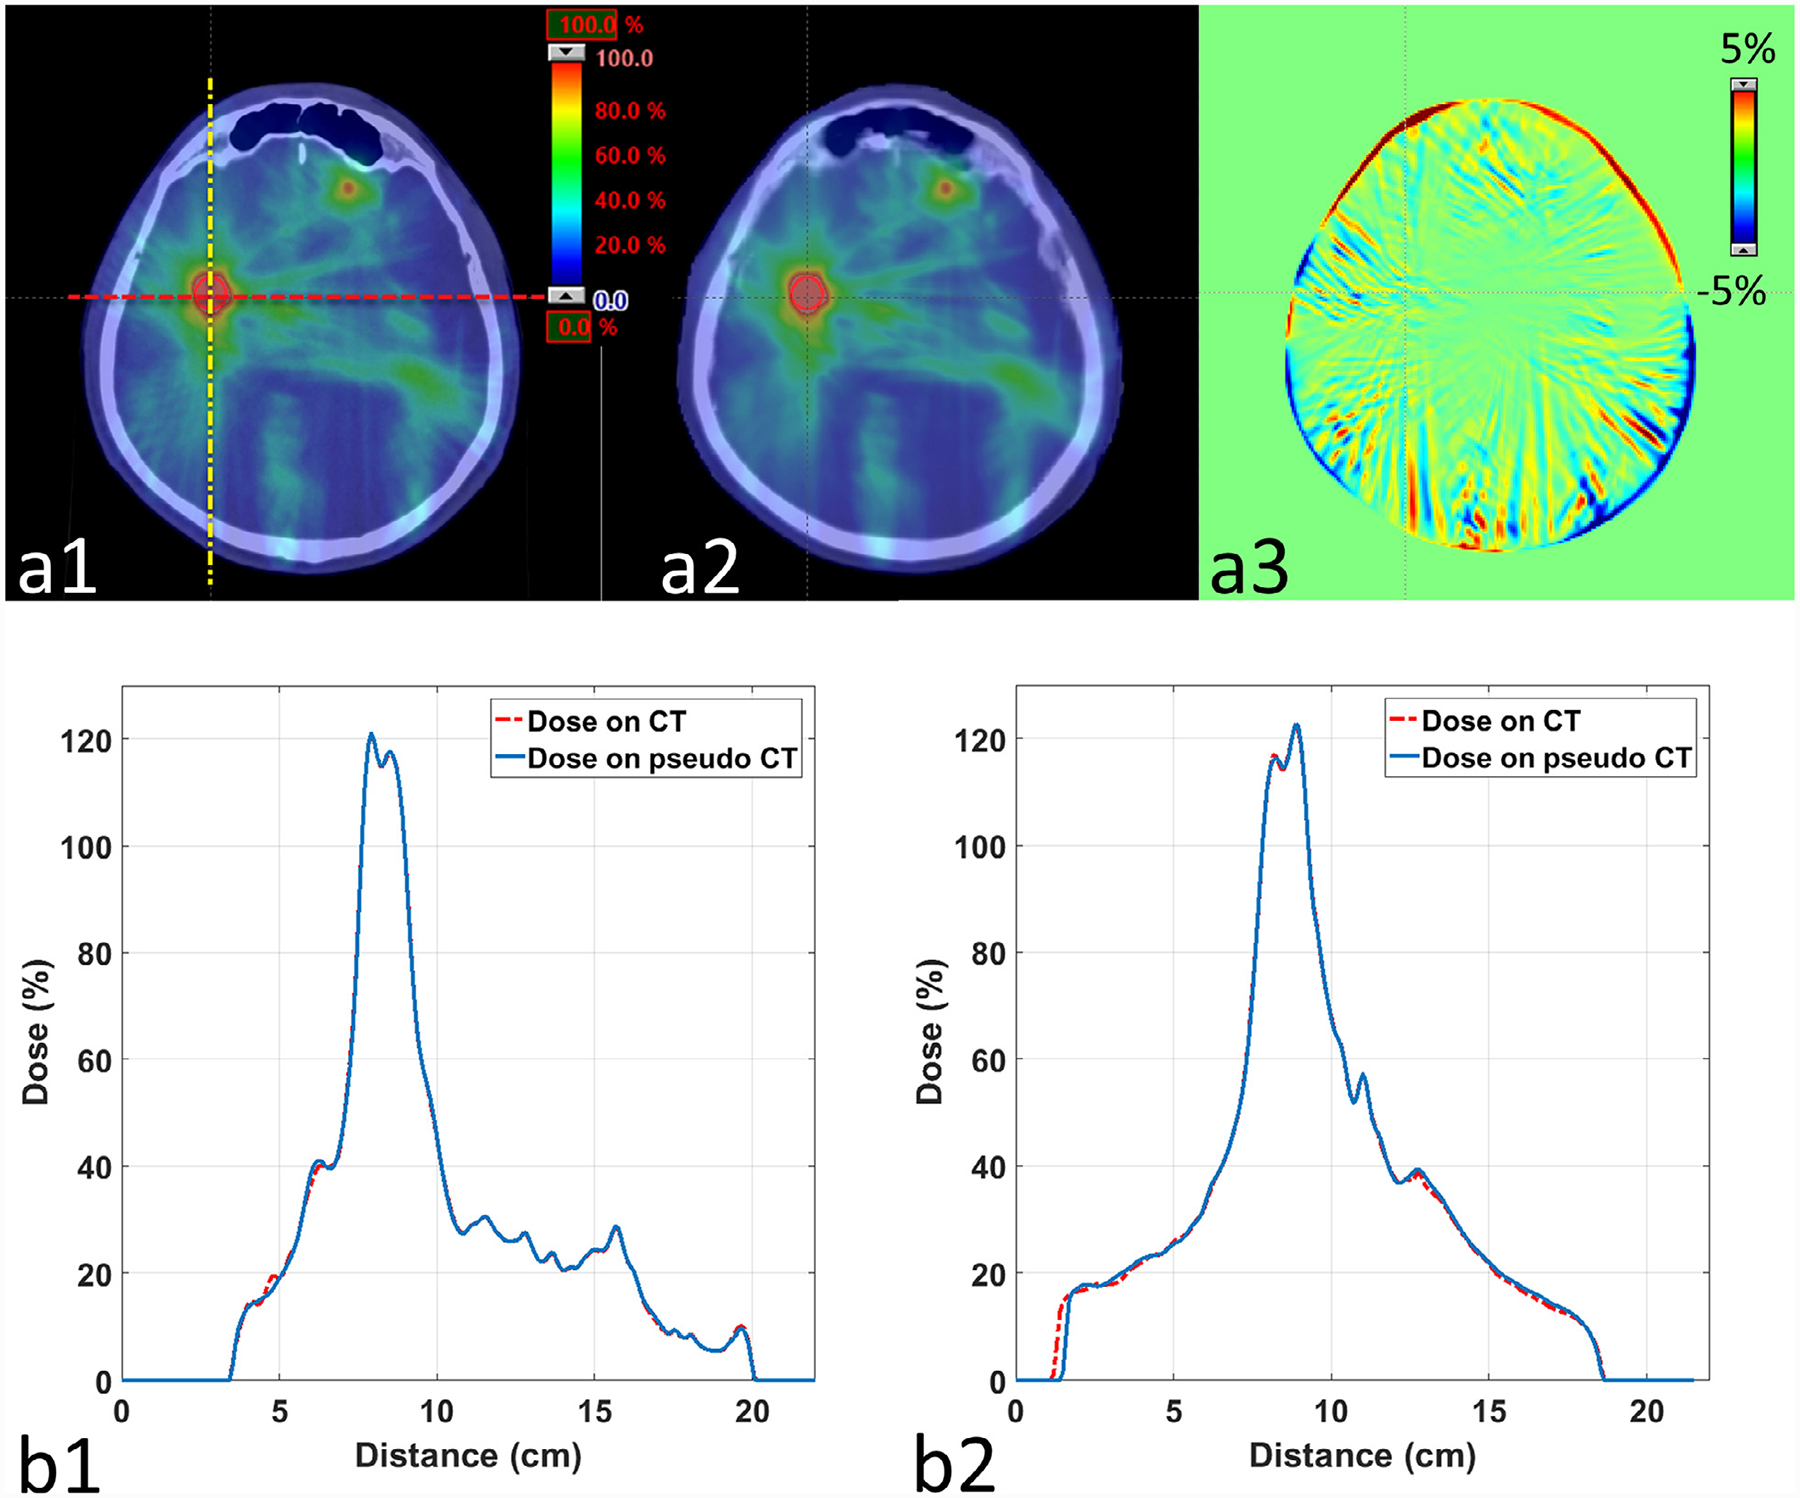
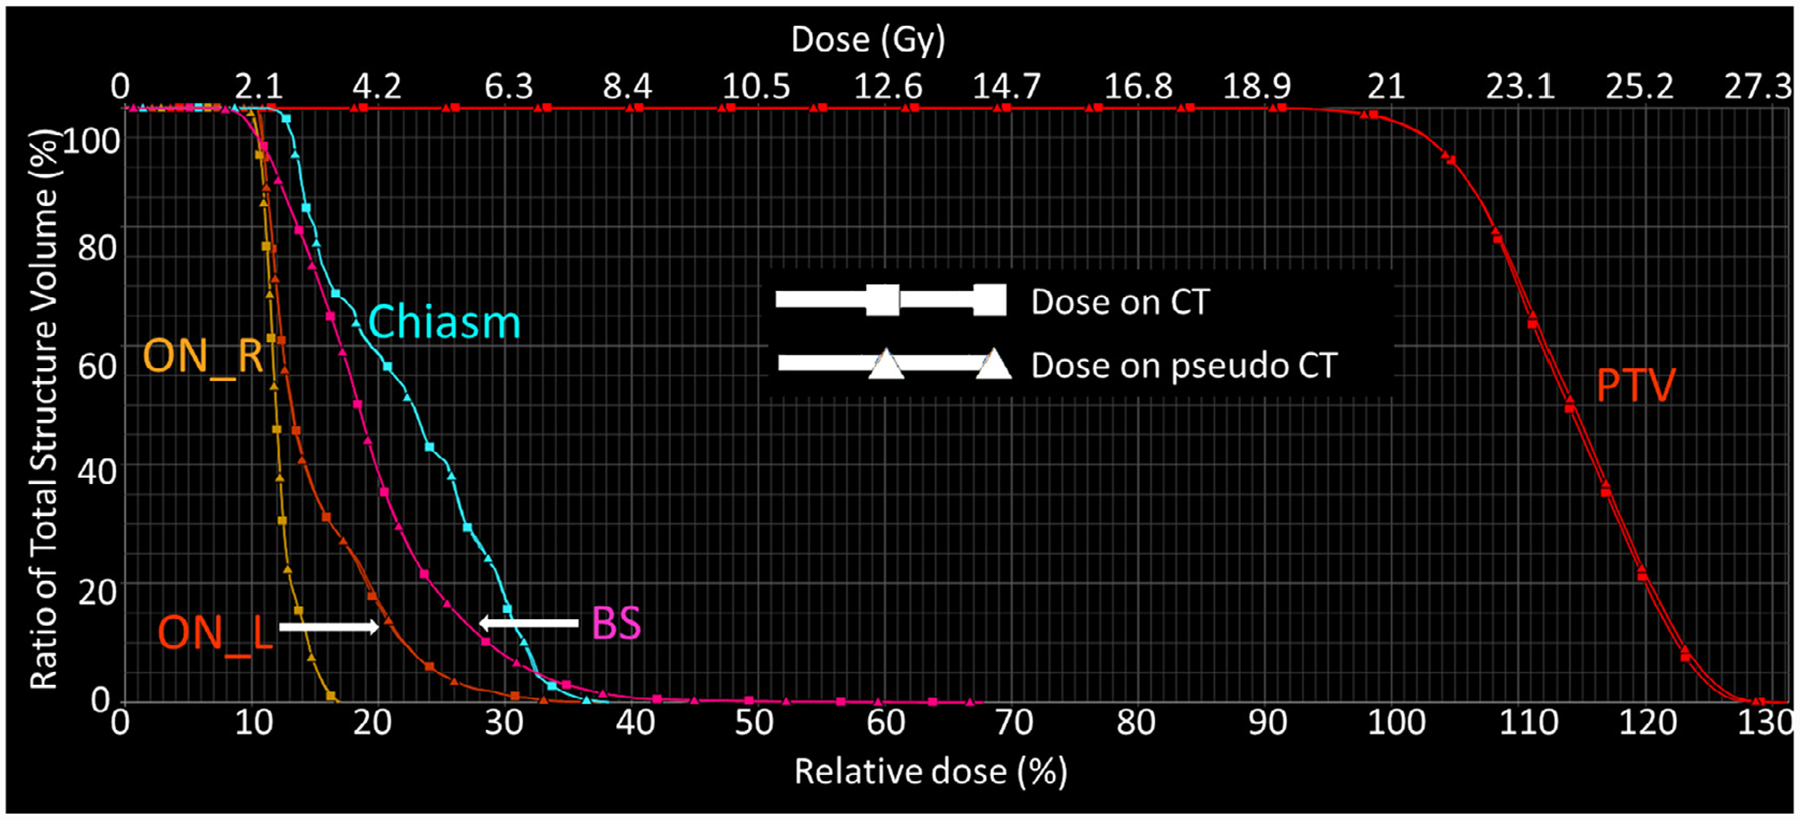
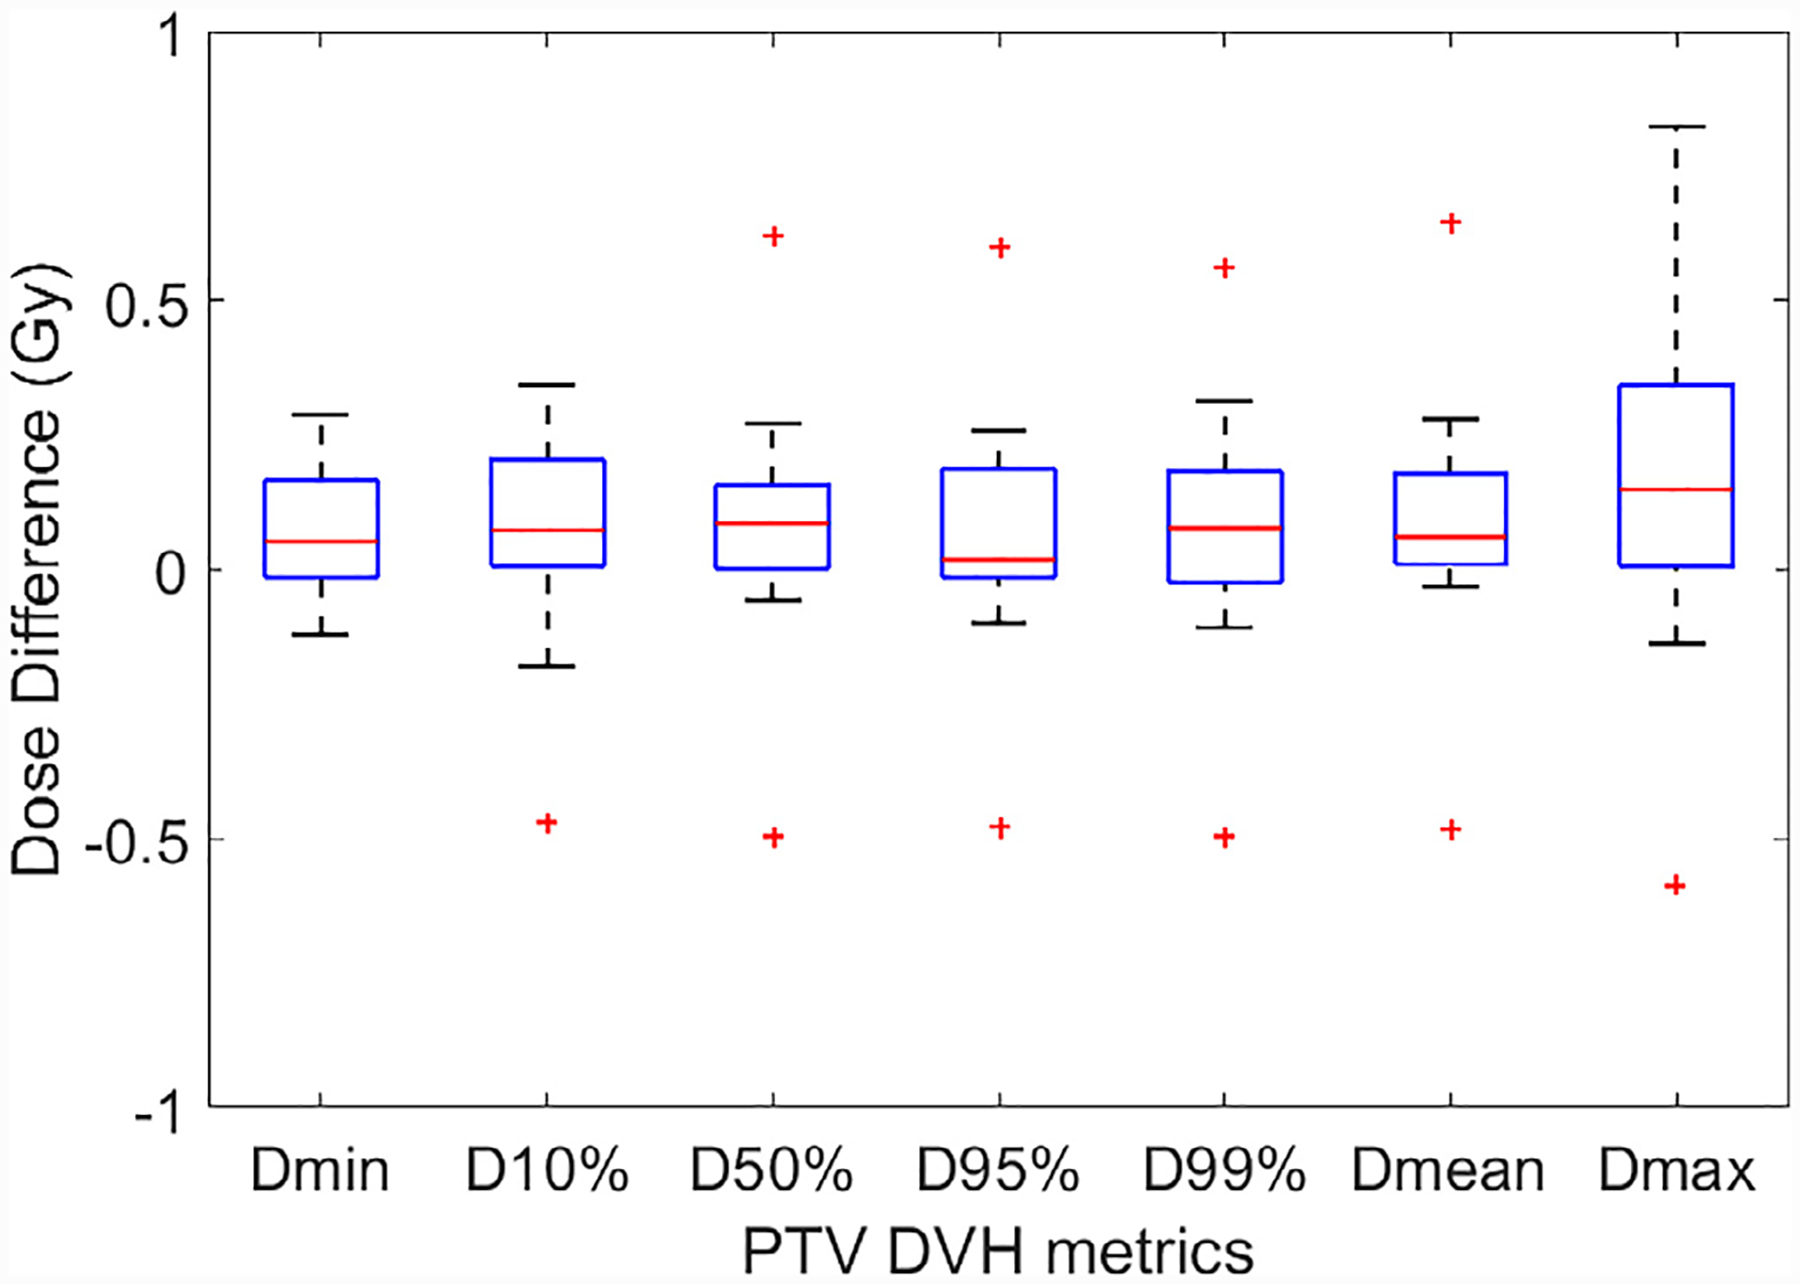
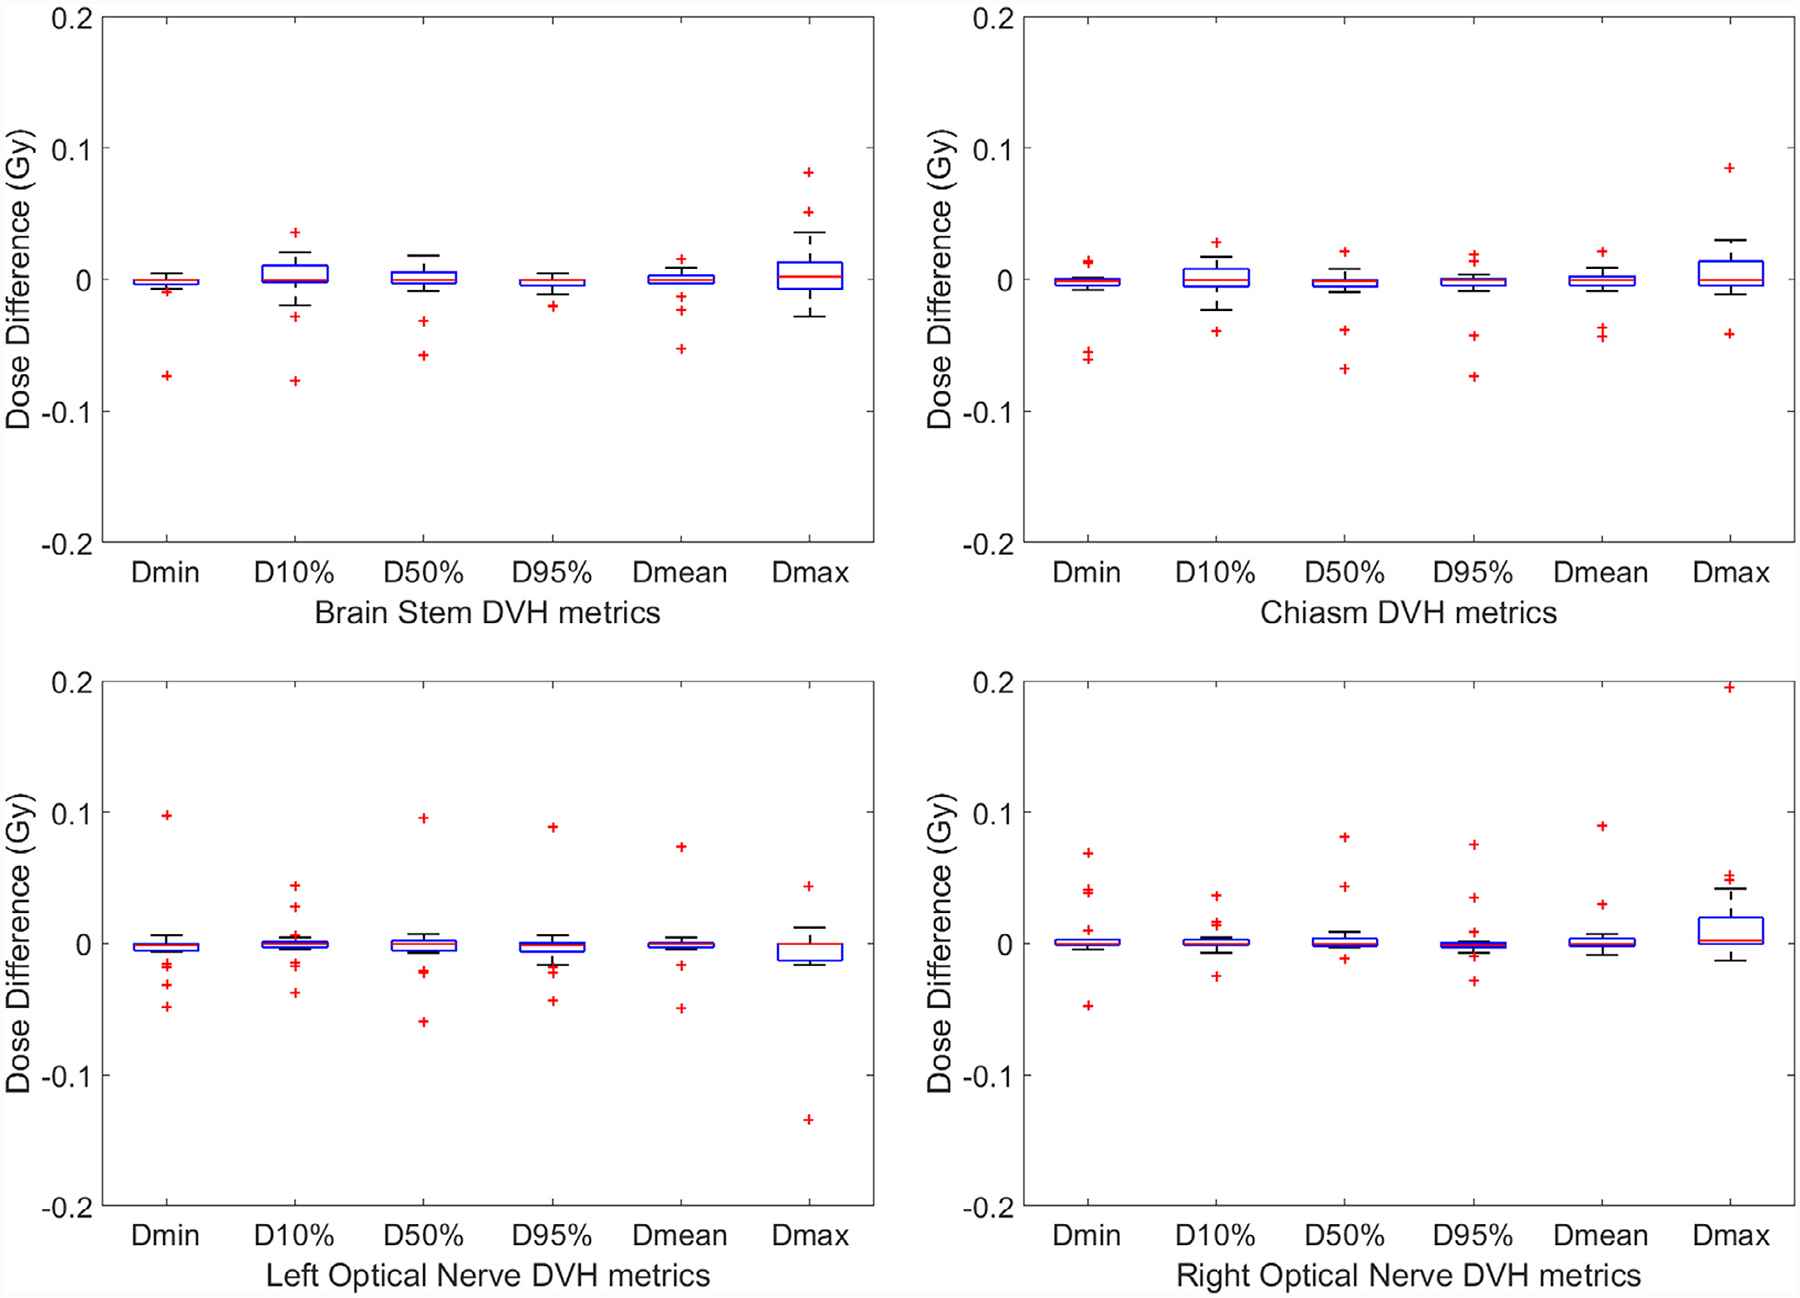
Magnetic resonance imaging (MRI)-only radiotherapy treatment planning is attractive since MRI provides superior soft tissue contrast without ionizing radiation compared with computed tomography (CT). However, it requires the generation of pseudo CT from MRI images for patient setup and dose calculation. Our machine-learning-based method to generate pseudo CT images has been shown to provide pseudo CT images with excellent image quality, while its dose calculation accuracy remains an open question. In this study, we aim to investigate the accuracy of dose calculation in brain frameless stereotactic radiosurgery (SRS) using pseudo CT images which are generated from MRI images using the machine learning-based method developed by our group. We retrospectively investigated a total of 19 treatment plans from 14 patients, each of whom has CT simulation and MRI images acquired during pretreatment. The dose distributions of the same treatment plans were calculated on original CT simulation images as ground truth, as well as on pseudo CT images generated from MRI images. Clinically-relevant DVH metrics and gamma analysis were extracted from both ground truth and pseudo CT results for comparison and evaluation. The side-by-side comparisons on image quality and dose distributions demonstrated very good agreement of image contrast and calculated dose between pseudo CT and original CT. The average differences in Dose-volume histogram (DVH) metrics for Planning target volume (PTVs) were less than 0.6%, and no differences in those for organs at risk at a significance level of 0.05. The average pass rate of gamma analysis was 99%. These quantitative results strongly indicate that the pseudo CT images created from MRI images using our proposed machine learning method are accurate enough to replace current CT simulation images for dose calculation in brain SRS treatment. This study also demonstrates the great potential for MRI to completely replace CT scans in the process of simulation and treatment planning.
Keywords: MRI; Pseudo CT; Treatment planning.
Copyright © 2018 American Association of Medical Dosimetrists. Published by Elsevier Inc. All rights reserved.
Conflict of interest statement
Conflict of Interest
The author declares no conflicts of interest.
Figures
References
MeSH terms
Grants and funding
LinkOut - more resources
Full Text Sources
Other Literature Sources
Medical
