. 2018 Nov;8(11):1376-1389.
doi: 10.1158/2159-8290.CD-17-0841. Epub 2018 Aug 16.

Targeting the MTF2-MDM2 Axis Sensitizes Refractory Acute Myeloid Leukemia to Chemotherapy

Affiliations

Targeting the MTF2-MDM2 Axis Sensitizes Refractory Acute Myeloid Leukemia to Chemotherapy

Harinad B Maganti et al. Cancer Discov. 2018 Nov.

Abstract

Deep sequencing has revealed that epigenetic modifiers are the most mutated genes in acute myeloid leukemia (AML). Thus, elucidating epigenetic dysregulation in AML is crucial to understand disease mechanisms. Here, we demonstrate that metal response element binding transcription factor 2/polycomblike 2 (MTF2/PCL2) plays a fundamental role in the polycomb repressive complex 2 (PRC2) and that its loss elicits an altered epigenetic state underlying refractory AML. Unbiased systems analyses identified the loss of MTF2-PRC2 repression of MDM2 as central to, and therefore a biomarker for, refractory AML. Thus, immature MTF2-deficient CD34+CD38- cells overexpress MDM2, thereby inhibiting p53 that leads to chemoresistance due to defects in cell-cycle regulation and apoptosis. Targeting this dysregulated signaling pathway by MTF2 overexpression or MDM2 inhibitors sensitized refractory patient leukemic cells to induction chemotherapeutics and prevented relapse in AML patient-derived xenograft mice. Therefore, we have uncovered a direct epigenetic mechanism by which MTF2 functions as a tumor suppressor required for AML chemotherapeutic sensitivity and identified a potential therapeutic strategy to treat refractory AML.Significance: MTF2 deficiency predicts refractory AML at diagnosis. MTF2 represses MDM2 in hematopoietic cells and its loss in AML results in chemoresistance. Inhibiting p53 degradation by overexpressing MTF2 in vitro or by using MDM2 inhibitors in vivo sensitizes MTF2-deficient refractory AML cells to a standard induction-chemotherapy regimen. Cancer Discov; 8(11); 1376-89. ©2018 AACR. See related commentary by Duy and Melnick, p. 1348 This article is highlighted in the In This Issue feature, p. 1333.


Conflict of interest statement

Disclosure of Potential Conflicts of Interest

A.J. Ruthenburg has ownership interest (including stock, patents, etc.) in Epicypher Inc. and is a consultant/advisory board member for the same. No potential conflicts of interest were disclosed by the other authors.

Figures
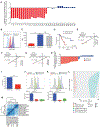
Figure 1.
Figure 1.
MTF2 deficiency correlates with poor response to standard treatment of care. A, 18 of 32 diagnostic AML BM aspirates demonstrated low mean fluorescence intensity (MFI) for H3K27me3 levels by flow-cytometric analysis compared with 7 normal BM aspirates (set to 0 in the log2 scale). B, Representative flow cytometry histogram comparing H3K27me3 levels within the CD34+CD38 population isolated from AML patient and healthy donor BM samples. C, The H3K27me3 MFI obtained from flow cytometry analysis of 32 diagnostic and 7 healthy donor BM samples demonstrates that reduced levels of H3K27me3 in CD34+CD38 cells correlate with poor response to induction therapy. D, Survival analysis of the 32 patients with AML treated by induction therapy shows H3K27me3 levels within patient CD34+CD38cells correlated with patient outcome; P value was calculated using log-rank (Mantel–Cox) test. E–G, Linear regression analysis of PRC2 complex members (E) MTF2, (F) EZH2, and (G) SUZ12 revealed that only MTF2 mRNA expression correlates strongly with H3K27me3 levels within patient cohort. H, MTF2 expression within CD34+CD38 cells isolated from the same 32 diagnostic AML BM aspirates compared with CD34+CD38 cells from 7 healthy BM aspirates assessed by RT-qPCR. Seventeen aspirates were determined to have low levels of MTF2 expression (<−1), and 15 aspirates were determined to have basal levels of MTF2 expression (−1 to +1, with 0 representing the mean of 7 healthy BMs). I, A double-blinded drug-response analysis determined that patients within the patient cohort with low MTF2 expression responded poorly to standard induction chemotherapy. J and K, Knockdown (KD) of (J) MTF2 within umbilical cord blood CD34+CD38 cells decreases (K) H3K27me3 levels, assessed by flow cytometry. L, Principal component analysis of spike-in normalized H3K27me3 ChIP-seq data from CD34+CD38 cells isolated from patients with refractory AML (n = 4 samples), responsive patients with AML (n = 2 samples) or healthy BM transduced with MTF2 (n = 4 samples) or scramble (n = 2 samples) lentivirus shRNA. The H3K27me3 ChIP sequencing was performed in 2 independent batches (batch 1 = •, batch 2 = ▴). M, Hierarchical clustering analysis demonstrated that the MTF2-deficient CD34+CD38 BM population clusters closely to the CD34+CD38 population isolated from refractory AML BM aspirates. All data represent mean ± standard deviation; *, P < 0.05; **, P < 0.005; ***, P < 0005; ****, P < 0.00005 by Student t test.
Figure 2.
Figure 2.
MTF2 knockdown in hematopoietic progenitors or chemoresponsive leukemic cells, but not EZH2 inhibition alone, confers resistance to standard treatment of care. A and B, Viability of scramble control (SCR) and MTF2 shRNA (SH3 or SH7) KD UCB Lin CD34+ cells were assessed over a 48-hour time period after treatment with (A) daunorubicin or (B) cytarabine. C and D, Viability of scramble control (SCR) and MTF2 (SH3 or SH7) shRNA KD LinCD34+chemoresponsive leukemic cells isolated from MTF2-basal AML samples (B-AML) were assessed posttreatment with (C) daunorubicin or (D) cytarabine. By 24 hours after treatment, more than 25%, but less than 2%, of KD B-AML and scramble control cells, respectively, remain viable. E and F, PCNA proliferation marker analysis of scramble control (SCR) and MTF2 shRNA (SH3, SH7) KD UCB LinCD34+ 48 hours after (E) daunorubicin or (F) cytarabine treatment. Viable cells from A and B were stained for PCNA, to assess cell proliferation. G and H, Proliferation analysis of scramble control (SCR) and MTF2 shRNA (SH3, SH7) KD B-AML cells 24 hours (G) after daunorubicin or (H) after cytarabine treatment. Viable cells from C and D were stained for PCNA, to assess cell proliferation. Both MTF2-deficient hematopoietic progenitors and B-AML cells continue to proliferate significantly more than control cells posttreatment. I and J, Overall DNA damage accumulation after induction treatment with (I) daunorubicin or (J) cytarabine was assessed over 48 hours via the alkaline comet assay. Blinded, ImageJ OpenComet analysis of the Olive moment was used to quantify DNA damage at the single-cell level, and although both the scramble (SCR) and MTF2 (SH3 or SH7) KD hematopoietic progenitors accumulated DNA damage over time, the MTF2 KD UCB LinCD34+ cells accumulated significantly less damage at each individual time point. K and L, Overall DNA damage accumulation in transduced B-AML cells after induction treatment with (K) daunorubicin or (L) cytarabine was assessed over 48 hours via the alkaline comet assay. MTF2 KD leukemic B-AML cells accumulated significantly less DNA damage than scramble controls. M (left), The CD34+CD38 BM subpopulation from patients with AML with MTF2 deficiency (MD-AML) transduced with lentivirus encoding an empty expression vector and treated with daunorubicin remain viable over 48 hours. Right, restoration of MTF2 via lentiviral-induced expression sensitized the MD-AML cells to daunorubicin. N (left), Similar results were observed when CD34+CD38 cells isolated from MD-AML patient BM were transduced with control lentivirus treated with cytarabine. Right, MTF2 restoration abolished the chemoresistance observed within 48 hours. O and P, Viability analysis of UCB LinCD34+ treated with vehicle control (VC), 2 μmol/L EZH2 inhibitor EPZ005687 (EPZ), or 2 μmol/L of the EZH1/2 inhibitor UNC1999 (UNC) for 72 hours, followed by cotreatment with one of two induction drugs (O) daunorubicin (D) or (P) cytarabine (C) over 48 hours. Q and R,Viability analysis of B-AML Lin CD34+ cells that underwent the same treatment regimen as in O and P. S–V, PCNA proliferation marker analysis of (S and T) UCB LinCD34+ or (U and V) B-AML Lin CD34+ cells that underwent the same treatment regimen as in O and P. PCNA expression in UNC1999 plus either induction drug-treated cells showed significantly increased proliferation over 48 hours. W–Z, DNA damage accumulation was assessed by comet assay analysis of (W and X) UCB LinCD34+ or (Y and Z) B-AML Lin CD34+ cells that underwent the same treatment regimen as in O and P. Cotreatment of UNC1999 plus either induction drug showed the lowest Olive moment representative of DNA damage accumulation over 48 hours. Taken together, these results show that dual loss of both EZH1 and EZH2 is required to confer resistance to standard induction therapy within UCB LinCD34+ cells and LinCD34+ leukemic cells. Viable cells were determined by the percentage of Annexin V–negative/7-AAD–negative cells. Representative dot plots are shown in Supplementary Fig. S7A and S7B. Representative comets of each condition are shown in Supplementary Fig. S7C and S7D. All data represent mean ± standard deviation; *, P < 0.05; **, P < 0.005; ***, P < 0005 by two-way ANOVA.
Figure 3.
Figure 3.
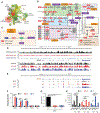
MTF2 gene regulatory network (GRN) modulates refractory AML via the MDM2/p53 signaling pathway. A, Gene ontology enrichment analysis of MTF2 KD UCB LinCD34+ cells identified genes misregulated in processes such as cell cycle, RNA processing, nuclear transport, antiapoptosis, histone modifications, and DNA damage response (DDR). B, MTF2 GRN drafted by the integration of RNA-seq and H3K27me3 ChIP-seq data from hematopoietic progenitors with KEGG pathway analysis uncovered oncogenic pathways that are directly regulated by MTF2-PRC2. C,Oncogenic module within the MTF2-PRC2 GRN revealed that MTF2 directly represses MDM2, a direct inhibitor of p53. D, Drosophila chromatin spike-in normalized ChIP-seq traces show loss of the repressive H3K27me3 marks at the MDM2 genomic locus in MTF2 KD UCB LinCD34+ cells relative to total Histone 3 signal. E, RNA-seq traces display increased MDM2 mRNA levels in MTF2 KD UCB LinCD34+ cells. F, RT-qPCR confirmation of target genes (MDM2, MITF, and CCND1), nontargets (CDKN1A and TP53), and (G) ChIP-qPCR confirmation of MDM2 as a target of MTF2 by loss of H3K27me3 following knockdown of MTF2 in UCB LinCD34+ cells using SH3 and SH7 shRNAs. H, Imaging flow cytometry analysis of MDM2 and p53 revealed increased MDM2 and decreased p53 levels within MTF2 shRNA (SH3 or SH7) KD UCB LinCD34+ cells. Decreased p53 levels within MTF2-deficient UCB LinCD34+ cells were rescued by treatment with MDM2 inhibitors Nutlin3A (N) or MI-773 (MI). All analyses compared MTF2 KD (SH3 or SH7) with scramble control (SCR) UCB LinCD34+ cells. All data represent mean ± standard deviation; ***, P < 0005; ****, P < 0.00005 by two-way ANOVA.
Figure 4.
Figure 4.
MDM2 inhibitors sensitize MTF2-deficient hematopoietic progenitors and patient-refractory AML cells to standard treatment of care. A and B, Alkaline comet assays were performed on control (SCR) and MTF2 KD (SH3, SH7) UCB LinCD34+ cells treated with vehicle control (VC), (A) daunorubicin (D), or (B) cytarabine (C) in combination with one of two MDM2 inhibitors, Nutlin3A (N) or MI-773 (MI). C–E, Viability analysis to assess chemoresistance posttreatment with induction drugs, MDM2 inhibitors, or both. C, MTF2 KD (SH3, SH7) UCB LinCD34+ cells undergo apoptosis post combination treatment with induction drug plus MDM2 inhibitor, over 48 hours. MTF2-deficient refractory AML cells (MD-AML) showed increased sensitivity to (D) daunorubicin and (E) cytarabine, when treated in combination with MI-773 (MI) or Nutlin3A (N) for 48 hours comparable to MTF2-basal AML samples (B-AML). Analysis 24 hours after treatment is shown in Supplementary Fig. S23A and S23B. F, Kaplan–Meier curve of MD-AML PDX NSG mice treated with either vehicle control, Nutlin3A alone, induction therapy, or combination therapy (Nutlin3A + induction therapy; n = 4 refractory AML samples; n = 8 mice per treatment group). G, Mouse weight was monitored up to 16 weeks after treatment. Initial weight loss was observed in all conditions, but weight recovery was observed only in mice that underwent combination treatment. H, Wright–Giemsa stained cytospins of BM samples from MD-AML PDX mice treated with induction therapy and combination therapy demonstrate a loss of immature blast cells following combination treatment only. I, BM mononuclear cell (MNC) counts from MD-AML PDX moribund mice following treatment with either vehicle control (VC), Nutlin3A, or induction therapy and from surviving mice administered combination therapy 16 weeks after treatment and their secondary transplant recipients. A profound decrease in MNCs was observed in the BM of primary mice that received combination therapy and their secondary transplant recipients. Engraftment of secondary transplants is shown in Supplementary Fig. S26. All data represent mean ± standard deviation; *, P < 0.05; **, P < 0.005; ***, P < 0005; P < 0.00005 by two-way ANOVA.

Comment in

References

    1. Thol F, Schlenk RF, Heuser M, Ganser A. How I treat refractory and early relapsed acute myeloid leukemia. Blood 2015; 126:319–27. - PubMed
    1. Döhner H, Estey E, Grimwade D, Amadori S, Appelbaum FR, Büchner T, et al. Diagnosis and management of AML in adults: 2017 ELN recommendations from an international expert panel. Blood 2017; 129:424–47. - PMC - PubMed
    1. Glass J, Hassane DC, Wouters B, Kunimoto H, Avellino R, Garrett-Bakelman FE, et al. Epigenetic identity in AML depends on disruption of non-promoter regulatory elements and is affected by antagonistic effects of mutations in epigenetic modifiers. Cancer Discov 2017; 7: 868–83. - PMC - PubMed
    1. Cai MY, Hou JH, Rao HL, Luo RZ, Li M, Pei XQ, et al. High expression of H3K27me3 in human hepatocellular carcinomas correlates closely with vascular invasion and predicts worse prognosis in patients. Mol Med 2011; 17:12–20. - PMC - PubMed
    1. Gollner S, Oellerich T, Agrawal-Singh S, Schenk T, Klein HU, Rohde C, et al. Loss of the histone methyltransferase EZH2 induces resistance to multiple drugs in acute myeloid leukemia. Nat Med 2017; 23:69–78. - PMC - PubMed

Publication types

MeSH terms