. 2018 Aug 16;9(1):3275.
doi: 10.1038/s41467-018-05393-0.

Size control in mammalian cells involves modulation of both growth rate and cell cycle duration

Affiliations

Size control in mammalian cells involves modulation of both growth rate and cell cycle duration

Clotilde Cadart et al. Nat Commun. .

Abstract

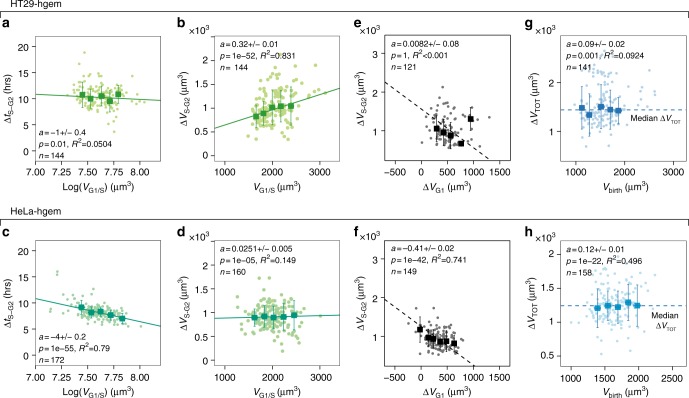
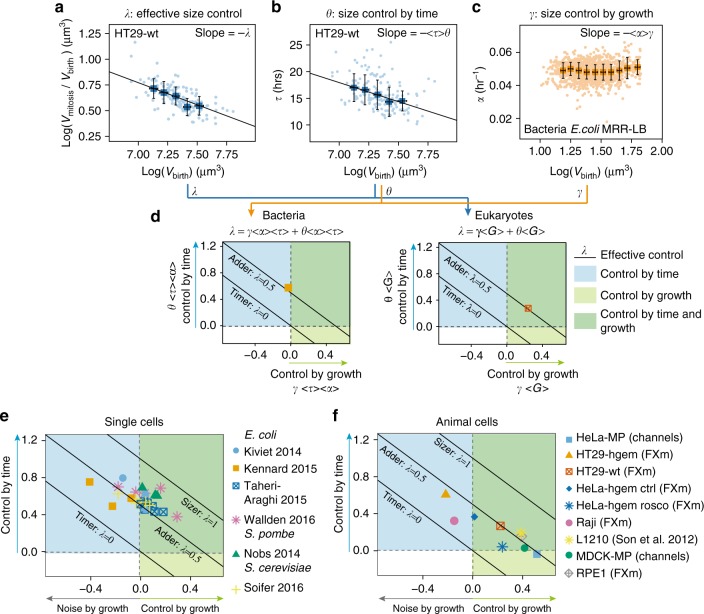
Despite decades of research, how mammalian cell size is controlled remains unclear because of the difficulty of directly measuring growth at the single-cell level. Here we report direct measurements of single-cell volumes over entire cell cycles on various mammalian cell lines and primary human cells. We find that, in a majority of cell types, the volume added across the cell cycle shows little or no correlation to cell birth size, a homeostatic behavior called "adder". This behavior involves modulation of G1 or S-G2 duration and modulation of growth rate. The precise combination of these mechanisms depends on the cell type and the growth condition. We have developed a mathematical framework to compare size homeostasis in datasets ranging from bacteria to mammalian cells. This reveals that a near-adder behavior is the most common type of size control and highlights the importance of growth rate modulation to size control in mammalian cells.


Conflict of interest statement

The authors declare no competing interests.

Figures

Fig. 1
Fig. 1
Single-cell volume tracking over entire cell division cycles. a Principle of the fluorescence exclusion volume measurement method (FXm). Left: top view of the measurement chamber used for 50 h long time-lapse acquisitions (see Methods). Right: side view of the chamber and principle of the measurement. Fluorescence intensity at a point Ix,y of the cell is proportional to the height of the chamber minus the height hx,y of the cell at this point. Fluorescence intensity Imax is the intensity under the known height of the chamber roof hmax, where no object excludes the fluorescence. Integration of fluorescence intensity over the cell area gives the cell volume Vcell after calibrating the fluorescence intensity signal α = (Imax − Imin)/hmax (see Methods). b Sequential images of a HT29-wt cell acquired for FXm. Mitosis and birth are defined as the time points 60 min before and 40 min after cytokinesis respectively (see Methods). The white dashed circle indicates the cell measured in Fig. 1c, the colored lines indicate the time points highlighted by circles of the same color in Fig. 1c. Time is in hours:minutes. Scale bar is 20 µm. c Single HT29-wt cell growth trajectory (volume as a function of time) and key measurement points (see Methods). The time points shown in Fig. 1b and underlined in gray, red, or yellow are indicated by points of matching colors on the curve: the gray points correspond to volume at mitotic entry, the red points correspond to volume at cytokinesis and the yellow points to volume at birth. ΔtTOT is the total duration of the cell division cycle from birth to mitosis and ΔtTOT is the total added volume. d Average growth speed for three independent experiments with HT29-wt cells. n = 39 (exp. 1), n = 46 (exp. 2), n = 47 (exp. 3). The p-values are the result of a pairwise t test comparing the means. See also Supplementary Figure 1 and Supplementary Movie 1
Fig. 2
Fig. 2
Adder or near-adder behavior in cultured mammalian cells. a Left: total volume gained during one cell division cycle ΔtTOT vs. volume at birth Vbirth for wild-type HT29 cells (N = 3). Right: volume at mitosis Vmitosis vs. Vbirth. Dashed gray lines show the expected trends in case of a sizer, an adder, and a timer. Blue lines: linear fit on the binned data weighted by the number of observations in each bin. b Left graph: plot of volume at mitosis vs. volume at birth rescaled by the mean volume at mitosis for various cultured mammalian cell lines. Ideal slopes for stereotypical homeostatic behaviors are shown as black and gray lines. The points are median bins (see Supplementary Fig. 2b for equivalent graphs with single points). For each cell type, a linear fit Vmitosis=aVbirth+b is made on the bins weighted by the number of observation in each bin. Right table: estimates from the linear regression for each cell type: a (slope coefficient), s.e. a (standard error for a), b (slope intercept). The theoretical slope coefficients and intercepts expected in case of sizer, adder, or timer are also indicated. L1210 are mouse lymphoblastoid cells from ref.. Apart from the L1210 cells buoyant mass, data are volumes acquired with either the FXm or the microchannel methods). c Top: scheme of a cell confined in a microchannel (nucleus in red). Bottom: sequential images of an asymmetrically dividing HeLa cells expressing MyrPalm-GFP (plasma membrane, green) and Histon2B-mcherry (nucleus, red) growing inside a microchannel. The outlines of the cell of interest and its daughters are shown with white dotted lines. Daughter cells are indicated with solid white bars. Scale bar is 20 µm. Time is hours:minutes. d Ratio of volume in pairs of sister cells at birth and mitosis for MDCK-MP and HeLa-MP cells growing inside microchannels. Control, in non-confined condition, corresponds to HeLa-hgem cells measured with FXm. A Wilcoxon signed rank test was performed to test that the median ratio was lower from birth to mitosis in each condition. See also Supplementary Figure 2 and Supplementary Movie 2
Fig. 3
Fig. 3
Near-adder behavior in primary human cells. a Boxplot showing the distribution of over replicative growth (volume at mitosis divided by volume at birth) for three samples of NAF and NHDF primary cells. NAF-A:, n = 48, N = 2; NAF-B: n = 53, N = 2; NAF-C: n = 53, N = 2; NHDF: n = 56, N = 3. b Volume at mitosis as a function of volume at birth for three samples of NAF and NHDF primary cells. Dashed lines are visual guides for the timer timer (assuming exponential growth, slope = 〈Vmitosis/VG1/S〉, intercept = 0), adder (slope = 1, intercept = 〈ΔVS−G2〉) and sizer (slope = 0, intercept = 〈Vmitosis〉). Solid lines represent linear fits on the bins (colored squares) weighted by the number of observations in each bin
Fig. 4
Fig. 4
Modulation of G1 duration as a function of volume at birth. a Sequential images of HT29 cells expressing hgeminin-mcherry (top row) in an FXm chamber (bottom row). Right graph shows the quantification of hgeminin-mcherry in the cell as a function of time. Time zero corresponds to mitosis. The vertical white dashed line and arrows indicate the time at which hgeminin-mcherry becomes detectable. G1 phase (red line) spans from birth to appearance of hgeminin (G1/S transition) and S-G2 phases (green line) from G1/S to next entry in mitosis. Scale bar is 20 µm. Time is in hours:minutes. b Kernel density estimates of the duration Δt of G1 phase (red), S-G2 phase (green) and total cell cycle (blue) for both HT29-hgem and HeLa-hgem. CV is the coefficient of variation (in %). c, d Duration of G1 phase, ΔtG1 as a function of the logarithm of volume at birth (Vbirth) for HT29-hgem (N = 4) (c) and HeLa-hgem (N = 2) (d). Red dashed line and gray area are a visual guide for minimum G1 duration around 4 h. e, f Total added volume in G1 ΔVG1 as a function of volume at birth (Vbirth) for HT29-hgem (N = 4) (e) and HeLa-hgem (N = 2) (f). g, h Volume at G1/S (VG1/S) vs. volume at birth (Vbirth) for HT29-hgem (N = 4) (g) and HeLa-hgem (N = 2) (h). The dashed gray lines indicate the expected trend in the case of a timer (slope =〈VG1/S/Vbirth〉, intercept = 0), an adder (slope = 1, intercept=〈VG1/S〉) and a sizer (slope = 0, intercept = 〈VG1/S〉). i, j Cumulative frequency graph of G1 duration binned for three ranges of volumes at birth Vbirth for HT29-hgem (i) (N = 4) and HeLa-hgem (j) (N = 2). Dashed line and gray area are a visual guide for minimum G1 duration around 4 h. For the plots in ch, individual cell measures (dots) and median bins (squares) ± s.d. (bars) are shown. Solid lines are linear regressions on the median bins weighted by the number of observations in each bin. See also Supplementary Figure 4 and Supplementary Movie 3
Fig. 5
Fig. 5
S-G2 duration is negatively correlated with volume at G1/S in HeLa but not HT29 cell. a Duration of S-G2 phase, ΔtS−G2 vs. the logarithm of volume at G1/S transition (VG1/S) for HT29-hgem (N = 4). b Added volume in S-G2 phase, ΔVSG2 vs. volume at G1/S transition (VG1/S) for HT29-hgem (N = 4). c Duration of S-G2 phase, ΔtSG2 vs. the logarithm of volume at G1/S transition (VG−S) for HeLa-hgem (N = 2). d Added volume in S-G2 phase, ΔVSG2 vs. volume at G1/S transition (VG1/S) for HeLa-hgem (N = 2). e, f Added volume in S-G2, ΔVSG2 vs. added volume in G1 (VG1) for HT29-hgem (N = 4) (e) and HeLa-hgem (N = 2) (f). Dashed black line represents the slope expected in the case of a mechanistic adder where: ΔVSG2=〈ΔVTOT〉−ΔVG1 (slope of −1). g, h Added volume in the whole cell cycle ΔVTOT vs. volume at birth (Vbirth) for HT29-hgem (N = 4) (g) and HeLa-hgem (N = 2) (f). For all the plots in this figure, individual cell measures (dots) and median bins (squares) ± s.d. (bars) are shown. Solid line is a linear regression on the median bins weighted by the number of observations in each bin. See also Supplementary Figure 5
Fig. 6
Fig. 6
Size correction by growth-rate modulation in control and abnormal large Hela cells. a Examples of single-cell growth trajectories for HeLa-hgem cells, either control (‘ctrl’), or after washout from Roscovitine treatment (‘rosco’) as a function of time from birth. b Duration of G1, ΔtG1 as a function of the logarithm of volume at birth (Vbirth) for HeLa-hgem cells. Results from the linear fit: control: a = −4 ± 0.1, p = 1*10−90, R2 = 0.888, n = 199, N = 2; Roscovitine: a = 0 ± 0.2, R2 = 0.019, p = 1, n = 120, N = 3. Red dashed line and gray area are a visual guide for minimum G1 duration. Top: kernel estimates of volume at birth; control: 〈log Vbirth〉=7.37, n = 231, N = 2; Roscovitine: 〈log Vbirth〉=7.86, n = 136; Welch t test comparing the means: p = 2.2×10⁻¹⁶. Right: kernel estimates of ΔtG1; control: 〈ΔtG1〉=7.0 h., n = 201, N = 2; Roscovitine: 〈ΔtG1〉=6.1 h, n=124, N=3; Welch t test comparing the means: p=6.5×10⁻⁷. c Added volume in G1 (ΔVG1) vs. volume at birth for HeLa-hgem cells. Results from the linear fit: control: a = −0.25 ± 0.01, p = 1×10−46, R2 = 0.706, n = 178, N = 2; Roscovitine (red line): a = 0.1 ± 0.02, p = 0.1, R2 = 0.046, n = 108, N = 3. Dashed lines represent the median added volume in G1 for the control (〈ΔVG1〉=350 µm3, n = 178) and the Roscovitine (〈ΔVG1〉=390 µm3, n = 108) condition. Right: kernel estimates of ΔVG1. Welch’s t test comparing the mean added volume: p = 0.2423. d Instantaneous growth speed dv/dt in G1 as a function of volume, with bivariate kernel densities (concentric circles) and average bins for control (n = 119, N = 1) and Roscovitine (n = 49, N=2) conditions. Results from the linear fits, control: a=0.0489 ± 0.0005, p≈0, R2 = 0.78; Roscovitine: a = 0.047 ± 0.002, p = 1×10−137, R2 = 0.49. e Top: kernel density of volume at birth for control and Roscovitine treated HeLa-hgem cells grouped together. Bars represent the 20 and 80% percentiles and define three groups: cells within the 0–20% percentile (blue), 20–80% percentile (orange) and 80–100% percentile (green). Bottom: Same data as d but for the three groups analyzed separately. Results from the linear fits (lines) on the average bins (dots) for each group with nc (number of control cells) and nr (number of Rocovitine-treated cells): 0–20%: a = 0.119 ± 0.008, p = 4.1×10⁻⁵, R2 = 0.98, nc = 24, nr = 0; 20–80%: a = 0.072 ± 0.009, p = 4.88×10⁻⁵, R2 = 0.90, nc = 60, nr = 15; 80–100%: a = 0.05 ± 0.01, p = 0.00192, R2 = 0.43, nc = 3, nr = 24. For bd, control condition (‘ctrl’) is in gray and Roscovitine-treated condition (‘rosco’) is in red. Individual cell measures (dots) as well as median (c, d) or average (d) bins (ctrl: squares, rosco: triangles) and s.d. (bars) are shown. Solid lines shows linear regression on the bins weighted by the number of event in each bin. a is alsways given as slope ± standard error. See also Supplementary Figures 6 and 7, Supplementary Movie 4
Fig. 7
Fig. 7
Contribution of growth and time modulation in overall size control. a Replicative growth, log(Vmitosis/Vbirth) vs. logarithm of volume at birth log(Vbirth) for HT29-wt cells. The slope coefficient of the linear regression gives −λ and indicates the strength of the effective size control (−λ = −0.5 ± 0.002, R2 = 0.85, n = 132, N = 3). b Cell cycle duration τ vs. initial volume log(Vbirth) for HT29-wt cells. The slope coefficient of the linear regression gives −〈τ〉〈θ〉, with 〈τ〉 the average cell cycle duration and θ the strength of control by time modulation. A positive value of θ corresponds to a positive effect on size control (〈−τθ = −7 ± 0.2, R2 = 0.88, n = 163, N = 3. c Growth rate α vs. volume at birth log(Vbirth), for a dataset on bacteria from ref.. The slope coefficient of the linear regression gives −〈α〉〈γ〉, with 〈α〉 the average growth rate and γ the control due to growth rate modulations. A positive value of γ corresponds to a positive effect on size control (−〈αγ = −0.0005 ± 0.0002, R2 = 0.06, n = 2107). d Left: plot of θτ〉 〈α〉, vs. γτ〉 〈α〉 for the bacteria dataset shown in Fig. 7c. Positive values along both y and x axes correspond to a positive effect on size control via time or growth modulation respectively. Right: plot of θ multiplied by 〈G〉, the average replicative growth 〈G〉=〈log(Vmitosis)/log(Vbirth)〉, vs. γ multiplied by 〈G〉 for HT29-wt cells shown in a and b. e Comparison of datasets for bacteria (data from refs., –) and yeasts (data from refs., ), plotted as in d. Each point corresponds to a different growth condition (see Supplementary Fig. 8d). f Comparison of datasets for animal cells (our results and data from ref..), plotted as in Fig. 8d. a, b, c Dots are single-cell measurements, squares with error bars are median bins with s.d., and black lines show the linear regression performed on the median bins weighted by the number of observations in each bin. df The dashed lines indicate the threshold above which time modulation (horizontal line) and growth modulation (vertical line) have a positive effect on size control. Values are given as slope ± standard error.  See also Supplementary Figure 8

Similar articles

Cited by

References

    1. Ginzberg MB, Kafri R, Kirschner M. On being the right (cell) size. Science (80-.). 2015;348:1245075–1245075. doi: 10.1126/science.1245075. - DOI - PMC - PubMed
    1. Lloyd AC. The regulation of cell size. Cell. 2013;154:1194–205. doi: 10.1016/j.cell.2013.08.053. - DOI - PubMed
    1. Fantes PA. Control of cell size and cycle time in Schizosaccharomyces pombe. J. Cell. Sci. 1977;24:51–67. - PubMed
    1. Pan KZ, Saunders TE, Flor-Parra I, Howard M, Chang F. Cortical regulation of cell size by a sizer cdr2p. eLife. 2014;2014:e02040. doi: 10.7554/eLife.02040. - DOI - PMC - PubMed
    1. Amir A. Cell Size Regulation in Bacteria. Phys. Rev. Lett. 2014;112:208102. doi: 10.1103/PhysRevLett.112.208102. - DOI

Publication types