. 2018 Aug 16;9(1):3283.
doi: 10.1038/s41467-018-05783-4.

Single-particle mass spectrometry with arrays of frequency-addressed nanomechanical resonators

Affiliations

Single-particle mass spectrometry with arrays of frequency-addressed nanomechanical resonators

Eric Sage et al. Nat Commun. .

Abstract

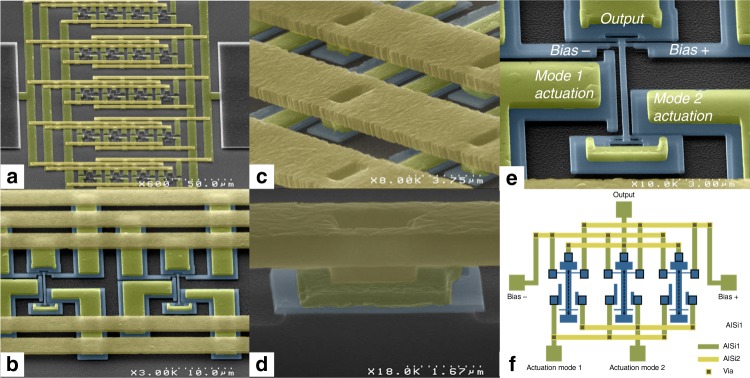
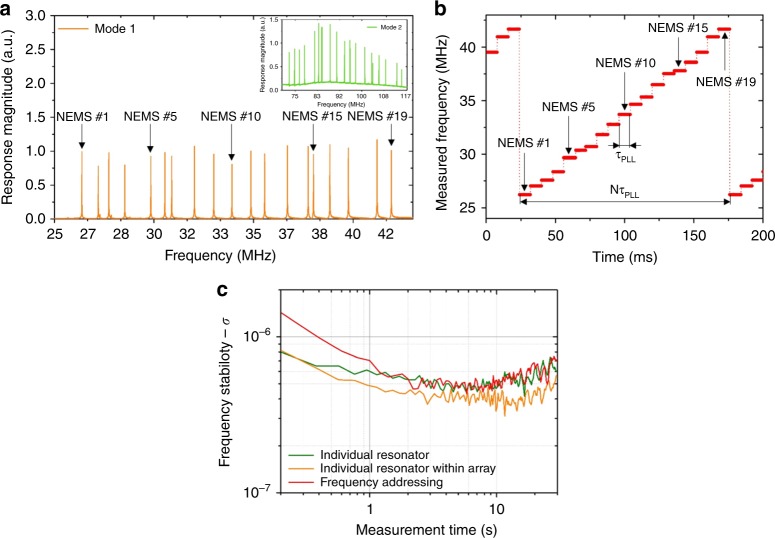
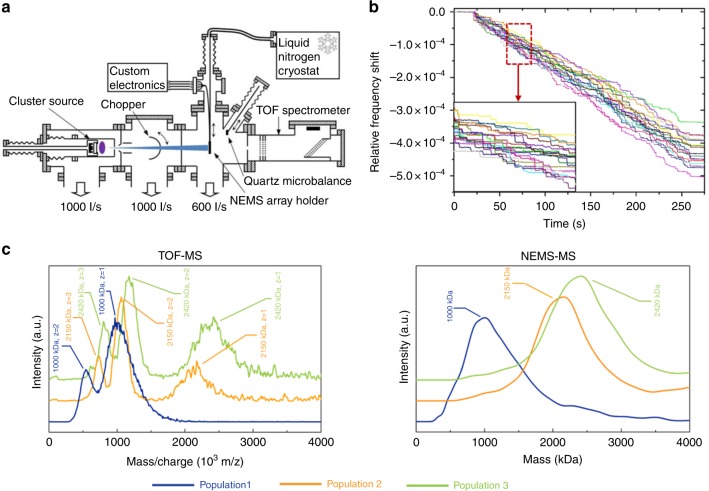
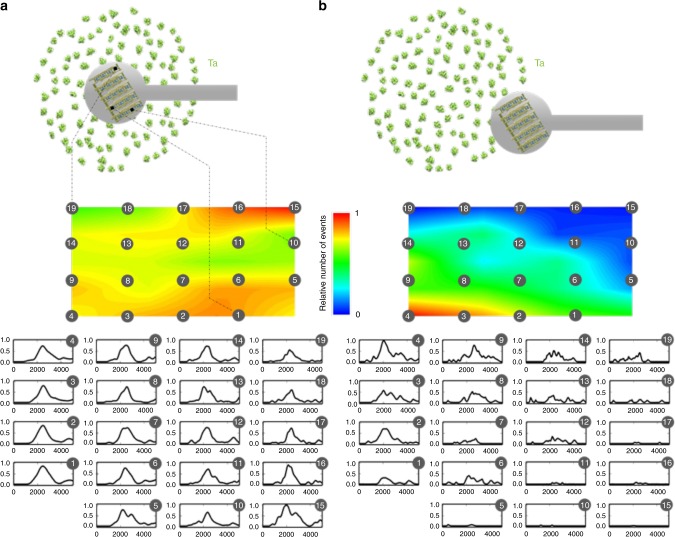
One of the main challenges to overcome to perform nanomechanical mass spectrometry analysis in a practical time frame stems from the size mismatch between the analyte beam and the small nanomechanical detector area. We report here the demonstration of mass spectrometry with arrays of 20 multiplexed nanomechanical resonators; each resonator is designed with a distinct resonance frequency which becomes its individual address. Mass spectra of metallic aggregates in the MDa range are acquired with more than one order of magnitude improvement in analysis time compared to individual resonators. A 20 NEMS array is probed in 150 ms with the same mass limit of detection as a single resonator. Spectra acquired with a conventional time-of-flight mass spectrometer in the same system show excellent agreement. We also demonstrate how mass spectrometry imaging at the single-particle level becomes possible by mapping a 4-cm-particle beam in the MDa range and above.


Conflict of interest statement

The authors declare no competing interests.

Figures

Fig. 1
Fig. 1
Array of nanomechanical resonators. SEM images of 5×4 NEMS array used for nanomechanical mass spectrometry. Typical horizontal and vertical pitches are 20 and 55 µm respectively. a General view of the array, b zoom on two resonators (silicon is false-colored in deep blue), and their metal interconnects (AlSi). c, d zoom-in on interconnects and via. The first metal level is colored in deep yellow, the second one in light yellow. e Typical doubly clamped in-plane resonator used in this study. The beams are designed to resonate around 30 MHz for mode 1 and 80 MHz for mode 2. Typical dimensions for the resonant beam are: 160 nm (thickness), 300 nm (width), and 5–10 µm (length). In-plane motion transduction is performed using piezoresistive nanogauges in a bridge configuration to allow background cancellation. Electrodes are specifically patterned for efficient mode 1 and mode 2 actuation. For a resonance frequency f0, bias voltages at f0+∆f are applied to both nanogauges (with 180° dephasing). Tension/compression in the gauges mix their resistance change to obtain a downmixed differential output voltage at ∆f, typically around a few 10’s of kHz. f Schematic of the interconnect layout. Each resonator has a unique beam length, hence a unique resonance frequency
Fig. 2
Fig. 2
Frequency-addressing technique. a An open loop response of an array of 20 NEMS is recorded for mode 1 and mode 2 (inset). Each peak corresponds to the resonance of a single NEMS resonator for which resonance frequency and phase reference can be used as an address. We are showing here an example with only 19 resonance peaks: one resonator in the array failed after a long period of operation, as confirmed by scanning electron microscopy (SEM) observation. Yet, the array as a whole could still be operated without performance degradation, demonstrating the robustness of the parallel architecture. b The resonance frequency of every single resonator in the array is sequentially monitored over time: a PLL locks onto a given resonator, registers its current resonance frequency after a given idling time τPLL (here 8 ms) and then switches to the next resonator. The duty cycle of a whole array is then PLL (here 152 ms with N = 19 NEMS). From the recorded data points, individual frequency time traces can be extracted, and their frequency stability calculated. c Frequency stabilities obtained using a single individual resonator (not in array, green), a resonator of strictly identical dimensions within an array without frequency addressing (yellow) and the same resonator with frequency addressing (red). See “Frequency stability measurements” in the “Methods” for details on the selected frequency stability estimator. The three plots appeared identical within measurement uncertainty: the parallel architecture of our arrays along with the frequency-addressing technique allows reaching the regime where frequency fluctuations set the frequency stability limit of our resonators, down to similar values as single resonators
Fig. 3
Fig. 3
Single-particle Mass Spectrometry with arrays of nanoresonators. a Schematic of the setup showing from left to right: the cluster source, an intermediate chamber containing a chopper, the deposition chamber and an in-line TOF mass spectrometer. Both NEMS holder and QCM were retractable, allowing for sequential NEMS-MS, TOF-MS, and QCM measurements with the same operating conditions. b Mode 1 relative frequency time traces of an array of 19 NEMS exposed to a flux of tantalum nanoclusters with a mean diameter of 7.2 nm. Inset: zoom-in with frequency jumps induced by single-particle deposition. c Comparison of TOF and NEMS-MS with an array of 19 resonators performed with three distinct populations of nanoclusters with mean diameters of 5.8 nm (~1000 kDa), 7.4 nm (~2150 kDa), and 7.7 nm (~2420 kDa), respectively
Fig. 4
Fig. 4
NEMS-MS beam imaging. The NEMS array is placed at the center of the particle beam (a) or at the edge (b). The event number is measured for each NEMS and plotted on interpolated surface maps for each case. Mass spectra obtained with each individual resonator for a 4 min acquisition are shown. A mechanical chopper is used to adapt the particle adsorption event rate to the array response time. The spectra are displayed as a matrix pattern reproducing the device physical layout (5×4). Each individual plot shows the intensity (a.u.) versus mass (kDa)

Similar articles

Cited by

References

    1. van Duijn E. Current limitations in native mass spectrometry based structural biology. J. Am. Soc. Mass. Spectrom. 2010;21:971–978. doi: 10.1016/j.jasms.2009.12.010. - DOI - PubMed
    1. Dove A. Mass spectrometry raises the bar. Science. 2010;328:920–922. doi: 10.1126/science.328.5980.920. - DOI
    1. Heberer T. Occurrence, fate, and removal of pharmaceutical residues in the aquatic environment: a review of recent research data. Toxicol. Lett. 2002;131:5–17. doi: 10.1016/S0378-4274(02)00041-3. - DOI - PubMed
    1. Robinson CV, Sali A, Baumeister W. The molecular sociology of the cell. Nature. 2007;450:973–982. doi: 10.1038/nature06523. - DOI - PubMed
    1. Joblin C, et al. Simulation of interstellar aromatic hydrocarbons using ion cyclotron resonance. preliminary results. Rapid Commun. Mass Spectrom. 1997;11:1619–1623. doi: 10.1002/(SICI)1097-0231(199709)11:14<1619::AID-RCM995>3.0.CO;2-P. - DOI

Publication types