. 2019 Jan;13(1):132-146.
doi: 10.1038/s41396-018-0248-0. Epub 2018 Aug 16.

Picoeukaryotes of the Micromonas genus: sentinels of a warming ocean

Affiliations

Picoeukaryotes of the Micromonas genus: sentinels of a warming ocean

David Demory et al. ISME J. 2019 Jan.

Abstract

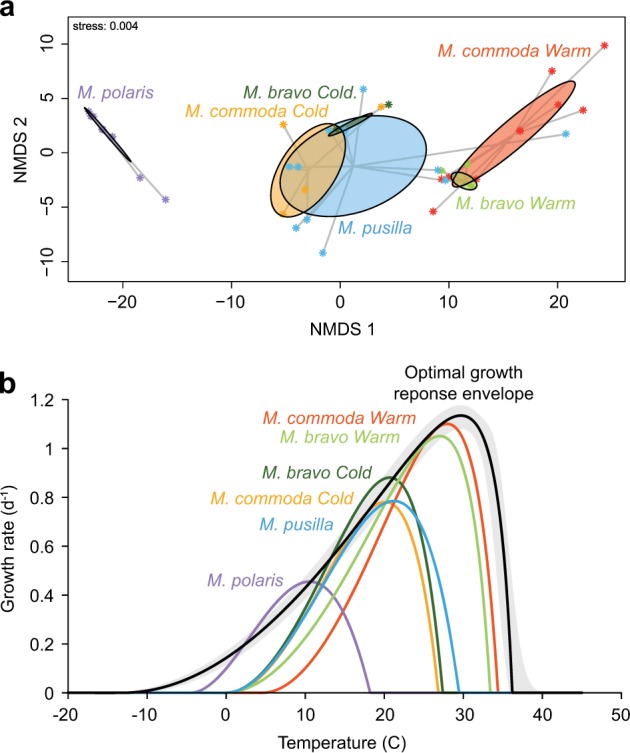
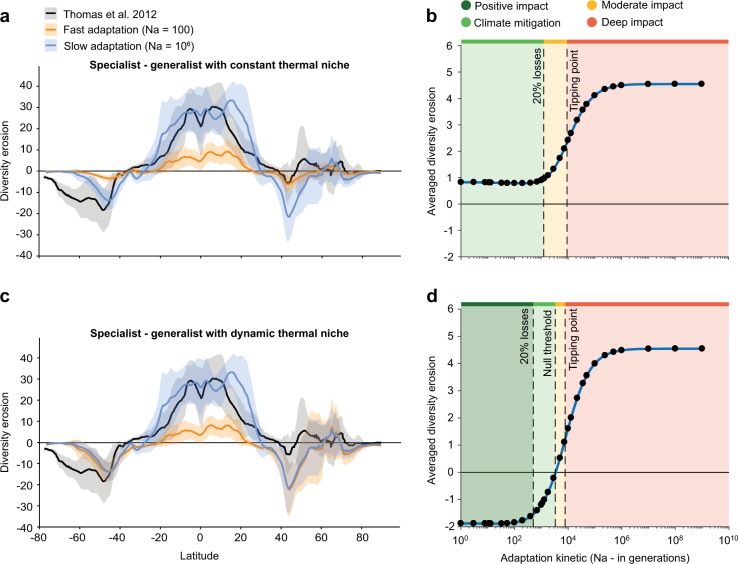
Photosynthetic picoeukaryotesx in the genus Micromonas show among the widest latitudinal distributions on Earth, experiencing large thermal gradients from poles to tropics. Micromonas comprises at least four different species often found in sympatry. While such ubiquity might suggest a wide thermal niche, the temperature response of the different strains is still unexplored, leaving many questions as for their ecological success over such diverse ecosystems. Using combined experiments and theory, we characterize the thermal response of eleven Micromonas strains belonging to four species. We demonstrate that the variety of specific responses to temperature in the Micromonas genus makes this environmental factor an ideal marker to describe its global distribution and diversity. We then propose a diversity model for the genus Micromonas, which proves to be representative of the whole phytoplankton diversity. This prominent primary producer is therefore a sentinel organism of phytoplankton diversity at the global scale. We use the diversity within Micromonas to anticipate the potential impact of global warming on oceanic phytoplankton. We develop a dynamic, adaptive model and run forecast simulations, exploring a range of adaptation time scales, to probe the likely responses to climate change. Results stress how biodiversity erosion depends on the ability of organisms to adapt rapidly to temperature increase.


Conflict of interest statement

The authors declare that they have no conflict of interest.

Figures

Fig. 1
Fig. 1
Micromonas growth response to temperature. a Location of isolation sites of the eleven Micromonas experimental strains used in this study, plotted against yearly average SST for the year 2014 (from NOAA). b Growth rate vs. temperature curves for strains isolated in environments with different annual average temperature T¯S, fitted by the BR model [31]. Error bars are standard deviations (n ≥ 3)
Fig. 2
Fig. 2
Original thermal environments and growth response to temperature for Micromonas species. a Two-dimensional ordination space derived from a non-metric multidimensional scaling (NMDS) procedure displaying the thermal dissimilarities site (TS-, T¯S, TS+ and TS+ − TS-) between the original isolation sites of the eleven experimental and 46 Micromonas collection strains. The stress value (goodness-of-fit of the NMDS) is inferior to 0.05, indicating high dimensional relationships among samples. b Average growth response to temperature for each phylogenetic group computed from 100,000 possible response curves simulated within the ranges observed in each phylogenetic group. The black line represents the overall, optimal growth response envelope [45] of Micromonas computed as μopt vs. Topt, where μopt and Topt are given by the average response of each thermotype. The grey shaded area is the standard deviation around μopt
Fig. 3
Fig. 3
Micromonas thermotypes relative abundance patterns as estimated from the 18S rRNA V9 region during the Tara Oceans cruise. a Map of the Tara Oceans transect (dashed black line)showing station for which 18S rRNA V9 region data were available from Vargas et al. [27]: Mediterranean Sea (Med S), Red Sea (Red S), Indian Ocean (Ind O), South Pacific Ocean (S Pac O), Southern Ocean (S O) and South Atlantic Ocean (S Atl O). b Two-dimensional ordination space derived from an NMDS analysis displaying Bray-Curtis distance between the Micromonas species assemblages of the Tara Oceans stations, fitted by significant environmental variable (p-value < 0.05). The stress value (goodness-of-fit of the NMDS) is 0.15, indicating fair dimensional relationships among samples. c Relative abundance of the 6 thermotypes per station, plotted according to yearly SST at station coordinates: data (circles) and polynomial regression (solid line) fitted with the 95% confidence interval (shaded area). Number of observations for the six thermotypes are represented in histograms, plotted according to yearly SST at station coordinates
Fig. 4
Fig. 4
Estimated and predicted interspecific diversity within the Micromonas genus in the global ocean. a Estimated and predicted interspecific diversity within the Micromonas genus along the Tara Oceans transect as estimated from the Micromonas OTUs read abundances (blue circles) and as predicted from our diversity model (red circles), fitted by a polynomial regression with a 95% confidence interval. b Thermotypes proportions (%) from Tara Oceans dataset for different oceanic regions: Mediterranean Sea (Med S), Red Sea (Red S), Indian Ocean (Ind O), South Pacific Ocean (S Pac O), Southern Ocean (S O) and South Atlantic Ocean (S Atl O). c Predicted Shannon diversity index (H) calculated with the Eq. (18) using annual averages SST (Copernicus Marine Environment Monitoring Service, 1993 to 2012 satellite data). d Comparison of the latitudinal average diversity for all phytoplankton (from Thomas et al. [3]. black line) with that estimated by our Micromonas model. Shaded area represents the standard deviation from the mean along latitudes
Fig. 5
Fig. 5
Micromonas diversity changes in a warming ocean for two evolution hypotheses: ab Specialist-generalist with constant thermal niche and cd Specialist-generalist with dynamical thermal niche. ab Latitudinal averaged diversity erosion calculated as the difference between diversity in present period (2001–2010) and future (2091–2100). Black line represents the diversity erosion from Thomas et al. [3], red and blue line are the diversity erosion for the fast adaptation scenario (Na = 100) and slow adaptation scenario (Na = 106) respectively. Filled area represent the standard deviation to the mean along latitude. c, d Averaged diversity erosion per latitude calculated for different adaptation kinetic (from Na = 1 to Na = 106 generations): model results (black circles) and polynomial regression (blue line) fitted. The Tipping point is calculated as the inflexion point for the derivative of blue curve. The 20% loss point is calculated as 20% evolution from the lowest erosion scenario (Na = 1)

References

    1. Pachauri RK, Allen MR, Barros VR, Broome J, Cramer W, Christ R, et al. Climate change 2014: synthesis Report. Contribution of working groups I, II and III to the fifth assessment report of the intergovernmental panel on climate change. IPCC; 2014. https://www.springer.com/us/book/9780387981413
    1. Sabine CL, Feely RA, Gruber N, Key RM, Lee K, Bullister JL, et al. The oceanic sink for anthropogenic CO2. Science. 2004;305:367–71. doi: 10.1126/science.1097403. - DOI - PubMed
    1. Thomas MK, Kremer CT, Klausmeier CA, Litchman E. A global pattern of thermal adaptation in marine phytoplankton. Science. 2012;338:1085–8. doi: 10.1126/science.1224836. - DOI - PubMed
    1. Irwin AJ, Finkel ZV, Muller-Karger FE, Troccoli Ghinaglia L. Phytoplankton adapt to changing ocean environments. PNAS. 2015;112:5762–6. doi: 10.1073/pnas.1414752112. - DOI - PMC - PubMed
    1. Reid PC, Fisher AC, Lewis-Brown E, Meredith MP, Sparrow M, Andersson AJ, et al. Impacts of the oceans on climate change. Adv Mar Biol. 2009;56:1–150. doi: 10.1016/S0065-2881(09)56001-4. - DOI - PubMed

Publication types