. 2018 Aug 2:9:1179597218790250.
doi: 10.1177/1179597218790250. eCollection 2018.

Granular Cell Tumor Imaging Using Optical Coherence Tomography

Affiliations

Granular Cell Tumor Imaging Using Optical Coherence Tomography

David Tes et al. Biomed Eng Comput Biol. .

Abstract

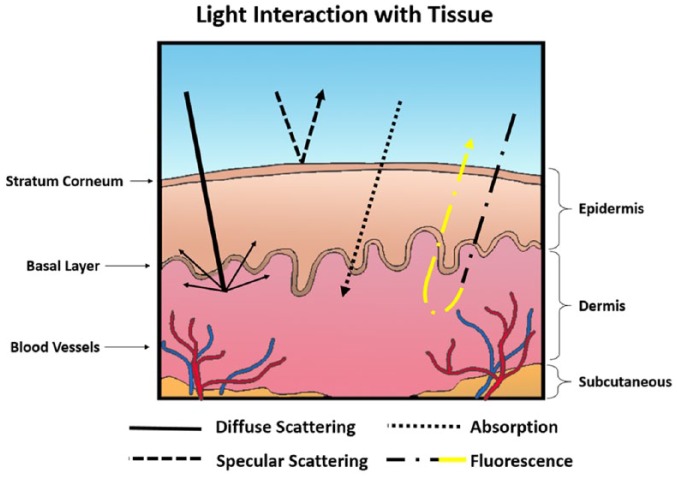
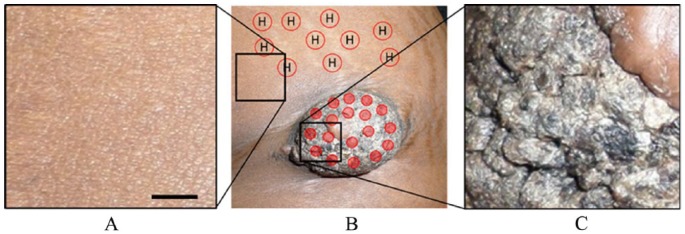
Background: Granular cell tumor (GCT) is a relatively uncommon tumor that may affect the skin. The tumor can develop anywhere on the body, although it is predominately seen in oral cavities and in the head and neck regions. Here, we present the results of optical coherence tomography (OCT) imaging of a large GCT located on the abdomen of a patient. We also present an analytical method to differentiate between healthy tissue and GCT tissues.

Materials and methods: A multibeam, Fourier domain, swept source OCT was used for imaging. The OCT had a central wavelength of 1305 ± 15 nm and lateral and axial resolutions of 7.5 and 10 µm, respectively. Qualitative and quantitative analyses of the tumor and healthy skin are reported.

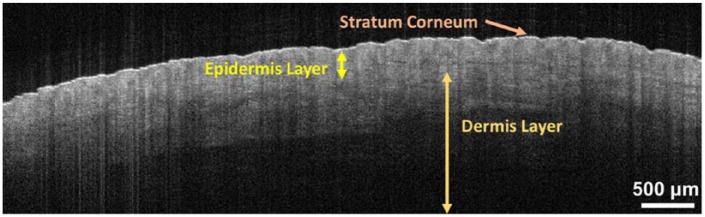
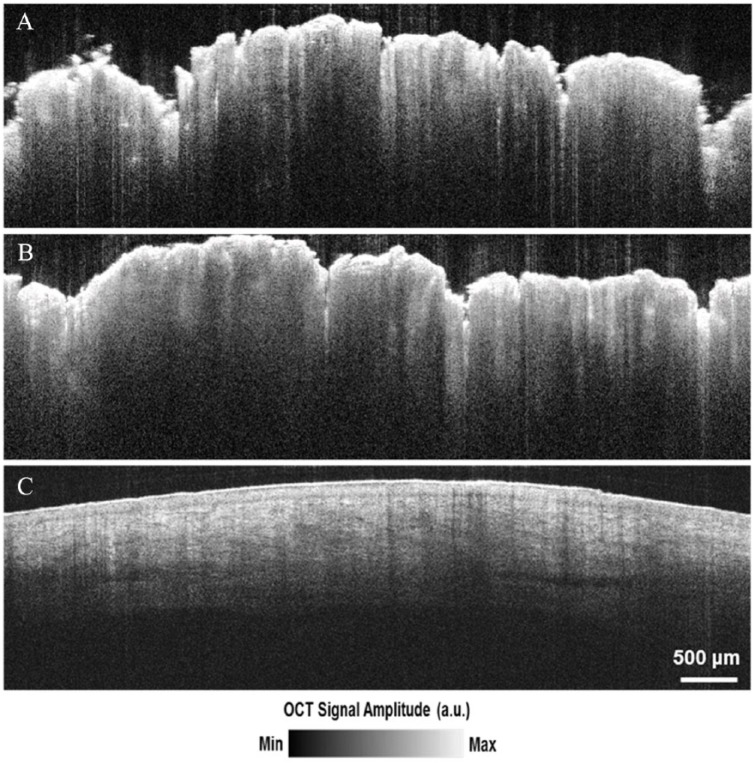
Results: Abrupt changes in architectures of the dermal and epidermal layers in the GCT lesion were observed. These architectural changes were not observed in healthy skin.

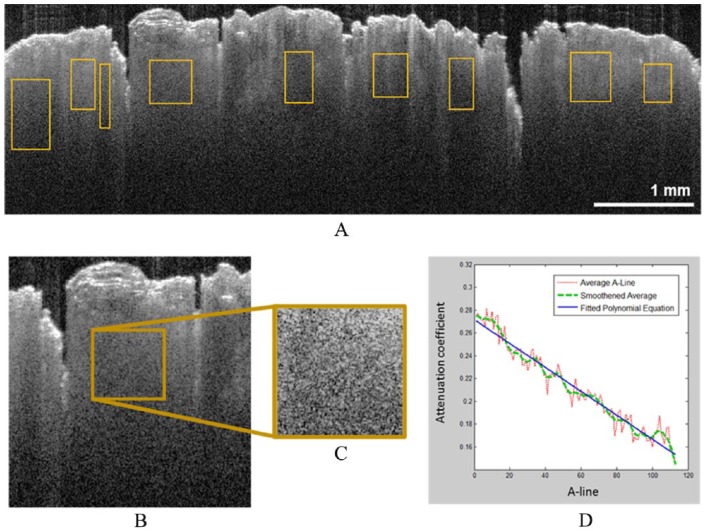
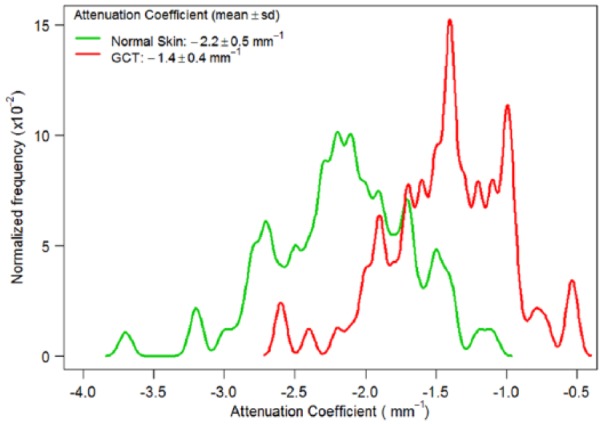
Discussion: To quantitatively differentiate healthy skin from tumor regions, an optical attenuation coefficient analysis based on single-scattering formulation was performed. The methodology introduced here could have the capability to delineate boundaries of a tumor prior to surgical excision.

Keywords: Optical coherence tomography; attenuation coefficient; granular cell tumor; image analysis; image processing; tumor border detection.


Conflict of interest statement

Declaration of conflicting interests:The author(s) declared no potential conflicts of interest with respect to the research, authorship, and/or publication of this article.

Figures

Figure 1.
Figure 1.
Interaction of light with tissue compartments. Here, we demonstrate 4 events that can occur including diffuse scattering, specular scattering, absorption, and florescence.
Figure 2.
Figure 2.
A typical optical coherence tomography image of the dorsal hand skin. The multiple layers of the skin (stratum corneum, epidermis, and dermis) are clearly visible and are labeled. The scale of the image has been modified to match the size of the page.
Figure 3.
Figure 3.
Attenuation coefficient calculation in OCT images: (A) regions of interest in an OCT image, (B and C) one enlarged region of interest determined in (A) and outlined in brown. (D) Plots from the enlarged region of interest in (B): the average of 100+ A-lines, smoothed average A-line, and the polynomial linear line that is fitted to them. In (D), the OCT signal axis has been normalized, and the depth is represented relative to the true scale of the OCT image in (A). OCT indicates optical coherence tomography.
Figure 4.
Figure 4.
Photograph showing the GCT lesion in the left iliac region with some healthy regions around it. Photograph of the (A) healthy region indicated in (B) with the black square in left, (B) GCT and some surrounding healthy regions, (C) a part of the GCT indicated in (B) with the right black square. Solid red dots in (B) are the imaging location on the lesion while circles with an “H” represent the healthy skin chosen as a reference. The scale bar is 23 mm. GCT indicates granular cell tumor.
Figure 5.
Figure 5.
OCT images of (A and B) GCT lesion, and (C) healthy skin. Irregularity of epidermis (A and B) caused by verrucous seborrheic keratosis lying on top of the GCT lesion. GCT indicates granular cell tumor; OCT, optical coherence tomography.
Figure 6.
Figure 6.
Density plot of attenuation coefficients calculated for healthy skin and GCT. GCT indicates granular cell tumor.
Figure 7.
Figure 7.
Histological images of the granular cell tumor corresponding to the lesion depicted in Figure 3. (A) hematoxylin-eosin stain at ×100 magnification, also outlining the region (B) at 400× magnification. The lesional cells containing abundant cytoplasm with tiny eosinophilic cytoplasmic granules and perivascular lymphocytic infiltrate is seen. (C) S-100 stain at ×100 magnification of the same sample, also outlining the region (D) at ×400 magnification. The S-100 stain demonstrates cytoplasmic and nuclear positivity. The scale bar is 65 µm.

Similar articles

Cited by

References

    1. Adeniran A, Al-Ahmadie H, Mahoney MC, Robinson-Smith TM. Granular cell tumor of the breast: a series of 17 cases and review of the literature. Breast J. 2004;10:528–531. doi:10.1111/j.1075-122X.2004.21525.x. - DOI - PubMed
    1. Gogas J, Markopoulos C, Kouskos E, et al. Granular cell tumor of the breast: a rare lesion resembling breast cancer. Eur J Gynaecol Oncol. 2002;23:333–334. http://www.ncbi.nlm.nih.gov/pubmed/12214737. Accessed September 9, 2017. - PubMed
    1. De Simone N, Aggon A, Christy C. Granular cell tumor of the breast: clinical and pathologic characteristics of a rare case in a 14-year-old girl. J Clin Oncol. 2011;29:e656–e657. doi:10.1200/JCO.2011.35.9448. - DOI - PubMed
    1. McGuire L, Yakoub D, Möller M. Malignant granular cell tumor of the back: a case report and review of the literature. Case Rep Med. 2014;2014:794648 https://www.hindawi.com/journals/crim/2014/794648/abs/. Accessed September 9, 2017. - PMC - PubMed
    1. Brinster N, Liu V, Diwan H, McKee P. Dermatopathology: A Volume in the High Yield Pathology Series. Philadelphia, PA: Elsevier; 2011.