. 2018 Aug 2:9:807.
doi: 10.3389/fphar.2018.00807. eCollection 2018.

Inhibitory Effect of Anoectochilus formosanus Extract on Hyperglycemia-Related PD-L1 Expression and Cancer Proliferation

Affiliations

Inhibitory Effect of Anoectochilus formosanus Extract on Hyperglycemia-Related PD-L1 Expression and Cancer Proliferation

Yih Ho et al. Front Pharmacol. .

Abstract

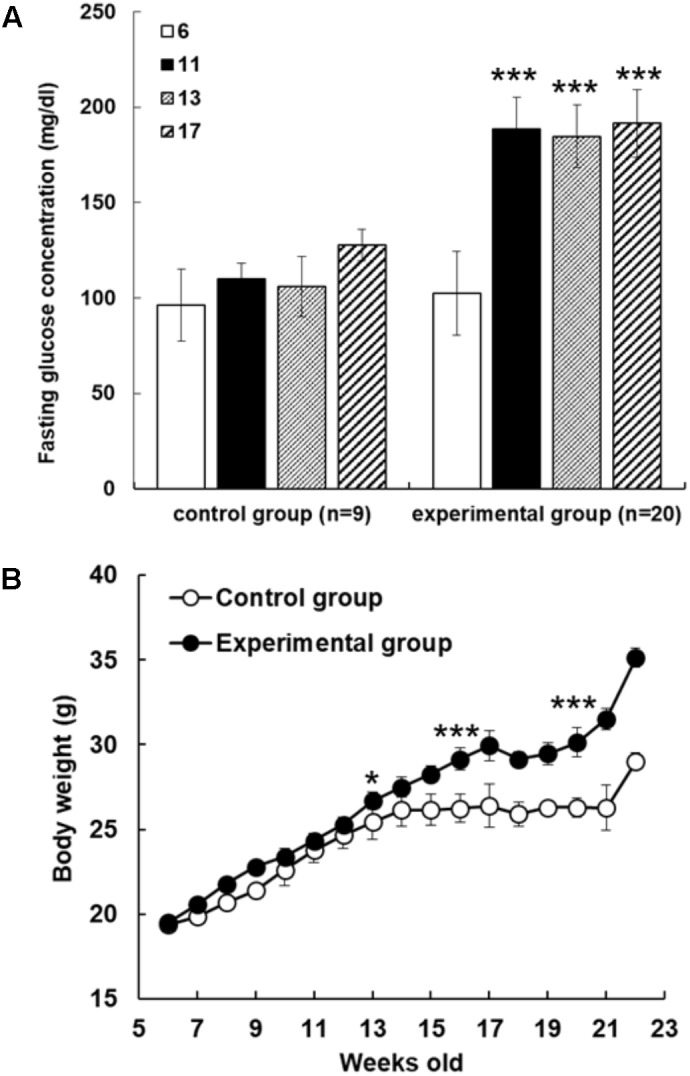
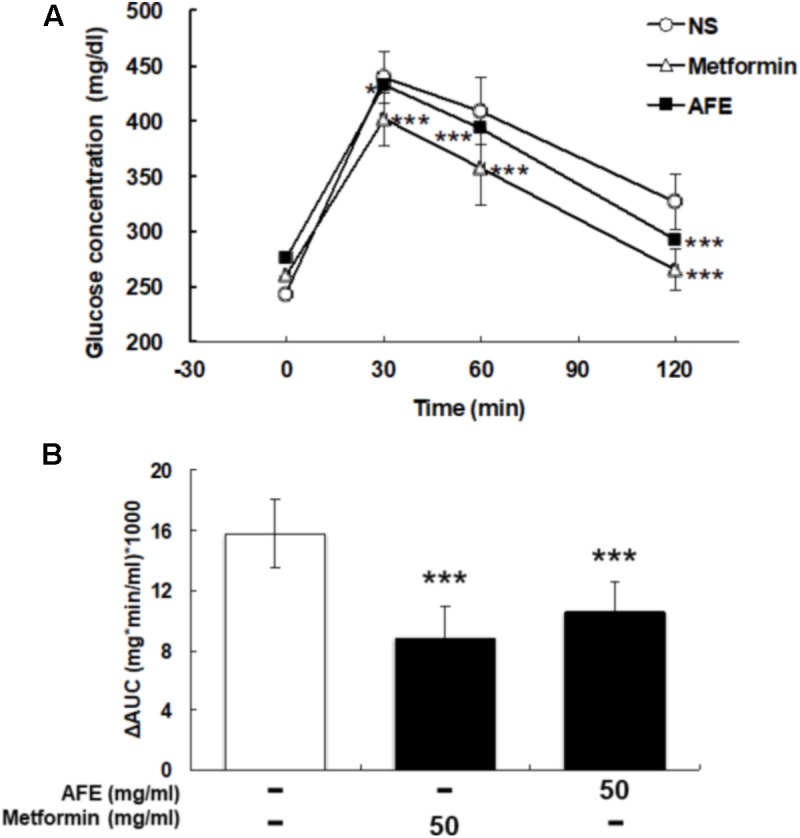
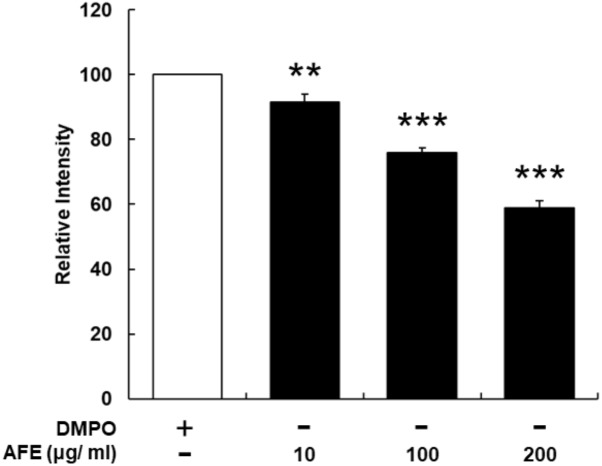
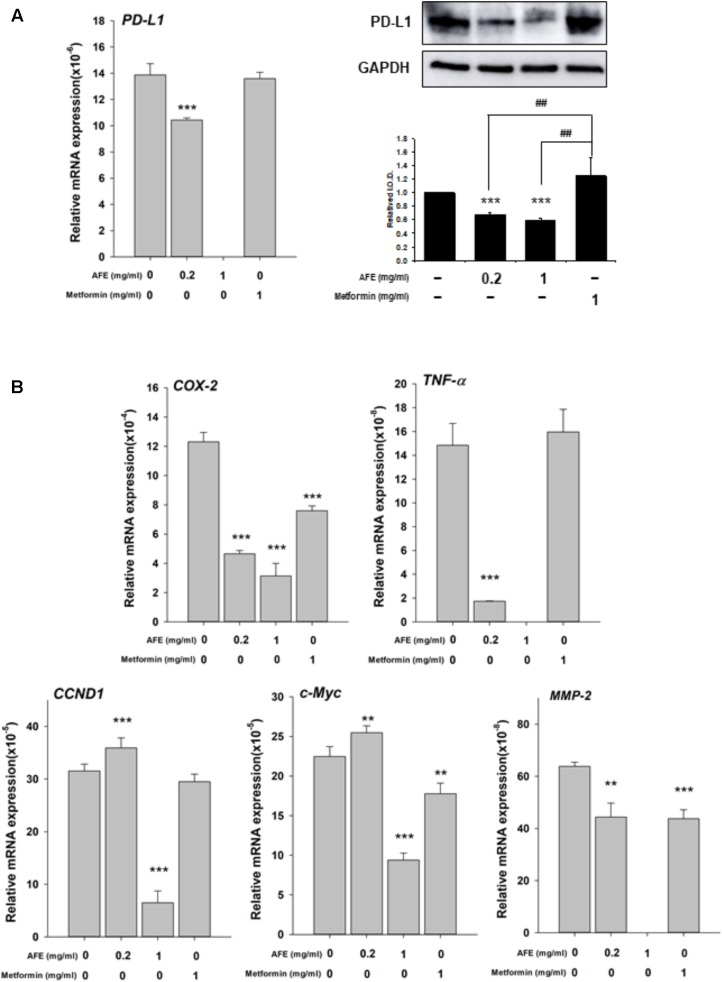
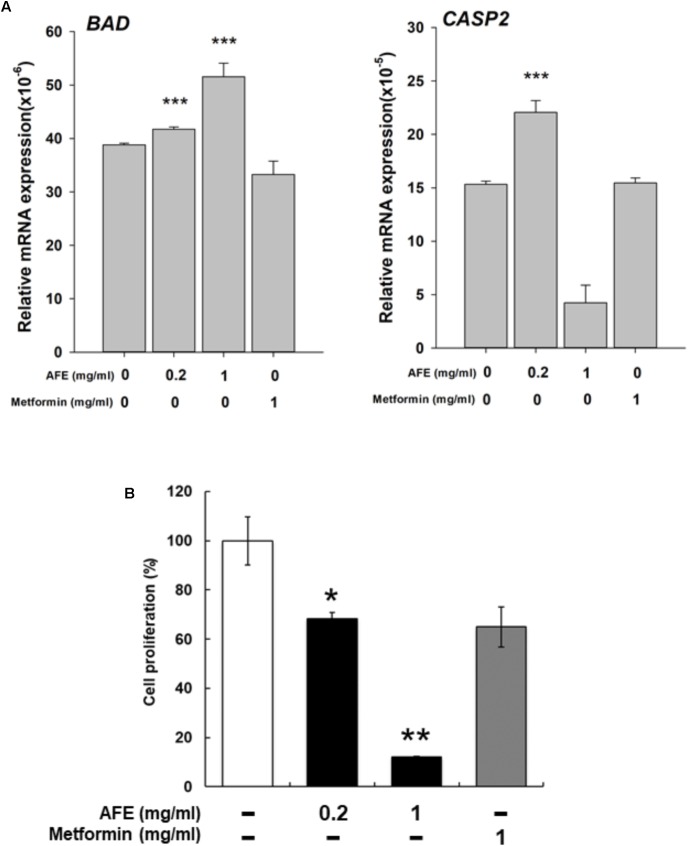
Traditional herb medicine, golden thread (Anoectochilus formosanus Hayata) has been used to treat various diseases. Hyperglycemia induces generation of reactive oxygen species (ROS) and enhancement of oxidative stress which are risk factors for cancer progression and metastasis. In this study, we evaluated hypoglycemic effect of A. formosanus extracts (AFEs) in an inducible hyperglycemia animal model and its capacity of free-radical scavenging to establish hyperglycemia-related carcinogenesis. AFE reduced blood glucose in hyperglycemic mice while there was no change in control group. The incremental area under blood glucose response curve was decreased significantly in hyperglycemic mice treated with AFE in a dose-dependent manner. AFE and metformin at the same administrated dose of 50 mg/kg showed similar effect on intraperitoneal glucose tolerance test in hyperglycemic mice. Free-radical scavenger capacity of AFE was concentration dependent and 200 μg/ml of AFE was able to reduce more than 41% of the free radical. Treatment of cancer cells with AFE inhibited constitutive PD-L1 expression and its protein accumulation. It also induced expression of pro-apoptotic genes but inhibited proliferative and metastatic genes. In addition, it induced anti-proliferation in cancer cells. The results suggested that AFE not only reduced blood glucose concentration as metformin but also showed its potential use in cancer immune chemoprevention/therapy via hypoglycemic effect, ROS scavenging and PD-L1 suppression.

Keywords: PD-L1; anti-proliferation; cancer; hyperglycemia; metformin.


Figures

FIGURE 1
FIGURE 1
Fructose-induced hyperglycemia affects fasting glucose concentrations and body weight. (A) The mice were assigned randomly to control and experimental groups at 6 weeks of age. Fructose-induced hyperglycemia was conducted for 16 weeks before AFE experiment. Fasting blood glucose concentration was measured at different time points as indicated (6, 11, 13, and 17 weeks of age). Concentrations of fasting blood glucose were higher in fructose-induced hyperglycemic mice than those in non-hyperglycemic mice. Numbers of independent studies (n = 20), ∗∗∗p < 0.001, as compared with paralleled untreated controls (n = 9). (B) Body weights were measured periodically for the control group and fructose-feeding group for 16 weeks. The resulted body weight changes showed that mice in experimental group became obese after being fed with high fructose water for 2 months. The significant difference was shown at 13 weeks age, p < 0.05, and after then ∗∗∗p < 0.001 as compared to control group.
FIGURE 2
FIGURE 2
Anoectochilus formosanus extract reduces blood glucose in hyperglycemic but not in control mice. Hyperglycemic mice were injected with different dosages of AFE intraperitoneally. Glucose was injected intraperitoneally immediately after AFE administration. Blood glucose was measured at 0, 30, 60, and 120 min after glucose administration. (A) The time courses of blood glucose concentration measured in fructose-induced hyperglycemic mice treated with different dosages of AFE (10 to 50 mg/kg). NS: treated with normal saline; A10: treated with AFE 10 mg/kg; A25: treated with AFE 25 mg/kg; A50: treated with AFE 50 mg/kg. Data are shown as mean ± SD (n = 16). (B) Measurement of the area under the incremental blood glucose concentration curve in the glucose tolerance test of the experimental group mice. –: treated with normal saline as control; 10: treated with AFE 10 mg/kg; 25: treated with AFE 25 mg/kg; 50: treated with AFE 50 mg/kg. Data are shown as mean ± SD of each group of four animals random cross over four times, analysis by one-way ANOVA test. ∗∗p < 0.01, ∗∗∗p < 0.001 as compared with untreated control. aAFF 10 vs. 50 mg/kg, p < 0.001; bAFF 25 vs. 10 mg/kg, p < 0.05; cAFF 50 vs. 25 mg/kg, p < 0.05. Glucose was injected intraperitoneally after AFE administration in non-hyperglycemic mice. Blood glucose was measured at 0, 30, 60, and 120 min after glucose administration. (C) Time courses of blood glucose concentration measured in non-hyperglycemic mice treated with different dosages of AFE (10 to 50 mg/kg). NS: normal saline; A10: treated with AFE 10 mg/kg; A25: treated with AFE 25 mg/kg; A50: treated with AFE 50 mg/kg. Data are shown as mean ± SD (n = 8). (D) Measurement of the area under the incremental blood glucose concentration curve in the glucose tolerance test of non-hyperglycemic mice. –: treated with normal saline as control; 10: treated with AFE 10 mg/kg; 25: treated with AFE 25 mg/kg; 50: treated with AFE 50 mg/kg. Data are shown as mean ± SD, analysis by one-way ANOVA test (n = 8).
FIGURE 3
FIGURE 3
Effect of AFE-reduced blood glucose is comparable to that of metformin in hyperglycemic mice. Hyperglycemic mice were injected with metformin (50 mg/kg) or AFE (50 mg/kg) intraperitoneally. Glucose was injected intraperitoneally after metformin or AFE administration. Blood glucose was measured at 0, 30, 60, and 120 min after glucose administration. (A) The time courses of blood glucose concentration measured in fructose-induced hyperglycemic mice treated with metformin and AFE (50 mg/kg). NS: treated with normal saline as control. Data are shown as mean ± SD (n = 16). p < 0.05, ∗∗∗p < 0.001, compared to untreated control group. (B) Measurement of the area under the incremental blood glucose concentration curve in the glucose tolerance test of the experimental group mice. –: treated with normal saline as control; 50: treated with metformin or AFE 50 mg/kg. Data are shown as mean ± SD of each group (n = 16), analysis by one-way ANOVA test. ∗∗∗p < 0.001 as compared with untreated control.
FIGURE 4
FIGURE 4
Anoectochilus formosanus extract processes an ability of free radical scavenging. The AFE-induced free radical-scavenging assay was conducted as described in the Section “Materials and Methods.” The free radical scavenging ability was in a concentration-dependent manner. n = 3, ∗∗p < 0.01, ∗∗∗p < 0.001 as compared with control (DMPO).
FIGURE 5
FIGURE 5
Anoectochilus formosanus extract inhibits expression of PD-L1, inflammatory and proliferative genes in oral cancer SCC25 cells. SCC-25 cells were treated with different concentrations of AFE or metformin with refreshed media with agents daily for 3 days. Total RNA and protein were extracted. qPCR and Western blotting analysis were performed for (A) PD-L1 (left hand panel) and PD-L1 protein (right-hand panel). (B) Parallel studies were conducted as described in (A). Total RNA was extracted and qPCR was performed for COX-2, TNF-α, CCND-1, c-Myc, and MMP-2. Numbers of independent studies (n = 3) ∗∗p < 0.01, ∗∗∗p < 0.001, as compared with control. ##p < 0.01, as compared with metformin.
FIGURE 6
FIGURE 6
Anoectochilus formosanus extract regulates expression of anti-proliferative genes and cell proliferation in oral cancer SCC25 cells. SCC-25 cells were treated with different concentrations of AFE or metformin with refreshed media with agents daily for 3 days. (A) Total RNA was extracted and qPCR was performed for BAD and CAPS2. n = 3 ∗∗∗p < 0.001 as compared with control. (B) SCC-25 cells were treated with AFE (0.2 and 1 mg/ml) or metformin (1 mg/ml) with refreshed media with agents daily for 3 days. AFE induced anti-proliferation. –: treated with normal saline as control; n = 3 p < 0.05, ∗∗p < 0.01 as compared with control.
FIGURE 7
FIGURE 7
Mechanism involved in Anoectochilus formosanus extract-induced anti-proliferation in cancer cells. Hyperglycemia modulates expression of inflammatory genes and increases ROS accumulation. A. formosanus extract can reduce ROS accumulation and inhibits PD-L1 expression and further block expression of inflammatory, proliferative, and metastatic genes. All of them are important for anti-proliferation in cancer cells.

Similar articles

Cited by

References

    1. Agrawal N. K., Kant S. (2014). Targeting inflammation in diabetes: newer therapeutic options. World J. Diabetes 5 697–710. 10.4239/wjd.v5.i5.697 - DOI - PMC - PubMed
    1. Anisimov V. N. (2016). Metformin for prevention and treatment of colon cancer: a reappraisal of experimental and clinical data. Curr. Drug Targets 17 439–446. 10.2174/1389450116666150309113305 - DOI - PubMed
    1. Cade W. T. (2008). Diabetes-related microvascular and macrovascular diseases in the physical therapy setting. Phys. Ther. 88 1322–1335. 10.2522/ptj.20080008 - DOI - PMC - PubMed
    1. Cao L., Chen X., Xiao X., Ma Q., Li W. (2016). Resveratrol inhibits hyperglycemia-driven ROS-induced invasion and migration of pancreatic cancer cells via suppression of the ERK and p38 MAPK signaling pathways. Int. J. Oncol. 49 735–743. 10.3892/ijo.2016.3559 - DOI - PubMed
    1. Chin Y. T., Wei P. L., Ho Y., Nana A. W., Changou C. A., Chen Y. R., et al. (2018). Thyroxine inhibits resveratrol-caused apoptosis by PD-L1 in ovarian cancer cells. Endocr. Relat. Cancer 25 533–545. 10.1530/ERC-17-0376 - DOI - PubMed