. 2018 Aug 2:9:1031.
doi: 10.3389/fphys.2018.01031. eCollection 2018.

The Muscle Fiber Profiles, Mitochondrial Content, and Enzyme Activities of the Exceptionally Well-Trained Arm and Leg Muscles of Elite Cross-Country Skiers

Affiliations

The Muscle Fiber Profiles, Mitochondrial Content, and Enzyme Activities of the Exceptionally Well-Trained Arm and Leg Muscles of Elite Cross-Country Skiers

Niels Ørtenblad et al. Front Physiol. .

Abstract

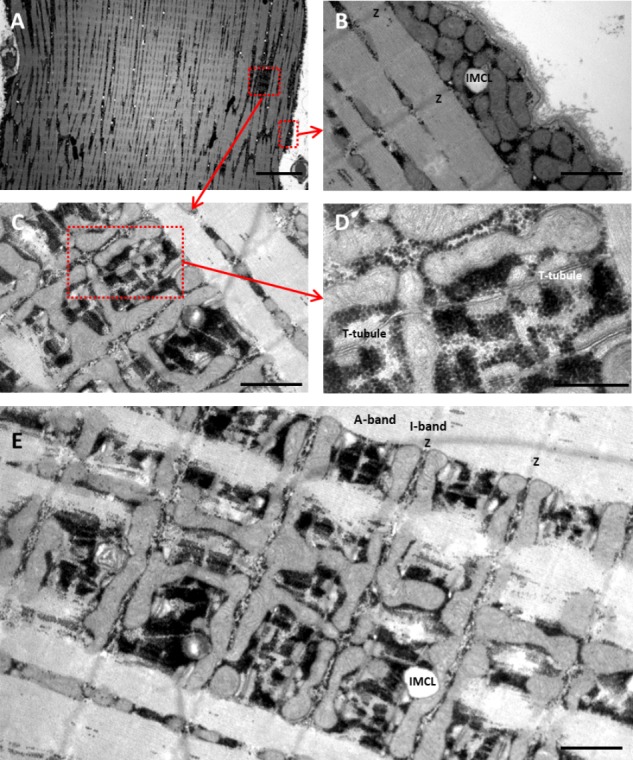
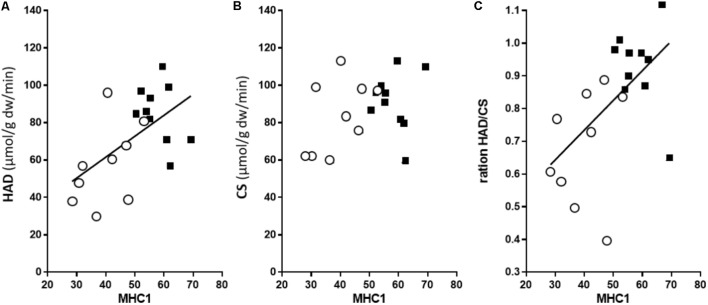
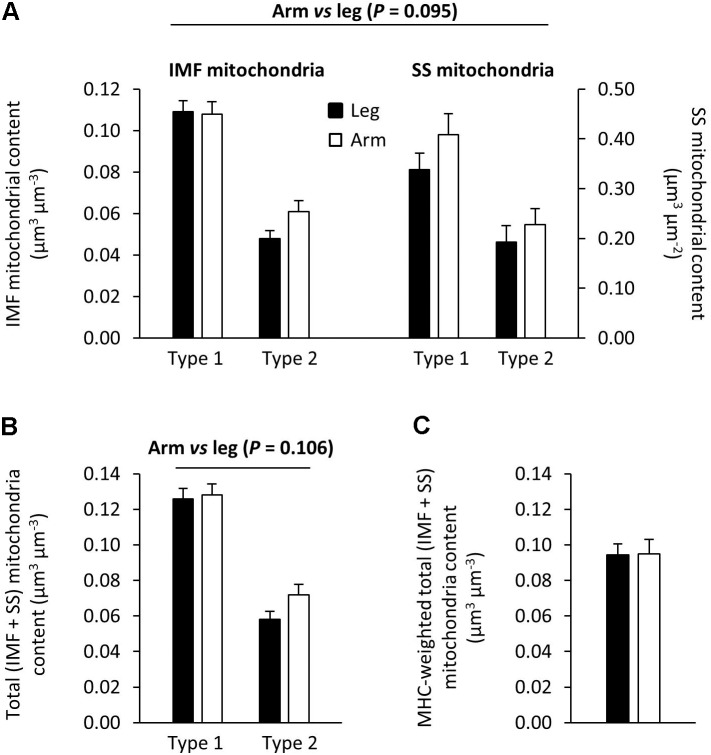
As one of the most physically demanding sports in the Olympic Games, cross-country skiing poses considerable challenges with respect to both force generation and endurance during the combined upper- and lower-body effort of varying intensity and duration. The isoforms of myosin in skeletal muscle have long been considered not only to define the contractile properties, but also to determine metabolic capacities. The current investigation was designed to explore the relationship between these isoforms and metabolic profiles in the arms (triceps brachii) and legs (vastus lateralis) as well as the range of training responses in the muscle fibers of elite cross-country skiers with equally and exceptionally well-trained upper and lower bodies. The proportion of myosin heavy chain (MHC)-1 was higher in the leg (58 ± 2% [34-69%]) than arm (40 ± 3% [24-57%]), although the mitochondrial volume percentages [8.6 ± 1.6 (leg) and 9.0 ± 2.0 (arm)], and average number of capillaries per fiber [5.8 ± 0.8 (leg) and 6.3 ± 0.3 (arm)] were the same. In these comparable highly trained leg and arm muscles, the maximal citrate synthase (CS) activity was the same. Still, 3-hydroxy-acyl-CoA-dehydrogenase (HAD) capacity was 52% higher (P < 0.05) in the leg compared to arm muscles, suggesting a relatively higher capacity for lipid oxidation in leg muscle, which cannot be explained by the different fiber type distributions. For both limbs combined, HAD activity was correlated with the content of MHC-1 (r2 = 0.32, P = 0.011), whereas CS activity was not. Thus, in these highly trained cross-country skiers capillarization of and mitochondrial volume in type 2 fiber can be at least as high as in type 1 fibers, indicating a divergence between fiber type pattern and aerobic metabolic capacity. The considerable variability in oxidative metabolism with similar MHC profiles provides a new perspective on exercise training. Furthermore, the clear differences between equally well-trained arm and leg muscles regarding HAD activity cannot be explained by training status or MHC distribution, thereby indicating an intrinsic metabolic difference between the upper and lower body. Moreover, trained type 1 and type 2A muscle fibers exhibited similar aerobic capacity regardless of whether they were located in an arm or leg muscle.

Keywords: IMCL; capillarization; cross-country skiing; fiber plasticity; limb muscles; mitochondria; training.


Figures

FIGURE 1
FIGURE 1
TEM images showing the subcellular localization of skeletal muscle mitochondria. All images are from leg muscle (vastus lateralis). (A) Overview of a part of fiber showing the myofibrillar (Myo) space and subsarcolemmal (SS) space. (B) The typical localization of SS mitochondria (mit) in skeletal muscle, also showing a intramyocellular lipid (IMCL). (C) In the Myo space, intermyofibrillar mitochondria are wrapped around the myofibrils, mainly in the I-band and often connected to an adjacent mitochondrion through the A-band. There is less marked connection between neighboring mitochondria in the I-band. (D) Intermyofibrillar mitochondria in the I-band on each side of the Z-line, with the t-tubular system (t-system) and mitochondria intertwined. (E) Overview demonstrating the IMF mitochondria are mainly located in the I-band on each side of the z-line and often connected to an adjacent mitochondrion in the same sarcomere through the A-band. All the gray structures in the fiber are mitochondria with slightly visible inner cristae. Glycogen granules can be seen as black dots. Z, Z-line; A, A-band; IMCL, intramyocellular lipid; T-tubule, transverse tubular system. Scale bar: A, 10 μm; B,C, 1 μm; D, 0.5 μm; E, 1 μm. Original magnification: A, x1,600; B,C, x20,000; D, x50,000; E, x13,000.
FIGURE 2
FIGURE 2
The relationships between the percentage of MHC-1 and 3-hydroxyacyl-CoA dehydrogenase activity (HAD, n = 10) (A); citrate synthase activity (CS, n = 9) (B); and relative capacity to oxidize fat (HAD/CS ratio) (C). The open circles depict data for the arms and the leg black squares for the legs. For the arm and leg combined, there was a significant correlation between the MHC-1 content and HAD activity (r2 = 0.32, P = 0.011), as well as the HAD/CS ratio (r2 = 0.27, P = 0.021).
FIGURE 3
FIGURE 3
Mitochondria content and subcellular localization in distinct fiber types and at whole-muscle level of leg and arm muscles. There was a tendency (P = 0.095) toward a higher mitochondrial content in the intermyofibrillar (IMF) and subsarcolemmal (SS) regions, of arm muscle (open bars) compared with leg muscle (filled bars) (A). This tendency is also apparent when calculating total mitochondrial content (IMF + SS) (B). (C) Weighted mitochondrial volumes in the arm and leg muscle, estimated from a fiber type distribution of 57 and 37% MHC-I for the leg and arm (n = 9), respectively. These MHC weighted values of whole-muscle mitochondrial content in arm and leg muscles are similar. Values are means ± SE (n = 29–30 fibers from 10 subjects).

References

    1. Andersen P. (1975). Capillary density in skeletal muscle of man. Acta Physiol. Scand. 95 203–205. 10.1111/j.1748-1716.1975.tb10043.x - DOI - PubMed
    1. Andersson E., Holmberg H. C., Ørtenblad N., Björklund G. (2016). Metabolic responses and pacing strategies during successive sprint skiing time trials. Med. Sci. Sports Exerc. 48 2544–2554. 10.1249/MSS.0000000000001037 - DOI - PubMed
    1. Boushel R., Ara I., Gnaiger E., Helge J. W., González-Alonso J., Munck-Andersen T., et al. (2014). Low intensity training increases peak arm VO2 by enhancing both convective and diffusive O2 delivery. Acta Physiol. 211 122–134. 10.1111/apha.12258 - DOI - PubMed
    1. Boushel R., Ggaiger E., Wright-Paradis C., Calbet J. A., Gonzales-Alonso J., Munck- Andersen T., et al. (2011). Muscle mitochondrial capacity exceeds maximal oxygen delivery in humans. Mitochondrion 11 303–307. 10.1016/j.mito.2010.12.006 - DOI - PubMed
    1. Brooke M. H., Kaiser K. K. (1970). Three “myosin adenosine triphosphatase” systems: the nature of their pH lability and sulfhydryl dependence. J. Histochem. Cytochem. 18 670–672. 10.1177/18.9.670 - DOI - PubMed