

Multiple Time Intervals of Visual Events Are Represented as Discrete Items in Working Memory
- PMID: 30116213
- PMCID: PMC6083218
- DOI: 10.3389/fpsyg.2018.01340
Multiple Time Intervals of Visual Events Are Represented as Discrete Items in Working Memory
Abstract
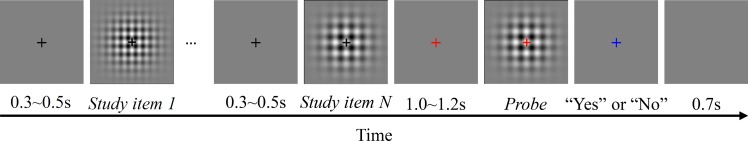
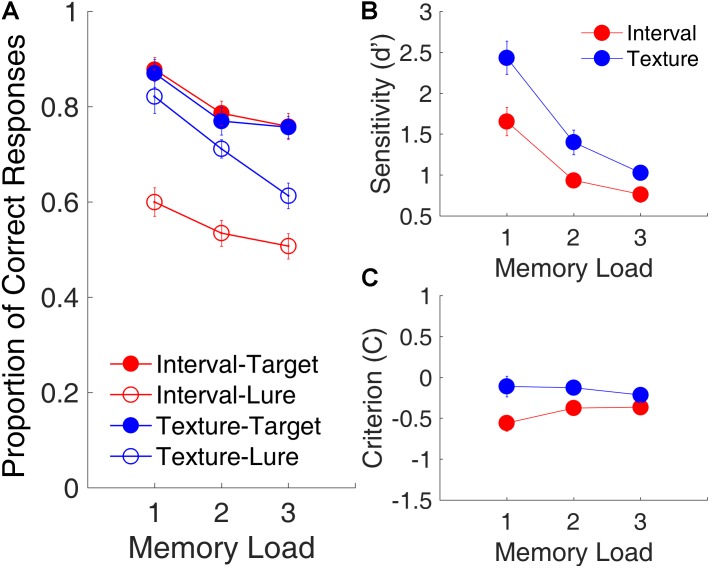
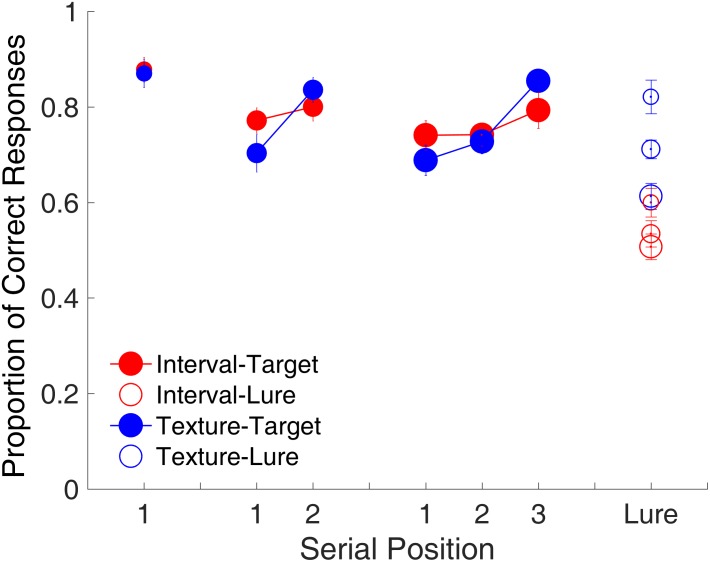
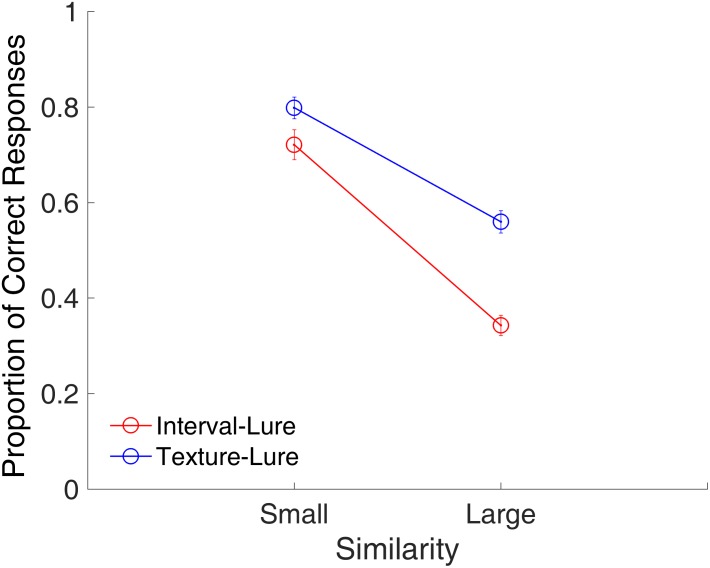
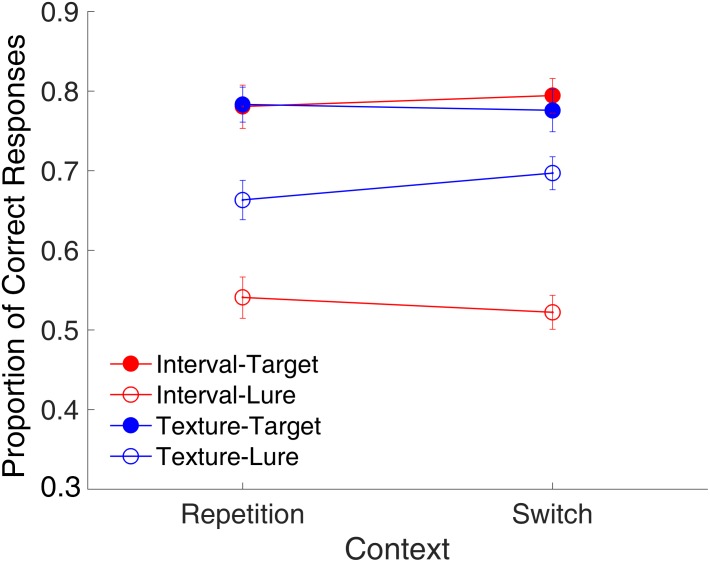
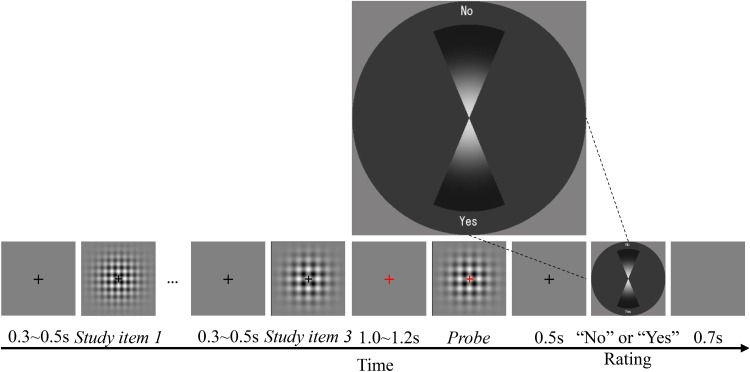
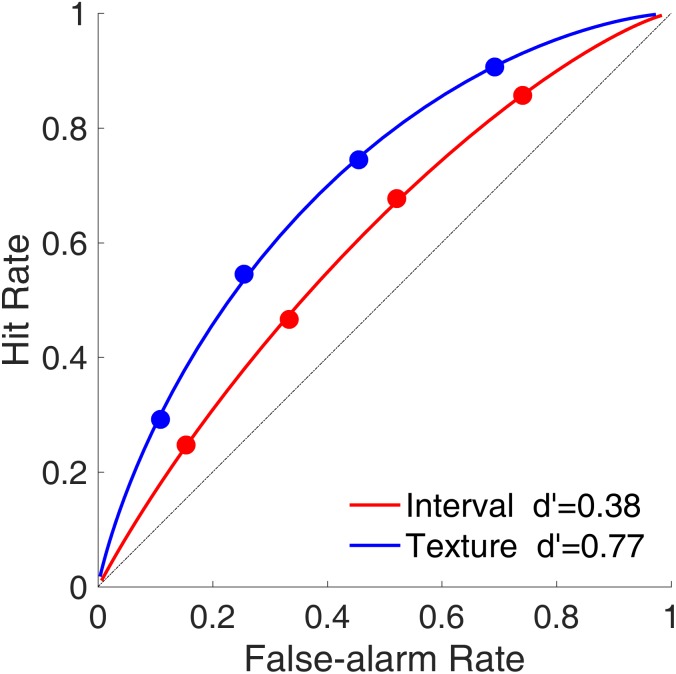
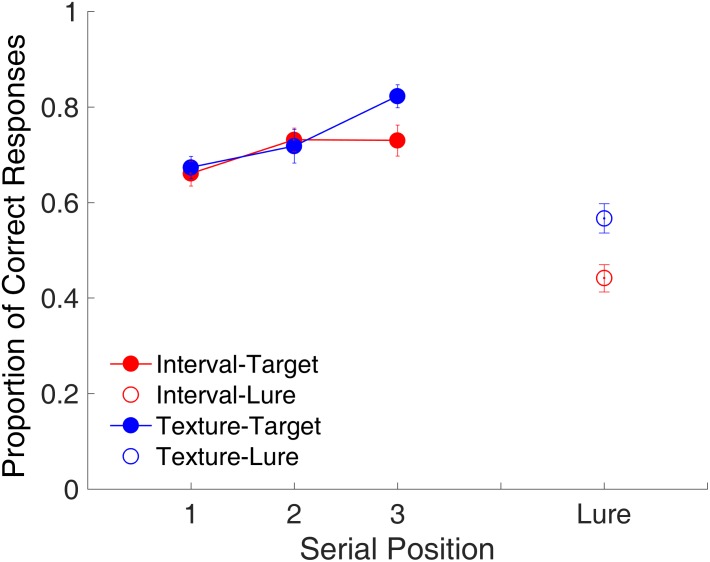
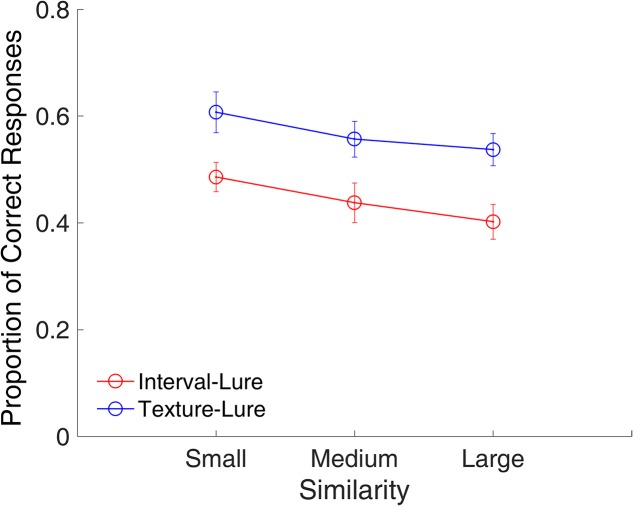
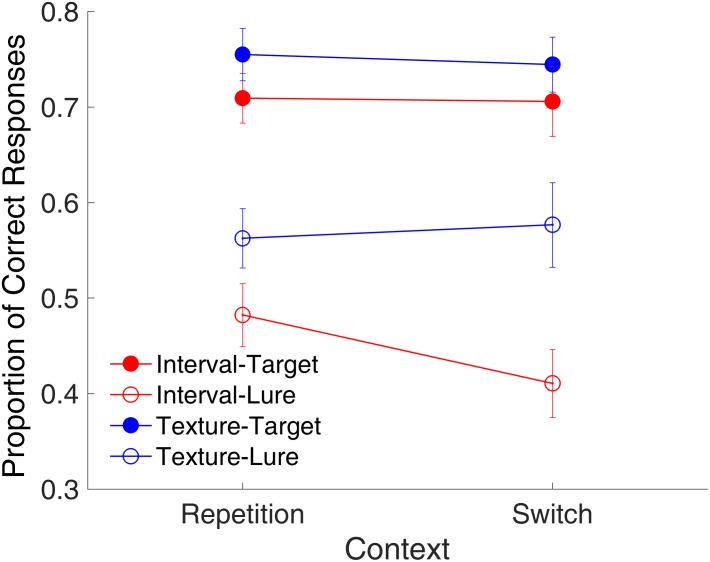
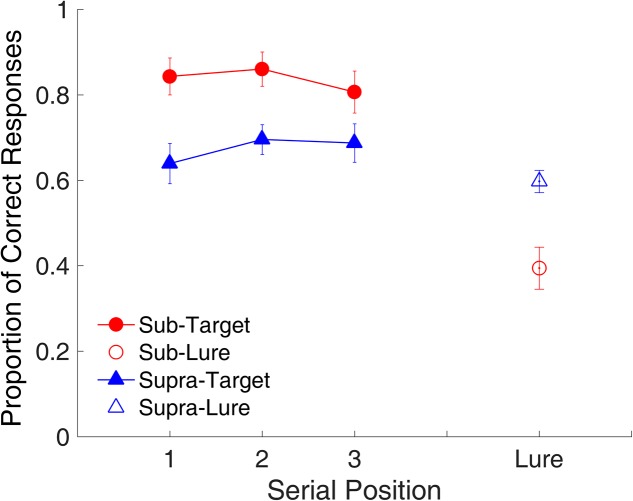
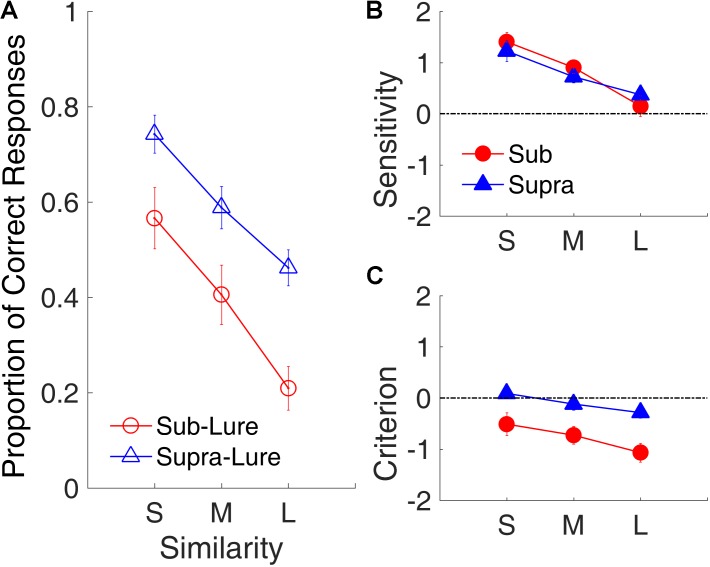
Previous studies on time perception and temporal memory have focused primarily on single time intervals; it is still unclear how multiple time intervals are perceived and maintained in working memory. In the present study, using Sternberg's item recognition task, we compared the working memory of multiple items with different time intervals and visual textures, for sub- and supra-second ranges, and investigated the characteristics of working memory representation in the framework of the signal detection theory. In Experiments 1-3, gratings with different spatial frequencies and time intervals were sequentially presented as study items, followed by another grating as a probe. Participants determined whether the probe matched one of the study gratings, in either the temporal dimension or in the visual dimension. The results exhibited typical working memory characteristics such as the effects of memory load, serial position, and similarity between probe and study gratings, similarly, to the time intervals and visual textures. However, there were some differences between the two conditions. Specifically, the recency effect for time intervals was smaller, or even absent, as compared to that for visual textures. Further, as compared with visual textures, sub-second intervals were more likely to be judged as remembered in working memory. In addition, we found interactions between visual texture memory and time interval memory, and such visual-interval binding differed between sub- and supra-second ranges. Our results indicate that multiple time intervals are stored as discrete items in working memory, similarly, to visual texture memory, but the former might be more susceptible to decay than the latter. The differences in the binding between sub- and supra-second ranges imply that working memory for sub- and supra-second ranges may differ in the relatively higher decision stage.
Keywords: memory load; serial position; signal detection theory; similarity; time intervals; working memory.
Figures
Similar articles
-
Recognition and position information in working memory for visual textures.Mem Cognit. 2008 Mar;36(2):282-94. doi: 10.3758/mc.36.2.282. Mem Cognit. 2008. PMID: 18426061
-
Working memory for time intervals in auditory rhythmic sequences.Front Psychol. 2014 Nov 19;5:1329. doi: 10.3389/fpsyg.2014.01329. eCollection 2014. Front Psychol. 2014. PMID: 25477849 Free PMC article.
-
Categorical bias as a crucial parameter in visual working memory: The effect of memory load and retention interval.Cortex. 2022 Sep;154:311-321. doi: 10.1016/j.cortex.2022.05.007. Epub 2022 May 26. Cortex. 2022. PMID: 35839573
-
Working Memory for Sequences of Temporal Durations Reveals a Volatile Single-Item Store.Front Psychol. 2016 Oct 26;7:1655. doi: 10.3389/fpsyg.2016.01655. eCollection 2016. Front Psychol. 2016. PMID: 27833574 Free PMC article.
-
A direct comparison of attentional orienting to spatial and temporal positions in visual working memory.Psychon Bull Rev. 2022 Feb;29(1):182-190. doi: 10.3758/s13423-021-01972-3. Epub 2021 Jul 21. Psychon Bull Rev. 2022. PMID: 34287765 Free PMC article.
Cited by
-
Temporal context effects are associated with cognitive status in advanced age.Psychol Res. 2022 Mar;86(2):512-521. doi: 10.1007/s00426-021-01502-9. Epub 2021 Mar 22. Psychol Res. 2022. PMID: 33754182 Free PMC article.
References
LinkOut - more resources
Full Text Sources
Other Literature Sources