

Characterization of the T-cell Repertoire after Autologous HSCT in Patients with Ankylosing Spondylitis
- PMID: 30116615
- PMCID: PMC6087820
Characterization of the T-cell Repertoire after Autologous HSCT in Patients with Ankylosing Spondylitis
Abstract
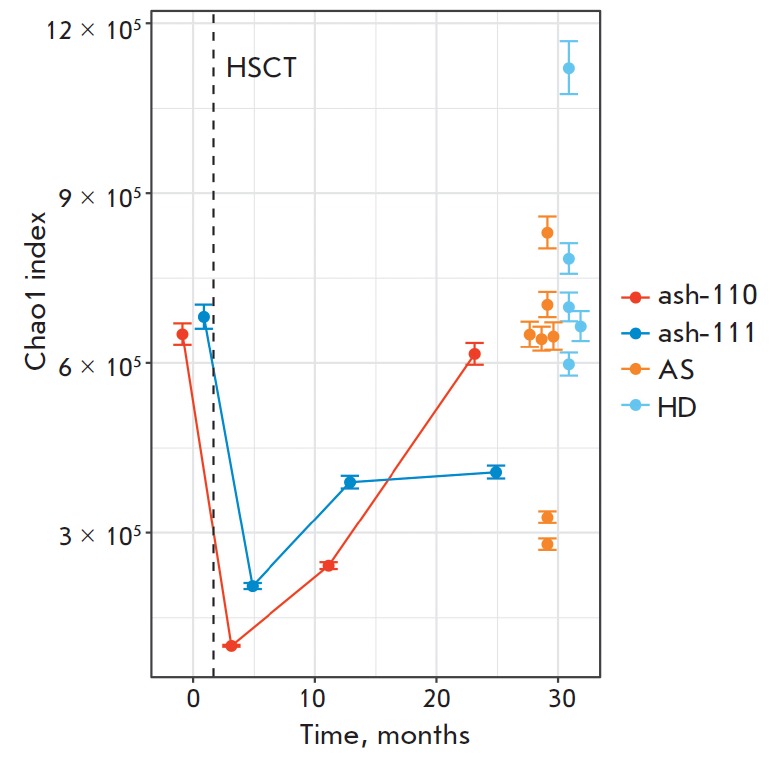
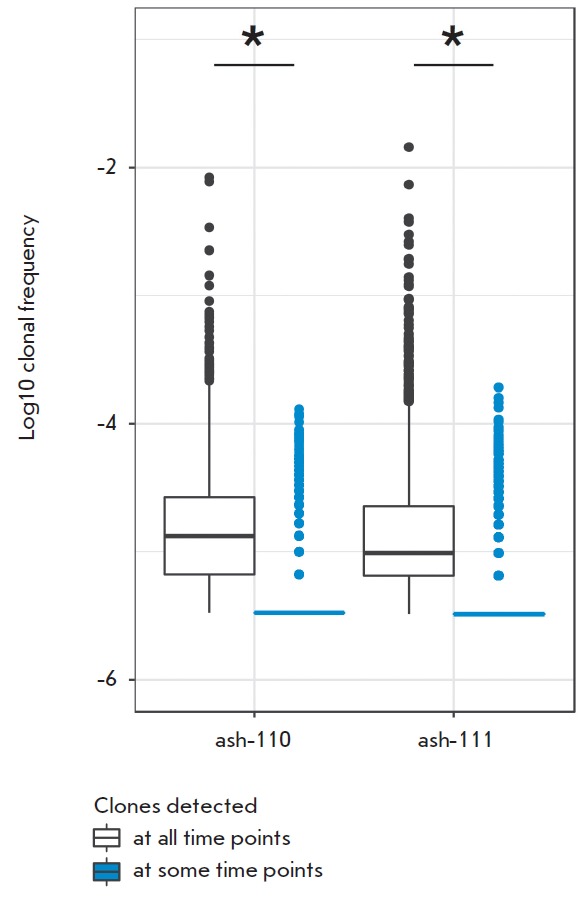
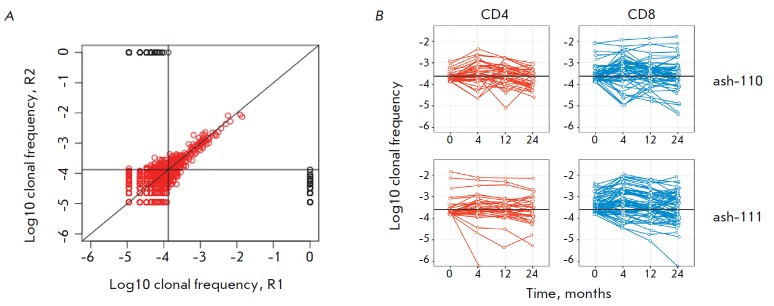
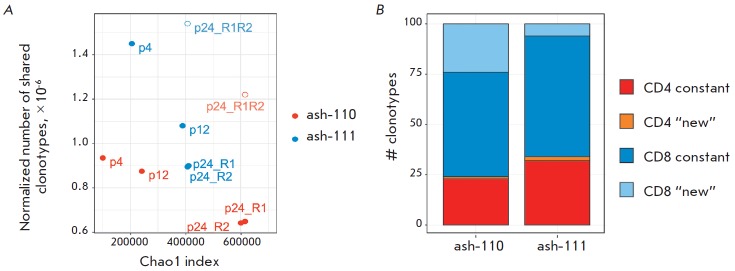
Autologous hematopoietic stem cell transplantation (HSCT), a safer type of HSCT than allogeneic HSCT, is a promising therapy for patients with severe autoimmune diseases (ADs). Despite the long history of medical practice, structural changes in the adaptive immune system as a result of autologous HSCT in patients with various types of ADs remain poorly understood. In this study, we used high-throughput sequencing to investigate the structural changes in the peripheral blood T-cell repertoire in adult patients with ankylosing spondylitis (AS) during two years after autologous HSCT. The implementation of unique molecular identifiers allowed us to substantially reduce the impact of the biases occurring during the preparation of libraries, to carry out a comparative analysis of the various properties of the T-cell repertoire between different time points, and to track the dynamics of both distinct T-cell clonotypes and T-cell subpopulations. In the first year of the reconstitution, clonal diversity of the T-cell repertoire remained lower than the initial one in both patients. During the second year after HSCT, clonal diversity continued to increase and reached a normal value in one of the patients. The increase in the diversity was associated with the emergence of a large number of low-frequency clonotypes, which were not identified before HSCT. Efficiency of clonotypes detection after HSCT was dependent on their abundance in the initial repertoire. Almost all of the 100 most abundant clonotypes observed before HSCT were detected 2 years after transplantation and remained highly abundant irrespective of their CD4+ or CD8+ phenotype. A total of up to 25% of peripheral blood T cells 2 years after HSCT were represented by clonotypes from the initial repertoire.
Keywords: NGS; TCR repertoire; ankylosing spondylitis; autologous HSCT.
Figures

Similar articles
-
Characterization of peripheral blood TCR repertoire in patients with ankylosing spondylitis by high-throughput sequencing.Hum Immunol. 2018 Jun;79(6):485-490. doi: 10.1016/j.humimm.2018.03.007. Epub 2018 Mar 31. Hum Immunol. 2018. PMID: 29614337
-
Optimized clonotypic analysis of T-cell receptor repertoire in immune reconstitution.Exp Hematol. 2007 Mar;35(3):516-21. doi: 10.1016/j.exphem.2006.11.007. Exp Hematol. 2007. PMID: 17309832
-
3D: diversity, dynamics, differential testing - a proposed pipeline for analysis of next-generation sequencing T cell repertoire data.BMC Bioinformatics. 2017 Feb 27;18(1):129. doi: 10.1186/s12859-017-1544-9. BMC Bioinformatics. 2017. PMID: 28241742 Free PMC article.
-
Evaluation of TCR repertoire diversity in patients after hematopoietic stem cell transplantation.Stem Cell Investig. 2015 Sep 28;2:17. doi: 10.3978/j.issn.2306-9759.2015.09.01. eCollection 2015. Stem Cell Investig. 2015. PMID: 27358885 Free PMC article. Review.
-
Application of the molecular analysis of the T-cell receptor repertoire in the study of immune-mediated hematologic diseases.Hematology. 2003 Jun;8(3):173-81. doi: 10.1080/1024533031000107505. Hematology. 2003. PMID: 12745651 Review.
Cited by
-
Immune Repertoires in Various Dermatologic and Autoimmune Diseases.Genes (Basel). 2024 Dec 11;15(12):1591. doi: 10.3390/genes15121591. Genes (Basel). 2024. PMID: 39766858 Free PMC article. Review.
References
LinkOut - more resources
Full Text Sources
Research Materials