. 2018 Jun 13;6(3):277-300.
doi: 10.1016/j.jcmgh.2018.06.002. eCollection 2018.

Identification of Positively and Negatively Selected Driver Gene Mutations Associated With Colorectal Cancer With Microsatellite Instability

Affiliations

Identification of Positively and Negatively Selected Driver Gene Mutations Associated With Colorectal Cancer With Microsatellite Instability

Vincent Jonchere et al. Cell Mol Gastroenterol Hepatol. .

Abstract

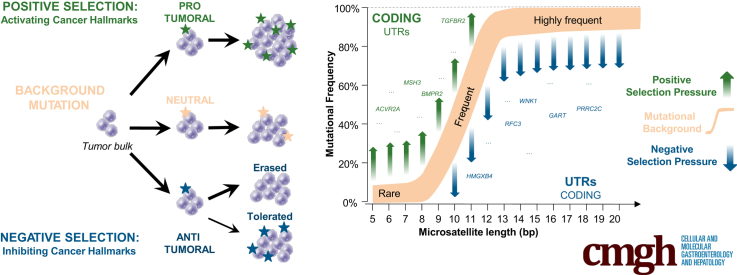
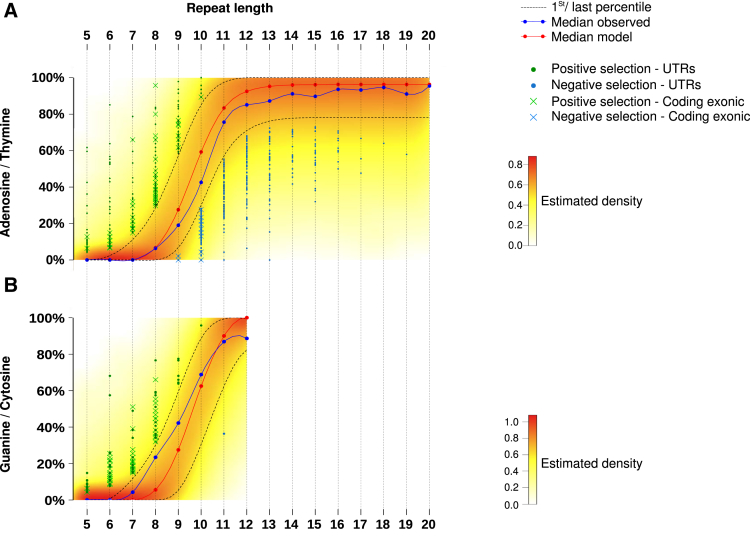
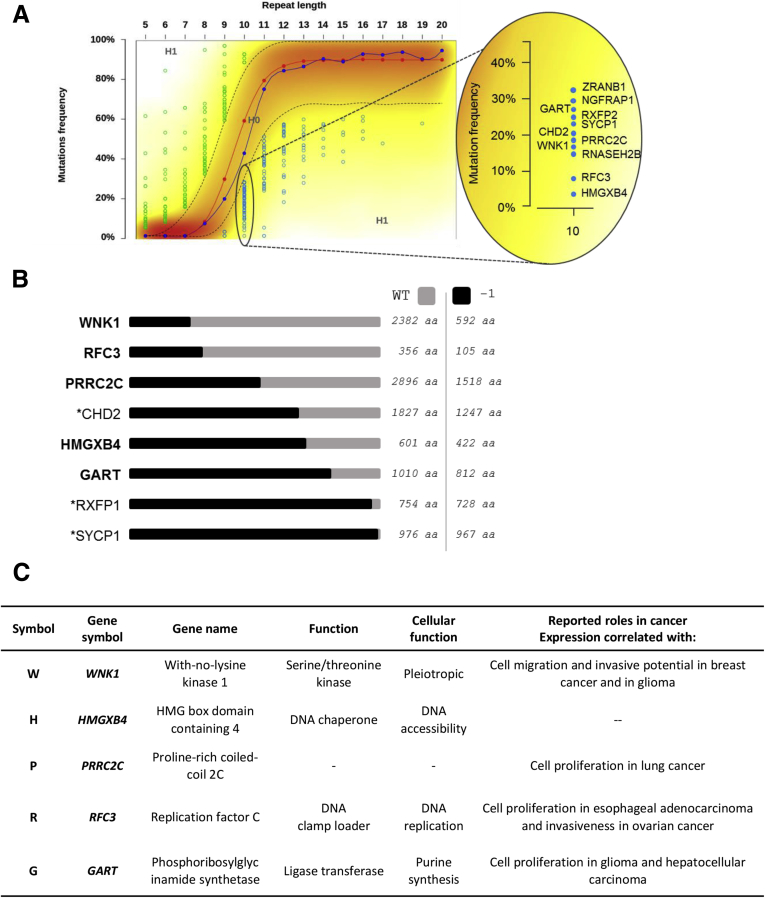
Background & aims: Recent studies have shown that cancers arise as a result of the positive selection of driver somatic events in tumor DNA, with negative selection playing only a minor role, if any. However, these investigations were concerned with alterations at nonrepetitive sequences and did not take into account mutations in repetitive sequences that have very high pathophysiological relevance in the tumors showing microsatellite instability (MSI) resulting from mismatch repair deficiency investigated in the present study.

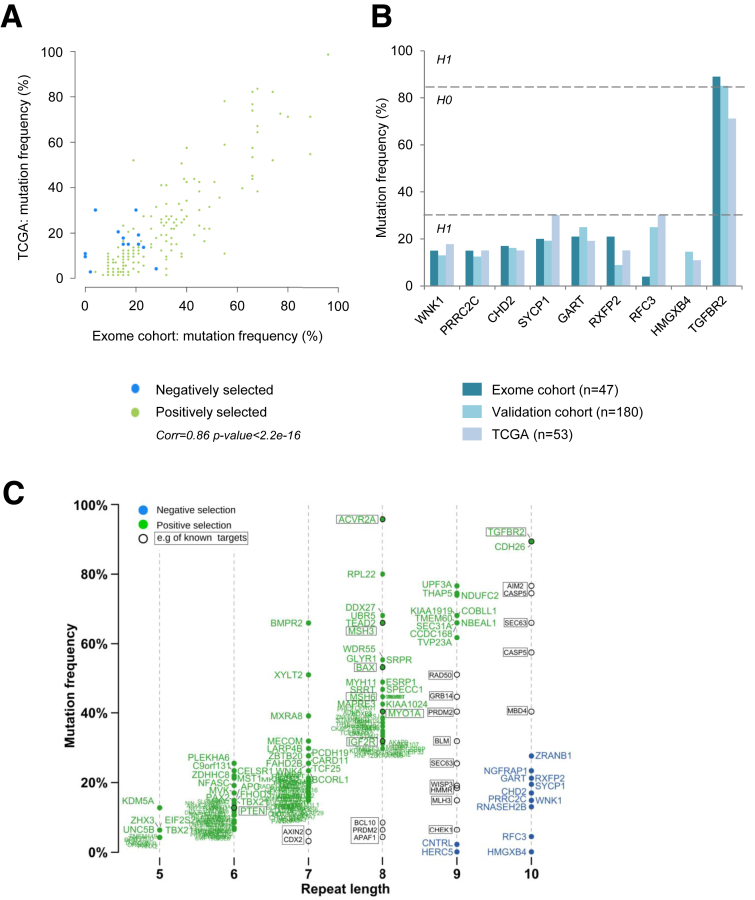
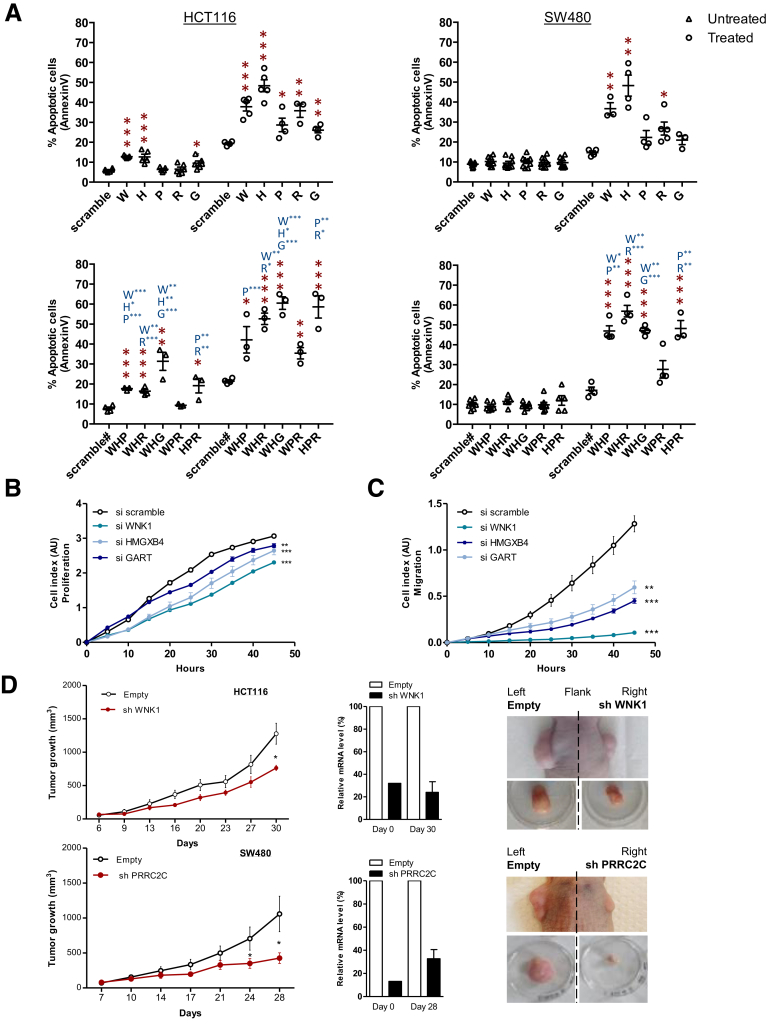
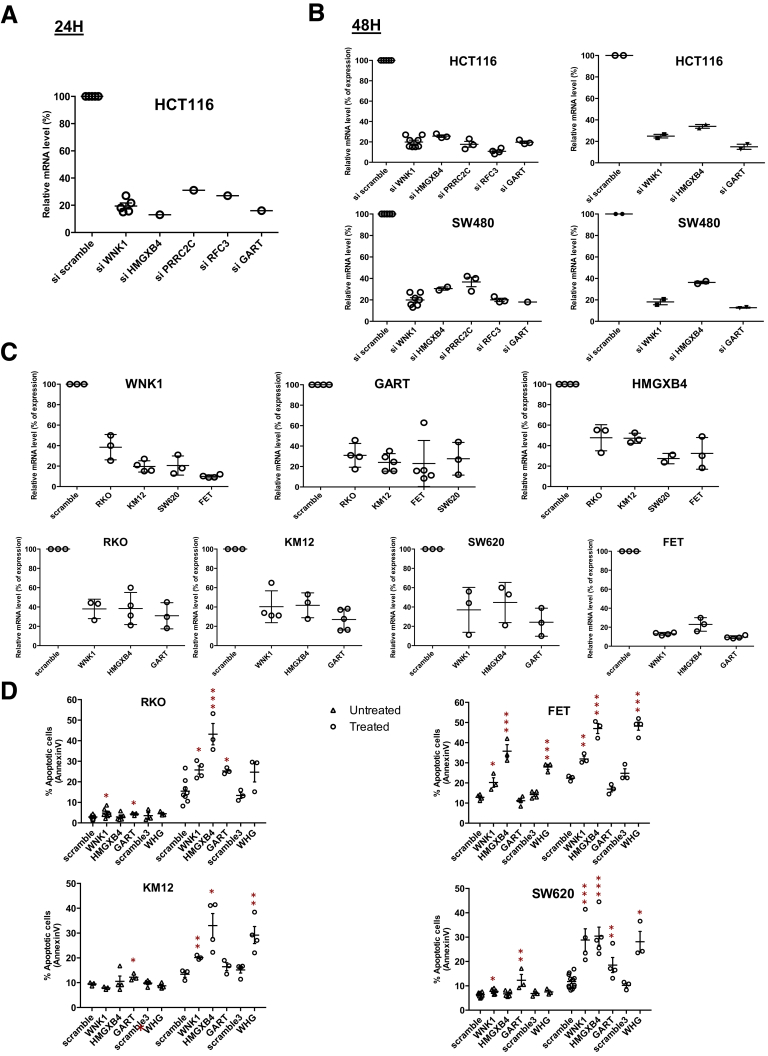
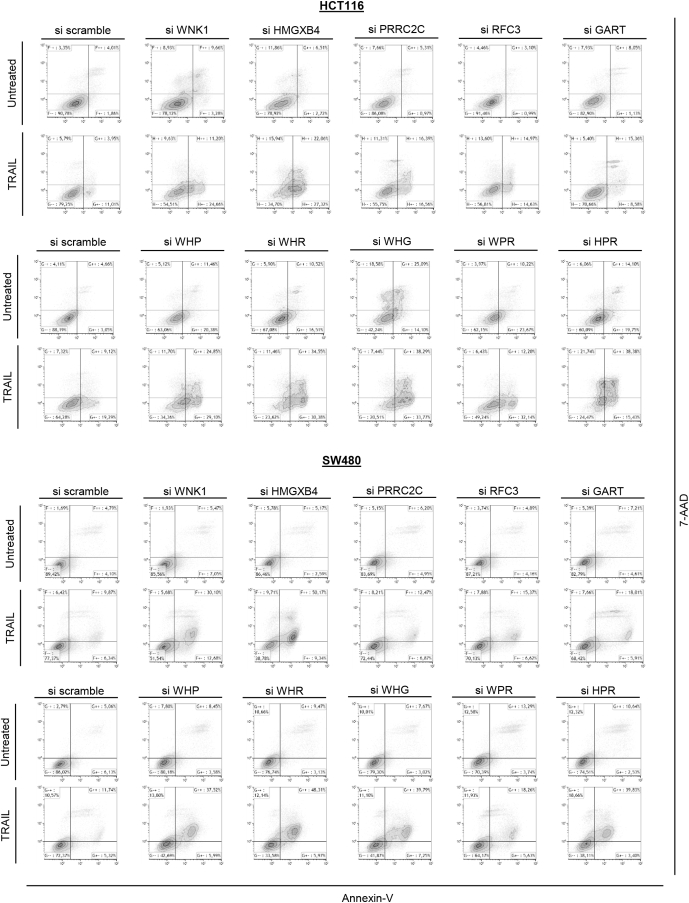
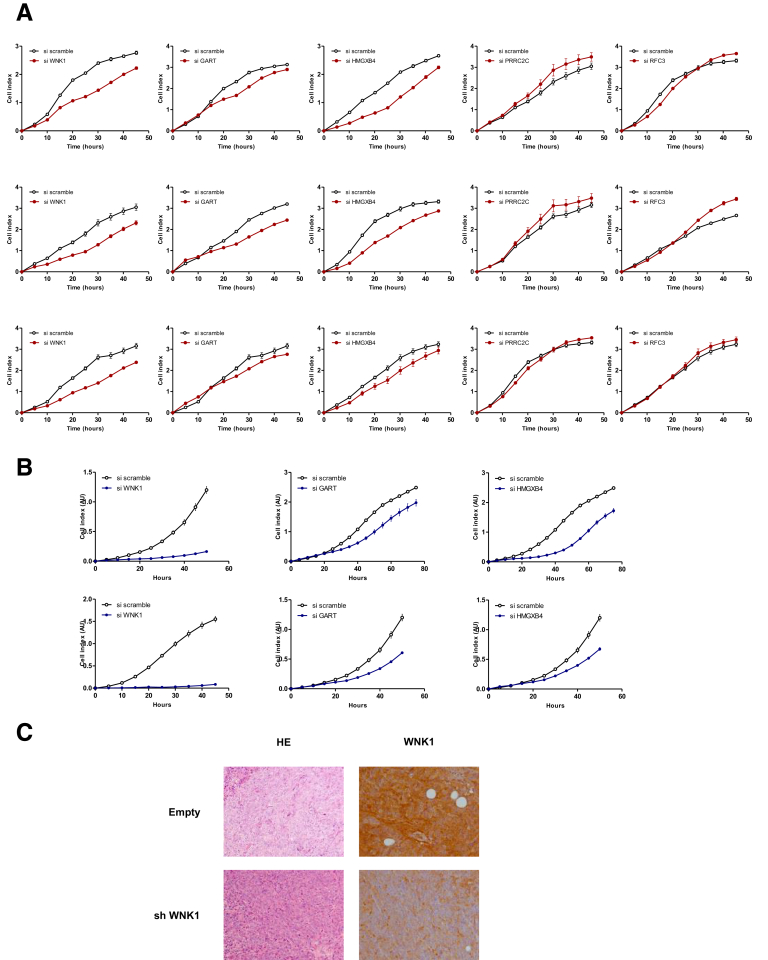
Methods: We performed whole-exome sequencing of 47 MSI colorectal cancers (CRCs) and confirmed results in an independent cohort of 53 MSI CRCs. We used a probabilistic model of mutational events within microsatellites, while adapting pre-existing models to analyze nonrepetitive DNA sequences. Negatively selected coding alterations in MSI CRCs were investigated for their functional and clinical impact in CRC cell lines and in a third cohort of 164 MSI CRC patients.

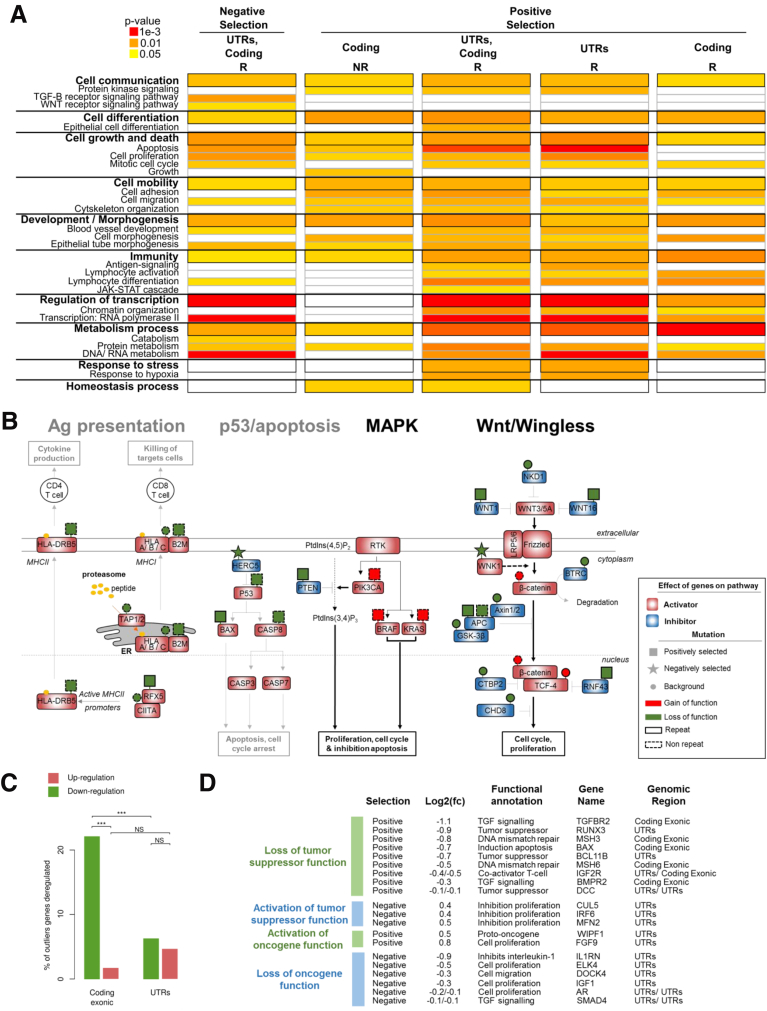
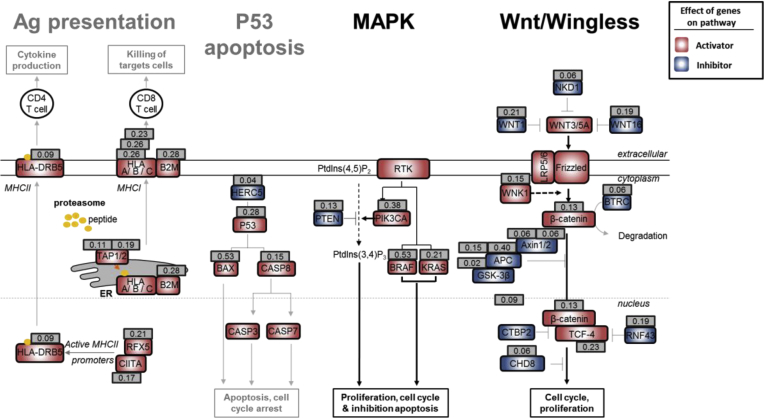
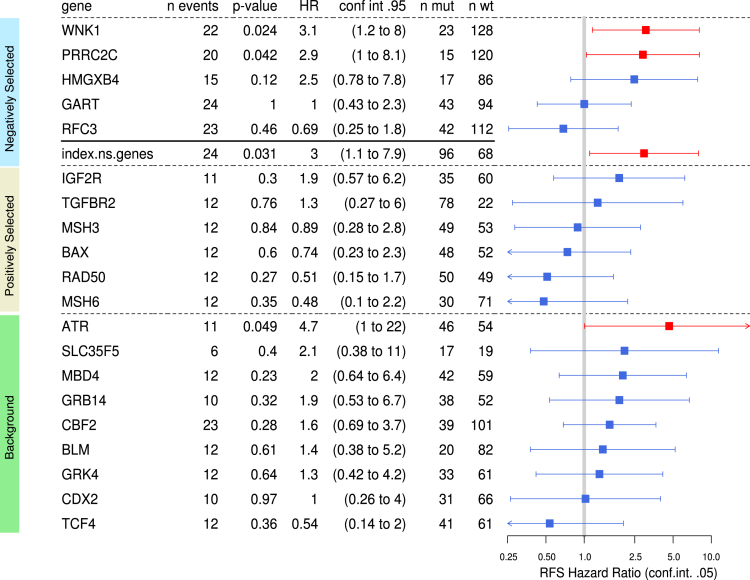
Results: Both positive and negative selection of somatic mutations in DNA repeats was observed, leading us to identify the expected true driver genes associated with the MSI-driven tumorigenic process. Several coding negatively selected MSI-related mutational events (n = 5) were shown to have deleterious effects on tumor cells. In the tumors in which deleterious MSI mutations were observed despite the negative selection, they were associated with worse survival in MSI CRC patients (hazard ratio, 3; 95% CI, 1.1-7.9; P = .03), suggesting their anticancer impact should be offset by other as yet unknown oncogenic processes that contribute to a poor prognosis.

Conclusions: The present results identify the positive and negative driver somatic mutations acting in MSI-driven tumorigenesis, suggesting that genomic instability in MSI CRC plays a dual role in achieving tumor cell transformation. Exome sequencing data have been deposited in the European genome-phenome archive (accession: EGAS00001002477).

Keywords: CRC, colorectal cancer; Colorectal Cancer; Driver Gene Mutations; HR, hazard ratio; MLH1, MutL Homolog 1; MMR, mismatch repair; MSH, MutS Homolog; MSI, microsatellite instability; Microsatellite Instability; NR, nonrepetitive; PBS, phosphate-buffered saline; PCR, polymerase chain reaction; Positive and Negative Selection; R, repetitive; RFS, relapse-free survival; RTCA, Real-Time Cell Analyzer; Tumorigenic Process; UTR, untranslated region; WES, whole-exome sequencing; WGA, whole-genome amplification; bp, base pair; indel, insertion/deletion; mRNA, messenger RNA; shRNA, short hairpin RNA; siRNA, small interfering RNA.


Figures

None
Graphical abstract
Figure 1
Figure 1
Genetic instability in MMR-deficient CRC. (A) Pie chart represents the portion of R (light blue) and NR (dark blue) sequences. Bar plots represent the distribution of the 5 genomic region types (3’ UTR, coding exonic, intronic, 5’ UTR) captured by WES in R (light blue) and NR (dark blue) sequences. (B) Bar plot of the number of mutations per captured megabase (Nb mutations/Mb) across the whole exome for 47 MSI tumors in R sequences (light blue) and in NR sequences (dark blue). The median mutation rate in all types of CRC was described previously and is indicated by the red dotted line. The heatmap below shows the percentage of mutated genes in coding R and NR sequences. (C) Box plots show the number of mutations per megabase (log10 scale) in all types of CRCs from the TCGA colon adenocarcinoma data set (red), in MSI CRC within R sequences (light blue), and in MSI CRC within NR sequences (dark blue). Grey dots indicate the mutation frequencies for each MSI tumor. The results of the t test between groups were as follows: ***P < .001. (D) Bar plot of the percentage of genes with different mutation frequencies for MSI (blue) and microsatellite stable (MSS) (red) CRCs. (EBox plots represent the number of mutations per megabase for 3 genomic regions (UTRs, coding exonic, intronic). Grey dots represent the value for individual tumors (n = 47). The results of the t test between groups were as follows: ***P < .001. (F) The mutation frequencies of 3 gene regions (UTRs, coding exonic, intronic) are shown, where grey dots represent each individual mutation in NR (left) and R (right) sequences. Mutation frequencies in R sequences are shown according to the microsatellite length and nucleotide composition (colored dots and lines). IHC, immunohistochemistry.
Figure 2
Figure 2
NR mutation types. (A) Distribution of mutation substitution types within the sample. (B) Average proportion across the sample of each transition type. (C) Frequency of C to T mutations according to the flanking base. (D) Distribution of the number of mutations according to the flanking bases for each type of base substitutions.
Figure 3
Figure 3
Identification of candidate driver genes with mutations in NR sequences. (A) Distribution of mutation types in coding NR regions according to their functional impact (annotation tool Annovar). The functional impact was based on several methods, with a mutation considered as deleterious if at least 1 of those methods estimated it to be deleterious. The average percentage of each mutation type per sample is shown in the inset. (B) Schematic representation of the 3 methods (MutSigCV, Intogen, combined binomial) used in this study to identify driver mutations (see the Methods section for details). (C) Heatmap of the significance (q values) of mutated genes commonly described for their functional impact in MSI CRC using Intogen, combined binomial, and MutSigCV analyses. (D) Oncoprint representation of mutations in coding NR sequences within each sample for the 25 top significantly mutated genes (indicated in darker grey for each approach on the side annotation heatmap) and for the 5 significant genes considered as driver genes by Intogen (indicated in black on the side annotation heatmap) across samples. Top and side bar plots indicate the percentage of each type of mutation within the sample and within the gene, respectively.
Figure 4
Figure 4
Positive and negative selection in repetitive sequences in MSI CRC. (A) Distribution model of mutation frequencies across samples in microsatellites in UTRs or coding exonic regions according to repeat length for A/T nucleotides. The color gradient indicates the density of the β-binomial logistic regression model. The blue curve represents the median of observed mutation frequencies, and the red curve represents the median obtained from the model. This figure shows the statistical model and outliers for adenosine/thymine. (B) Box plot representation of mutation frequency variations according to the nucleotide composition of the microsatellite and to the repeat length. The significant independence of the chi-squared distribution is annotated by asterisks as follows: *P < .05, and ***P < .001. (C) Distribution of microsatellite mutations (log10 scale) in the 3 gene regions (UTRs, coding exonic, and intronic) according to repeat length. (D) Distribution of outlier mutation in microsatellites contained in UTRs and in coding exons. Positively and negatively selected microsatellite mutations are represented above and below the dotted line, respectively. (E) Distribution of the percentage of outlier mutations (log10 scale) according to repeat length. The significant independence of the chi-squared distribution is annotated by asterisks, as follows: *P < .05, **P < .01, and ***P < .001.
Figure 5
Figure 5
Outliers identification and visualization. Distribution of mutation frequencies of microsatellites according to repeat length. Green dots and blue dots represent microsatellites positively and negatively selected outlier mutations, respectively, in MSI tumors. Coding exonic outliers are indicated by a x and UTR outliers are indicated by a circle. This figure shows the statistical model and outliers for (A) adenosine/thymine and (B) guanine/cytosine.
Figure 6
Figure 6
Mutation frequency validation and redefinition of true MSI target genes. (A) Mutation frequency of outlier mutations observed in the present exome cohort and in the TCGA cohort. (B) Mutation frequency for the 9 outlier mutations coding microsatellites contained in the putative target genes for MSI in a large independent cohort of colon tumors (n = 180) and the TCGA cohort (n = 53). (C) Distribution of mutation frequencies in coding microsatellites according to repeat length (x-axis). Genes with coding exonic outlier mutations identified in this study are indicated in green (positively selected) and blue (negatively selected). Genes with background mutation rates (unselected according to the model) are indicated in black. Examples of published targets for MSI are shown within rectangles, and those not subject to selection are indicated in black text.
Figure 7
Figure 7
Participation of positively and negatively selected events in cancer-related pathways. (A) Significant gene ontology terms enriched in outlier mutations compared with their abundance in all genes in the genome. Details of all gene ontology terms are available in Supplementary Table 4. (B) Interactions between mutations in R (continuous outlines) and NR sequences (dotted outlines) result in a coordinated effect on 4 signaling pathways. The effects of mutations that are unselected (circles), positively selected (rectangle), or negatively selected (stars) are indicated above the genes by a color code (red for gain of function and green for loss of function). Prediction of the global effect of mutations is represented by bold font for activation of the pathway and light grey font for inhibition. Genes known to be positive regulators (activators) of signaling pathways are indicated by a red rectangle and negative regulators (inhibitors) are indicated by a blue rectangle. (C) Percentage of outlier mutations in R sequences located in coding exons and in UTRs leading to significant dysregulation of mRNA expression level (comparison of mutated and wild-type tumors in each case). Upper: Proportion of microsatellite mutations leading to up-regulation of gene expression (in brown); lower: Down-regulation (in green). The significant independence of the chi-squared distribution is annotated by asterisks, as follows: ***P < .001. (D) List of MS candidate outliers that may contribute to the MSI tumor phenotype because of their biological functions, the effect of mutations on the level of gene expression, and the selective pressure at which the MS is constrained (positive or negative selection). Log2(fold change (Log2(fc))) indicates the log base 2 of mRNA expression between the MS mutant allele vs MS wild type. For each gene, the selective pressure, biological function, gene name, and the gene region of the MS are indicated.
Figure 8
Figure 8
Mutation frequency of selected pathways. For each gene that belongs to a specific biological pathway, the mutation frequency is indicated in a grey square. Ag, Antigen; MAPK, Mitogen Activated Protein Kinases.
Figure 9
Figure 9
Exonic outlier mutation genes: mutation positions and negative selection validation. (A) Negatively selected coding exonic outliers identified in this study (repeat length: 10). (B) Schematic structure of wild-type (in grey) or mutant (in black) proteins of the 9 outlier mutation genes in which mutations were negatively selected in MSI tumors. *Genes that are not investigated in the present study because mutations do not match with putative loss of function (RXFP1, SYCP1, RNASEH2B) or because gene silencing was not successful (CHD2). (C) Table of the 5 outlier mutations negatively selected in MSI tumors identified from exome sequencing data and investigated here by functional analysis. Four of the 5 genes have a literature-documented role that supports negative selection of their mutations because of the tumorigenic implication.
Figure 10
Figure 10
Validation of the deleterious effects of 5 outlier mutations on CRC cell lines. (A) Flow cytometry analysis of the apoptosis (Annexin V) of untreated (triangle) or TRAIL-treated (circle) HCT116 (MSI, left panel) and SW480 (microsatellite stable, right panel) CRC cell lines transfected with either a single specific siRNA gene (WNK1, HMGXB4, GART, RFC3, and/or PRRC2C), or with scrambled siRNA (upper panels). Lower panels: Simultaneous down-regulation of 3 genes are shown, leading to an additive effect in increasing the percentage of apoptotic cells in some cases. Data represent the means ± SEM of 3 independent experiments for single specific siRNA, and 2 independent experiments for simultaneous down-regulation performed in triplicate. t test: *P < .05, **P < .01 and ***P < .001 of the indicated silencing condition compared with control (si scramble in black; single siRNA indicated gene in blue). All data from fluorescence-activated cell sorter analysis are shown in Figure 12. (A and C) To evaluate the effect of silencing of the 5 genes with outlier mutations on the proliferation and migration rate of HCT116 cell lines, real-time monitoring of (B) cell growth and (C) cell migration using the xCELLigence system was performed. With this instrument, silencing of the WNK1, HMGXB4, and GART genes was shown to attenuate cell proliferation and migration significantly, whereas silencing of PRRC2C and RFC3 did not (Figure 13). The cell index for proliferation and migration are presented as means ± SEM of 3 independent experiments performed in quadruplicate. Two-way analysis of variance using the Bonferroni post hoc test: *P < .05, **P < .01, and ***P < .001. (D) Expression of WNK1 or PRRC2C shRNA in CRC cells leads to decreased tumor growth. Left panels: Comparative analysis of tumor growth (mean tumor volumes) in xenografts derived from HCT116 and SW480 cell lines transfected with WNK1 or PRRC2C shRNA, respectively, and compared with cells containing a scrambled shRNA. There were 7 mice in the WNK1 group and 10 in the PRRC2C group. Data represent means ± SEM, t test: *P < .05. Middle panels: WNK1 and/or PRRC2C mRNA reverse-transcription quantitative PCR expression analysis at 2 time points (at day 0 from transfected cells before injection and at day 28 or 30 from tumor xenograft). Right panels: Macroscopic picture of xenograft before and after tumor excision from HCT116 and SW480 stably transfected cells.
Figure 11
Figure 11
Validation of gene abrogation by the siRNA approach and validation of the deleterious impact of 5 outlier mutations genes in RKO, KM12, FET, and SW620 CRC cell lines. Gene expression (mRNA level) of outlier mutation–related genes after knock-down by single siRNA was assessed at (A) 24 or (B, left panel) 48 hours after transfection by real-time quantitative PCR. Data represent the means ± SEM of at least 3 independent experiments. (B, right panel) Gene expression (mRNA level) of outlier mutation–related genes after simultaneous down-regulation of 3 genes in HCT116 (upper panel) and SW480 (lower panel) cell lines. (C) Gene expression (mRNA level) of outlier mutation genes after knock-down by siRNA in 4 cell lines (MSI: RKO, KM12; and microsatellite stable: FET, SW620) was assessed 48 hours after transfection by real-time quantitative PCR. Data represent the means ± SEM of 3 independent experiments. (D) Flow cytometry analysis of apoptosis (Annexin V) of untreated (triangle) or TRAIL-treated (circle) MSI (RKO and KM12, left panel) and microsatellite stable (FET and SW620, right panel) CRC cell lines transfected either with a single specific siRNA gene (WNK1, HMGXB4, and/or GART) or with scrambled siRNA. Data represent the means ± SEM of 3 independent experiments. t test: *P < .05, **P < .01 and ***P < .001 of indicated silencing condition compared with control.
Figure 12
Figure 12
Flow cytometry data. Flow cytometry analysis of early (Annexin V–positive and 7-amino-actinomycin D [7-AAD]-negative cells) and late (Annexin V– and 7-AAD–positive cells) apoptosis of untreated or TRAIL-treated HCT116 (MSI, upper panel) and SW480 (microsatellite stable, lower panel) CRC cell lines transfected either with a single specific siRNA gene (WNK1, HMGXB4, GART, RFC3, and/or PRRC2C) or with scrambled siRNA. One experiment of the 3 performed is shown.
Figure 13
Figure 13
Experimental data of cell growth and cell migration analysis. Real-time monitoring of (A) cell growth and (B) cell migration using the xCELLigence system (HCT116 CRC MSI cell line). This system allows estimation of the cell index in real time—the parameter based on impedance measurement and reflecting the number of cells attached to the surface of the experimental chambers. Quadruplicates of 3 independent experiments are shown. (C) H&E stain, and WNK1 marker expression by immunohistochemistry in tumor xenografts at day 30 is shown (see Figure 10D).
Figure 14
Figure 14
Clinical relevance of MSI-driven coding region mutations in target genes in CRC patients. The association of 5 negatively selected MSI-driven mutational events with RFS was calculated in the cohort of 164 MSI CRC patients with survival data available. The association of the Boolean mutational index (see the Materials and Methods section) was calculated from the mutational status of the above 5 target genes (WNK1, PRRC2C, HMGXB4, GART, RFC3) in each tumor sample (status 0, no mutation observed; status 1, at least 1 mutation observed) with RFS also is shown. Also reported is the association with RFS of a series of 15 other frequent MSI mutations (6 positively selected and 9 background events) that we investigated previously in the same MSI CRC samples and published. Forest plot of RFS HRs of independent univariate Cox analyses are shown. Squares represent the HRs and horizontal bars represent the 95% CIs. Red indicates a P value of less than 5% (worse prognosis) and blue indicates more than 5%.

Comment in

  • Colon Cancers Get a Negative (Selection) Attitude.
    Frey MR. Frey MR. Cell Mol Gastroenterol Hepatol. 2018 Jul 20;6(3):349. doi: 10.1016/j.jcmgh.2018.06.009. eCollection 2018. Cell Mol Gastroenterol Hepatol. 2018. PMID: 30182045 Free PMC article. No abstract available.

References

    1. Hanahan D., Weinberg R.A. Hallmarks of cancer: the next generation. Cell. 2011;144:646–674. - PubMed
    1. Greaves M., Maley C.C. Clonal evolution in cancer. Nature. 2012;481:306–313. - PMC - PubMed
    1. Martincorena I., Raine K.M., Gerstung M., Dawson K.J., Haase K., Van Loo P., Davies H., Stratton M.R., Campbell P.J. Universal patterns of selection in cancer and somatic tissues. Cell. 2017;171:1029–1041 e21. - PMC - PubMed
    1. Bakhoum S.F., Landau D.A. Cancer evolution: no room for negative selection. Cell. 2017;171:987–989. - PubMed
    1. Leach F.S., Nicolaides N.C., Papadopoulos N., Liu B., Jen J., Parsons R., Peltomaki P., Sistonen P., Aaltonen L.A., Nystrom-Lahti M., Zhang G.J., Meltzer P.S., Yu J.W., Kao F.T., Chen D.J., Cerosaletti K.M., Fournier R.E.K., Todd S., Lewis T., Leach R.J., Naylor S.L., Weissenbach J., Mecklin J.P., Jarvinen H., Petersen G.M., Hamilton S.R., Green J., Jass J., Watson P., Lynch H.T., Trent J.M., de la Chapelle A., Kinzler K.W., Vogelstein B. Mutations of a mutS homolog in hereditary nonpolyposis colorectal cancer. Cell. 1993;75:1215–1225. - PubMed

Publication types