. 2018 Sep;12(9):1608-1622.
doi: 10.1002/1878-0261.12354. Epub 2018 Aug 16.

A patient-derived explant (PDE) model of hormone-dependent cancer

Affiliations

A patient-derived explant (PDE) model of hormone-dependent cancer

Margaret M Centenera et al. Mol Oncol. 2018 Sep.

Abstract

Breast and prostate cancer research to date has largely been predicated on the use of cell lines in vitro or in vivo. These limitations have led to the development of more clinically relevant models, such as organoids or murine xenografts that utilize patient-derived material; however, issues related to low take rate, long duration of establishment, and the associated costs constrain use of these models. This study demonstrates that ex vivo culture of freshly resected breast and prostate tumor specimens obtained from surgery, termed patient-derived explants (PDEs), provides a high-throughput and cost-effective model that retains the native tissue architecture, microenvironment, cell viability, and key oncogenic drivers. The PDE model provides a unique approach for direct evaluation of drug responses on an individual patient's tumor, which is amenable to analysis using contemporary genomic technologies. The ability to rapidly evaluate drug efficacy in patient-derived material has high potential to facilitate implementation of personalized medicine approaches.

Keywords: ex vivo culture; patient-derived explant; preclinical tumor model.


Figures

Figure 1
Figure 1
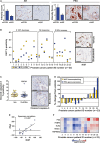
PDE culture sustains tissue morphology, viability, and endocrine signaling. (A) PDE tissue culture method. (i) Following surgery, a core of tumor tissue is removed by a pathologist (tumor area demarcated by broken white line), (ii) the tumor sample is dissected into 1‐mm3 fragments, (iii) cultured in 24‐well plates on a gelatin sponge sitting in media, allowing direct comparison of treatments in matched tumor tissue, and (iv) schematic diagram of PDE setup. (B) Representative hematoxylin and eosin staining of PDEs from primary prostate and breast tumors, showing maintenance of gross morphology following 6 days in culture. Arrows indicate examples of tumor cells and surrounding stroma. (C) HIF1α staining from three independent laboratories showed no significant difference in prostate cancer tissue oxygenation after 6 days of PDE culture. Staining intensity was manually assessed by a single pathologist (P. Kapur). Data are presented as mean ± SEM, n = 3. (D) Expression and signaling of steroid receptors critical for prostate and breast carcinogenesis were maintained in PDEs cultured in complete media for 6 days, as demonstrated by immunostaining for AR and the AR‐regulated protein PSA in prostate PDEs, and ERα and the ERα‐regulated protein PGR in breast cancer PDEs. Scale bars represent 50 μm.
Figure 2
Figure 2
Proliferative capacity of PDEs. (A) De novo proliferation of tumor cells in PDE cultured tissues is demonstrated by BrdU uptake in a representative prostate cancer explant. (B) The distribution of BrdU uptake is similar to expression of the proliferative marker Ki67 as shown in a representative prostate cancer PDE. (C) Representative images and quantitation of Ki67 immunostaining in prostate (n = 9) and breast (n = 8) tissue at Day 0 and in PDEs cultured for up to 96 h in complete media. *ANOVA: Day 0 versus time points, P = 0.0007 for prostate; P = 0.0013 for breast. All scale bars represent 50 μm.
Figure 3
Figure 3
Modulation of AR signaling in prostate cancer PDEs. (A) Steady‐state protein levels of AR and the AR‐regulated protein PSA were knocked down in prostate cancer PDEs (n = 3) cultured in media containing lentiviral‐based shRNA directed against AR (shAR) compared with scrambled control (shCON). Scale bars represent 50 μm. (B) Quantitation and representative images of Ki67 immunostaining in PDEs derived from 23 patients following 48 h culture with vehicle control or bicalutamide (10 μm). A response to bicalutamide was considered significant when treatment induced a change from vehicle of ≥ 25%. Scale bars represent 50 μm. (C) Quantitation and representative images of cleaved caspase‐3 immunostaining in PDEs derived from 23 patients following 48‐h culture with vehicle control or bicalutamide (10 μm). Data are presented as mean ± SEM. Scale bars represent 50 μm. (D) Water fall plot of percent change in PSA gene expression and Ki67 immunostaining from a subset of PDEs from (A) treated with vehicle control or bicalutamide (n = 12). (E) Scatterplot of the data from D showing a positive correlation between Ki67 and PSA with Spearman's r = 0.657 (P < 0.05). (F) Heat map visualization of qRTPCR analysis of classic AR‐regulated transcripts in bicalutamide‐treated PDEs compared to vehicle (n = 12).
Figure 4
Figure 4
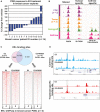
Modulation of ERα signaling in breast cancer PDEs. (A) qPCR analysis of PGR expression shows differential response to 10 nm E2 in breast cancer PDEs (n = 14). Samples with ≥ 50% change compared to vehicle were considered responsive. Data are presented as the mean ± SEM. (B) ChIP‐sequencing analysis of ERα binding sites in breast cancer PDEs (n = 3), untreated primary breast cancers (n = 3), an in vivo xenograft tumor grown from the ERα‐positive MCF7 cell line, and MCF7 cells cultured in vitro (n = 2). Shown are examples of ERα binding events that are shared by all models (RARA), present only in in vivo models (SLCO5A1) or present only in cell line models (TOB1/SPAG9). (C) Venn diagram showing the overlap of ERα binding sites identified in PDEs treated with E2 or E2+ R5020. Only ChIP‐seq peaks identified in at least two tumors were considered included. Heat map of treatment‐specific binding events from the Venn diagram. Data were centered at the top of the peak and visualized with a 5‐kb window around the peak. (D) ERα ChIP‐seq binding sites identified in E2− or E2+ R5020‐treated breast cancer PDEs. Examples of common binding sites (upper panel) and treatment‐specific binding (lower panel) sites are shown.

References

    1. Ali S and Coombes RC (2002) Endocrine‐responsive breast cancer and strategies for combating resistance. Nat Rev Cancer 2, 101–112. - PubMed
    1. Armstrong HK, Gillis JL, Johnson IRD, Nassar ZD, Moldovan M, Levrier C, Sadowski MC, Chin MY, Tomlinson Guns ES, Tarulli G et al (2018) Dysregulated fibronectin trafficking by Hsp90 inhibition restricts prostate cancer cell invasion. Sci Rep 8, 2090. - PMC - PubMed
    1. Arnedos M, Vielh P, Soria JC, Andre F (2013) The genetic complexity of common cancers and the promise of personalized medicine: is there any hope? J Pathol 232, 274–282. - PubMed
    1. Attard G, Richards J and de Bono JS (2011) New strategies in metastatic prostate cancer: targeting the androgen receptor signaling pathway. Clin Cancer Res 17, 1649–1657. - PMC - PubMed
    1. Barbieri CE, Bangma CH, Bjartell A, Catto JW, Culig Z, Gronberg H, Luo J, Visakorpi T and Rubin MA (2013) The mutational landscape of prostate cancer. Eur Urol 64, 567–576. - PMC - PubMed

Publication types

MeSH terms