. 2018 Aug 17;14(8):e1007261.
doi: 10.1371/journal.ppat.1007261. eCollection 2018 Aug.

Stearoly-CoA desaturase 1 differentiates early and advanced dengue virus infections and determines virus particle infectivity

Affiliations

Stearoly-CoA desaturase 1 differentiates early and advanced dengue virus infections and determines virus particle infectivity

Rebekah C Gullberg et al. PLoS Pathog. .

Abstract

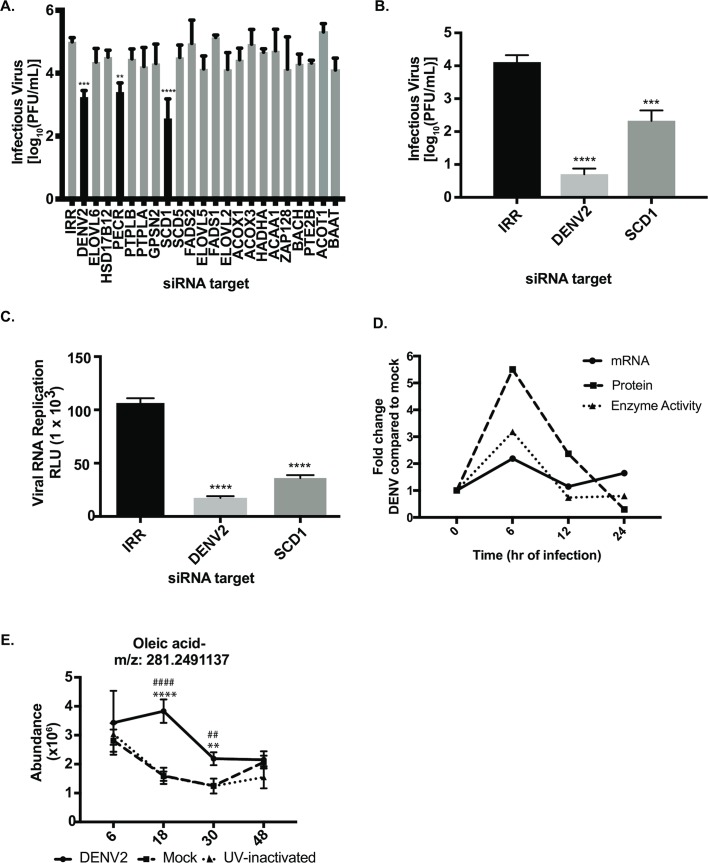
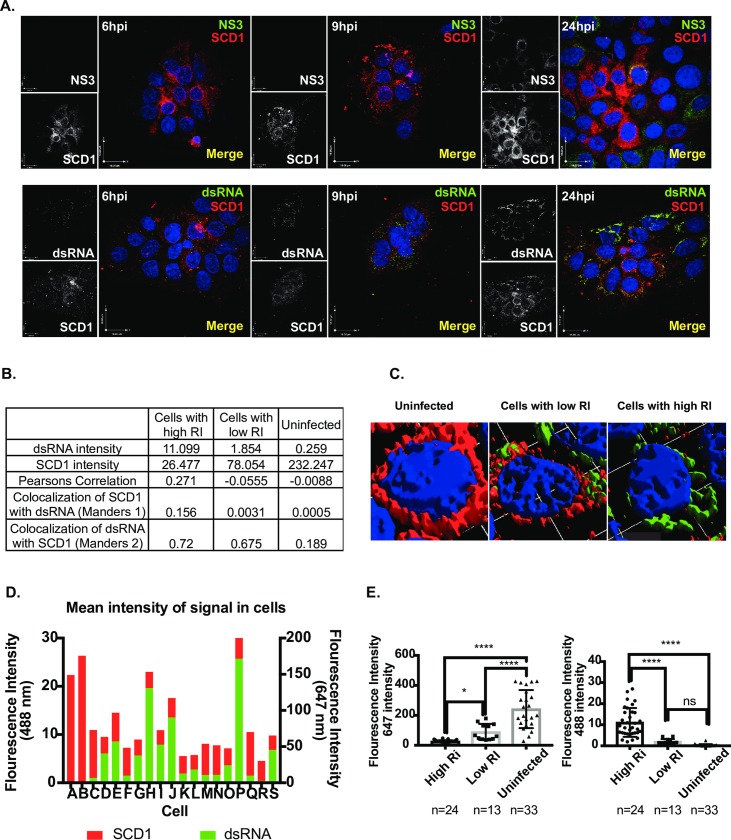
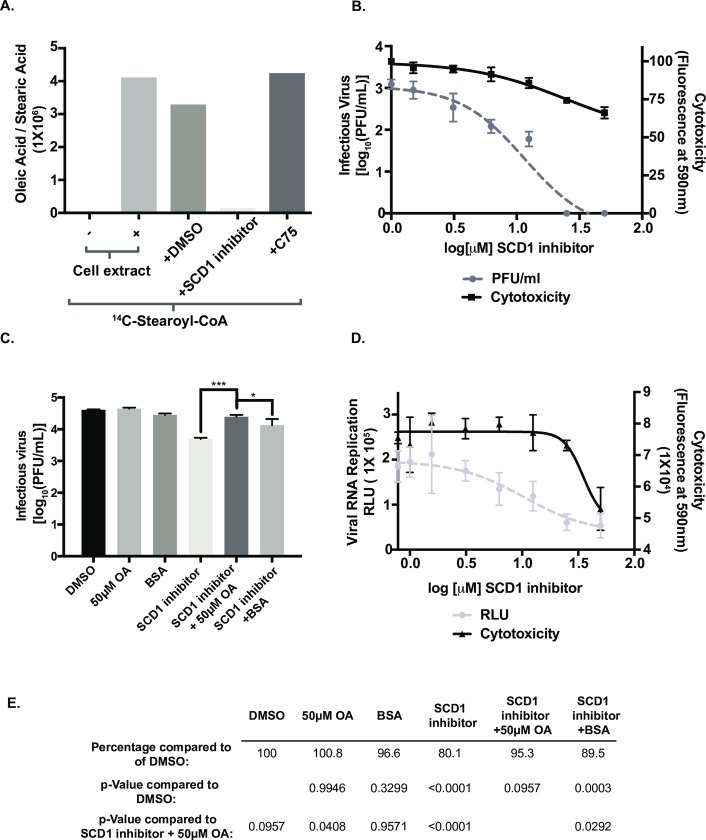
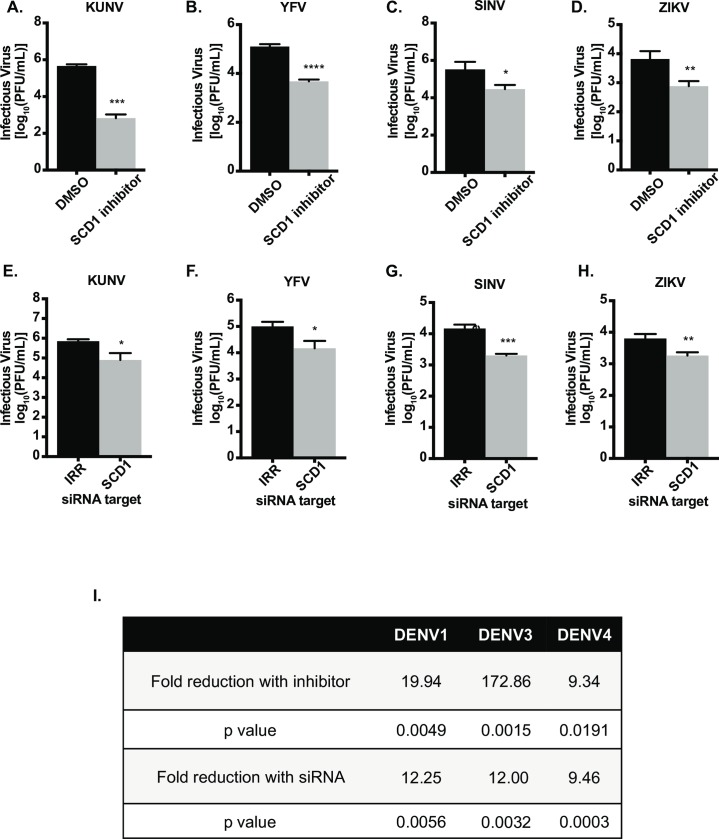
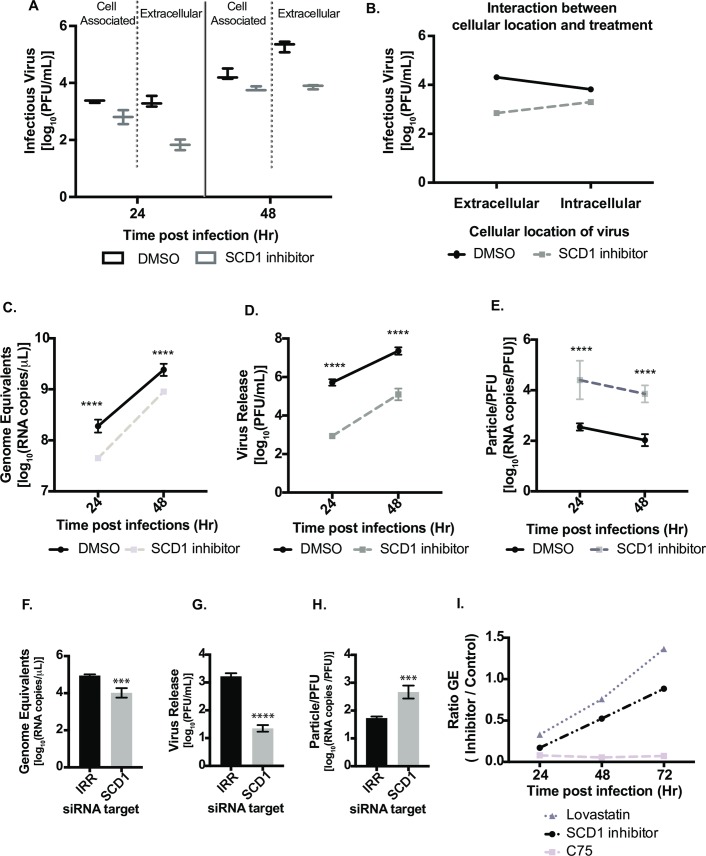
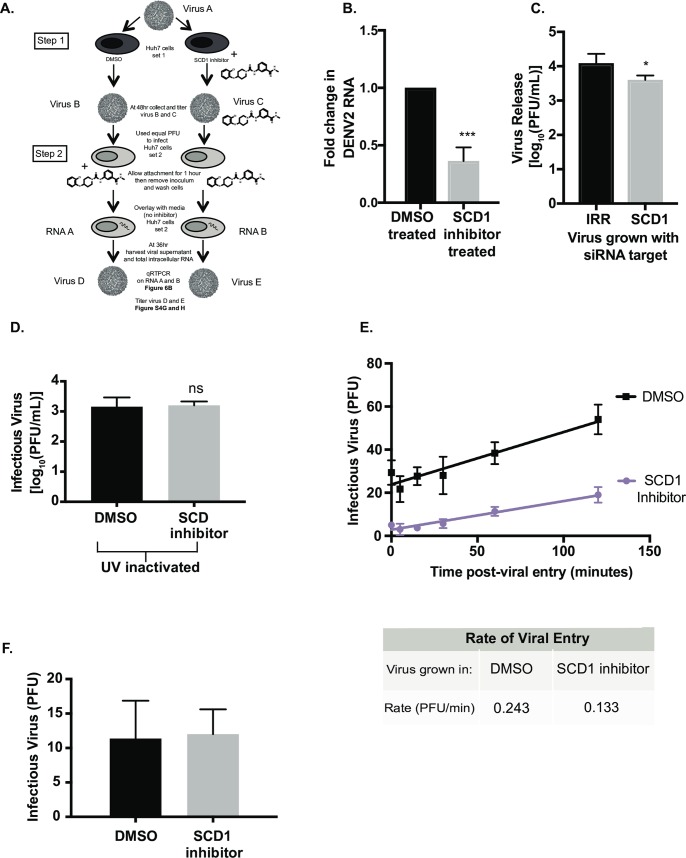
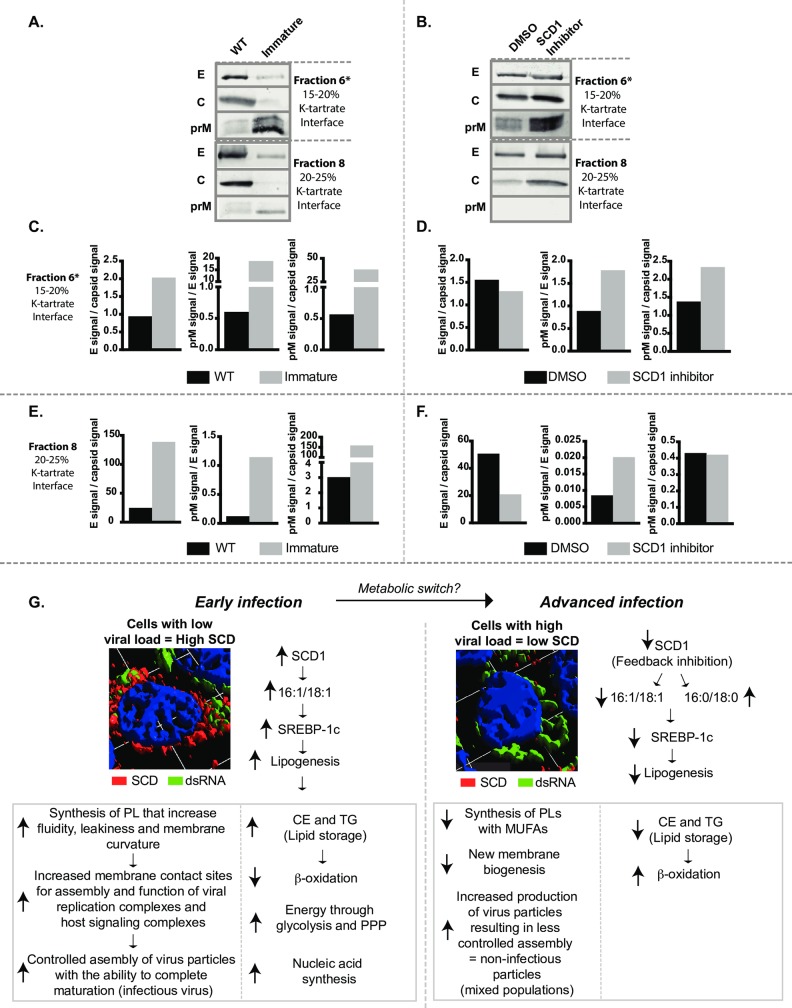
Positive strand RNA viruses, such as dengue virus type 2 (DENV2) expand and structurally alter ER membranes to optimize cellular communication pathways that promote viral replicative needs. These complex rearrangements require significant protein scaffolding as well as changes to the ER chemical composition to support these structures. We have previously shown that the lipid abundance and repertoire of host cells are significantly altered during infection with these viruses. Specifically, enzymes in the lipid biosynthesis pathway such as fatty acid synthase (FAS) are recruited to viral replication sites by interaction with viral proteins and displayed enhanced activities during infection. We have now identified that events downstream of FAS (fatty acid desaturation) are critical for virus replication. In this study we screened enzymes in the unsaturated fatty acid (UFA) biosynthetic pathway and found that the rate-limiting enzyme in monounsaturated fatty acid biosynthesis, stearoyl-CoA desaturase 1 (SCD1), is indispensable for DENV2 replication. The enzymatic activity of SCD1, was required for viral genome replication and particle release, and it was regulated in a time-dependent manner with a stringent requirement early during viral infection. As infection progressed, SCD1 protein expression levels were inversely correlated with the concentration of viral dsRNA in the cell. This modulation of SCD1, coinciding with the stage of viral replication, highlighted its function as a trigger of early infection and an enzyme that controlled alternate lipid requirements during early versus advanced infections. Loss of function of this enzyme disrupted structural alterations of assembled viral particles rendering them non-infectious and immature and defective in viral entry. This study identifies the complex involvement of SCD1 in DENV2 infection and demonstrates that these viruses alter ER lipid composition to increase infectivity of the virus particles.


Conflict of interest statement

The authors have declared that no competing interests exist.

Figures

Fig 1
Fig 1. siRNA screen of the UFA biosynthesis pathway indicates that the rate-limiting enzyme is key for DENV2 replication.
(A) Huh7 cells were transfected with pools of four siRNAs targeting each gene and infected with DENV2. Infectious virus release was measured by plaque assay. (B) Validation of results using a single siRNA targeting SCD1 as well as indicated controls. (C) siRNAs were electroporated into Huh7 cells along with a luciferase-expressing DENV2 replicon. Viral RNA replication was measured by luciferase expression. (D) Huh7 cells were infected with DENV2 (MOI = 10) and cells were harvested at indicated time points and processed for gene expression, protein levels or enzymatic activity. Fold change in SCD1 mRNA in virus-infected cells was compared to mock-infected cells. qRT-PCR results are normalized to GAPDH. The same cells were flash frozen to preserve active enzymes. Cytoplasmic extracts were prepared and run on a western blot and probed for SCD1. Protein levels were normalized to actin. For enzyme activity measurements, TLC was carried out to measure conversion of 14C-labeled Stearoyl-CoA to 14C-labeled-oleic acid. The quantification of these 3 assays (mRNA, protein and SCD1 activity) is shown here. Results from a single representative experiment are presented. Three independent biological replicates showed similar temporal trends. (E) Huh7 cells were infected with DENV2, a UV-inactivated DENV2 or mock-infected. Five biological replicates were included at each time point. Metabolites were extracted and untargeted LC-MS was performed to measure the abundance of oleic acid at each time point. SCD1: stearoyl CoA desaturase, IRR: irrelevant siRNA (without a biological target for the siRNA sequence), DENV2: siRNA against dengue virus, serotype 2 genome. (A-C: one-way ANOVA with multiple comparisons tests: ** = p<0.05, *** = p<0.001, **** = p<0.0005, For E: DENV2 vs. mock: ** = p<0.001, **** = p<0.0001 and DENV2 vs UVI: ## = p<0.001, #### = p<0.0001).
Fig 2
Fig 2. SCD1 protein expression is modulated with level of viral replication.
(A) Immunofluorescence analysis of Huh7 cells uninfected or infected with DENV2 at three time points. Viral protein NS3 or dsRNA (488nm, green), SCD1 (647nm, red). (B) Cells were classified as uninfected, low or high viral RI, based on their dsRNA (488 nm, green) signal. A summary of the mean intensities of dsRNA and SCD1 in the 3 cell populations with co-localization coefficients: Pearsons global correlation and Manders correlation M1 and M2. (C) 3-D reconstructions of 3 representative cells at 36hr showing dsRNA and SCD1. (D) Mean fluorescent intensity of dsRNA and SCD1 signals was measured in each cell of a representative image frame at 36hr. (E) Mean fluorescent intensity of each cell in multiple images is shown as a dot plot. The average 488 nm (dsRNA, green) signal and 647 nm (SCD1, red) signal for each group of cells is plotted as a bar graph. (ns = not significant, ** = p<0.005, *** = p<0.001, **** = p<0.0001, from a one-way ANOVA with a multiple comparisons tests), hpi: hours post-infection, RI: Replicative Intermediate.
Fig 3
Fig 3. Oleic acid supplementation following inhibition of SCD1 rescues viral replication.
(A) The production of 14C-labeled oleic acid and stearic acid in uninfected cell extracts were quantified and compared across indicated conditions. (B) Infectious virus release from Huh7 cells infected with DENV2 (MOI = 0.5) and treated with the indicated concentrations of the SCD1 inhibitor for 24hr. Cytotoxicity was also measured. (C) Huh7 cells were infected with DENV and treated with 10 μM SCD1 inhibitor and 50 μM oleic acid conjugated to BSA or indicated controls. At 24hr post infection virus was collected and titrated by plaque assay. (D) Huh7 cells were electroporated with RNA from a DENV2 luciferase-expressing replicon and treated with the indicated concentrations of the SCD1 inhibitor. RLU and cytotoxicity was measured at 24hr. (E) The virus titers in part C were quantified and their percent compared to DMSO to better represent the levels of inhibition and rescue. (* = p = 0.05, *** = p<0.001, from a one-way ANOVA with a multiple comparisons test).
Fig 4
Fig 4. Inhibition and knockdown of SCD1 reduces replication of multiple enveloped viruses.
Huh7 cells were infected with (A) KUNV (MOI = 0.1), (B) YFV (MOI = 0.1), (C) SINV (MOI = 0.01) or (D) ZIKV (MOI = 0.5) and treated with 10μM of the SCD1 inhibitor or DMSO. (E-H) Huh7 cells were transfected with IRR or SCD1 specific siRNA and infected after 48hr of knockdown with (E) KUNV (MOI = 0.1), (F) YFV (MOI = 0.1), (G) SINV (MOI = 0.01) or (H) ZIKV (MOI = 0.5). Supernatants were collected at 24hr post infection for KUNV, YFV and ZIKV, and at 8hr post infection for SINV according to the time point for maximum viral replication. Virus release was quantified by plaque assay on BHK cells. (I) Summary of results for DENV serotypes 1, 3 and 4. Inhibitor and siRNA analyses were done similar to the previous experiments. Unpaired t-tests were performed for all experiments indicating significant reduction in viral replication with inhibition or knockdown of SCD1. (* = p<0.05, ** = p<0.01, *** = p<0.0005, **** = p<0.0001) compared to control).
Fig 5
Fig 5. Inhibition of SCD1 impacts viral particle infectivity.
Huh7 cells were infected with DENV2, MOI = 1 and treated with SCD1 inhibitor or DMSO. (A) Virus in supernatants (extracellular) and cell-associated virus were collected at 24 and 48hr and quantified by plaque assay. (B) Statistical interaction plot of data from A. The non-parallel lines indicate interaction between the cellular location of the virus and the treatment. A three-way ANOVA confirmed this interaction with a p = 1.600e-06. (C-E) Huh7 cells were infected with DENV2 and treated with the SCD1 inhibitor or DMSO. Supernatants were collected at 24 and 48hr. Virus was quantified by plaque assay. Virus RNA was extracted from the same samples for qRT-PCR analysis. (C) GE were determined by qRT-PCR using a standard curve of viral RNA copies. (D) The titer of the viruses at each time point as determined by plaque assay. (E) The particle:pfu ratio was calculated by dividing the RNA copies/mL by the PFU/mL from C and D. (F-H) Huh7 cells were transfected with siRNAs for SCD1 or an irrelevant target (IRR) and incubated for 48hr. They were then infected with DENV2 (MOI = 0.1) and supernatant was collected after 24hr. Virus was quantified by plaque assay. Viral RNA was extracted from the same samples for qRT-PCR analysis. (F) GE were determined by qRT-PCR using a standard curve of viral RNA copies. (G) The titer of the viruses was determined at each time point by plaque assay. (H) The particle:pfu ratio was calculated by dividing the RNA copies/mL by the PFU/mL from F and G. (I) Comparison of GE in cells treated with the SCD1 inhibitor to those treated with lipid synthesis inhibitors, C75 and Lovastatin. [Inhibitor: (Genome equivalents/mL) / DMSO: (Genome equivalents/mL)]. (*** = p<0.005, **** = p<0.0001). GE: Genome equivalents.
Fig 6
Fig 6. Infectious particles grown in the presence of the SCD1 inhibitor are slower to infect new cells.
(A) Schematic of the experimental design: Step 1: Huh7 cells (set 1) were infected with DENV2, MOI = 3 (Virus A) and treated with DMSO or the SCD1 inhibitor. At 48hr the virus was titrated (Virus B and C). Step 2: This virus was used to infect naïve Huh7 cells (set 2) at a MOI of 0.1. The concentration of inhibitor remaining in viral supernatant C was mimicked by adding inhibitor to viral supernatant B during attachment. Cells were washed and overlaid with media without inhibitor and incubated for 36hr. Total RNA (RNA A and B) and virus supernatant (Virus D and E) were collected. (B) Viral RNA copies (RNA A and B) from Huh7 cells (set 2) were measured by qRT-PCR. The fold change of viral RNA copies in RNA B compared to RNA A is shown. (C) Huh7 cells with siRNA knockdown of SCD1 or an irrelevant control were infected with DENV2 (MOI = 0.1) for 48hr. Virus supernatant was collected and titrated. This virus was used to infect new Huh7 cells with an equal MOI (0.3). Virus was grown for 48hr and the supernatant was titrated. (D) Supernatants were collected from DENV infected cells with or without the inhibitor and UV-inactivated. WT DENV2 was then diluted in these UV-treated supernatants and used to infect new cells with an equal MOI. (E) Virus grown with the SCD1 inhibitor was again titrated and used to infect BHK cells with 100pfu/well. Attachment was allowed to occur at 4°C for 2hr, the temperature was shifted to 37°C and the cells were treated with acid glycine at the indicated time points after infection to inactivate un-internalized virus. Cells were overlaid with agarose and plaques were counted at 6 days. A linear regression was performed. The slope of the entry of the virus grown in the presence of the SCD1 inhibitor was 0.14PFU/min and DMSO was 0.27 PFU/min. (F) Huh7 cells were infected with DENV2 (MOI = 3) and treated with SCD1 inhibitor or DMSO. Supernatants were collected at 48hr, RNA was extracted, viral RNA copies were measured by qRT-PCR. Equal RNA copies were transfected into BHK cells to allow plaques to form. (ns = not significant, *** = p<0.001, from a two-tailed t-test).
Fig 7
Fig 7. Inhibition of SCD1 Impairs viral maturation.
Huh7 cells were infected with DENV2 and left untreated (WT), treated with 20 mM NH4Cl (immature), 10 μM SCD1 inhibitor, or vehicle (DMSO). (A) and (B) At 72 hr post-infection virus purified by density gradient sedimentation. Bands (fractions 6 and 8) where the highest concentration of genomes were observed (and previously known to have virus particles) were buffer-exchanged, concentrated and processed by western blot with antibodies for envelope, capsid and prM proteins. (C-F) The relative quantification of the viral glycoproteins prM and E in fractons 6 and 8. (G) A proposed model for metabolic changes involving SCD1 that differentiates the metabolic state in early versus advanced DENV2 infections. E: envelope protein, c: capsid protein, prM: pre-membrane protein, CE: cholesterol Esters, TG: triglycerides.

Similar articles

Cited by

References

    1. McMahon H. T. and Gallop J. L. (2005) ‘Membrane curvature and mechanisms of dynamic cell membrane remodelling.’, Nature, 438(7068), pp. 590–6. 10.1038/nature04396 - DOI - PubMed
    1. Zimmerberg J. and Kozlov M. M. (2006) ‘How proteins produce cellular membrane curvature.’, Nature reviews. Molecular cell biology. Nature Publishing Group, 7(1), pp. 9–19. 10.1038/nrm1784 - DOI - PubMed
    1. Paton C. M. and Ntambi J. M. (2009) ‘Biochemical and physiological function of stearoyl-CoA desaturase.’, American journal of physiology. Endocrinology and metabolism, 297(1), pp. E28–37. 10.1152/ajpendo.90897.2008 - DOI - PMC - PubMed
    1. Sampath H. and Ntambi J. M. (2014) ‘Role of stearoyl-CoA desaturase-1 in skin integrity and whole body energy balance.’, The Journal of biological chemistry, 289(5), pp. 2482–8. 10.1074/jbc.R113.516716 - DOI - PMC - PubMed
    1. Ntambi J. M., Miyazaki M. and Dobrzyn A. (2004) ‘Regulation of stearoyl-CoA desaturase expression.’, Lipids, 39(11), pp. 1061–5. - PubMed

Publication types

MeSH terms