. 2018 Aug 17;13(8):e0202323.
doi: 10.1371/journal.pone.0202323. eCollection 2018.

TLR4-mediated activation of the ERK pathway following UVA irradiation contributes to increased cytokine and MMP expression in senescent human dermal fibroblasts

Affiliations

TLR4-mediated activation of the ERK pathway following UVA irradiation contributes to increased cytokine and MMP expression in senescent human dermal fibroblasts

Seong-Wook Seo et al. PLoS One. .

Abstract

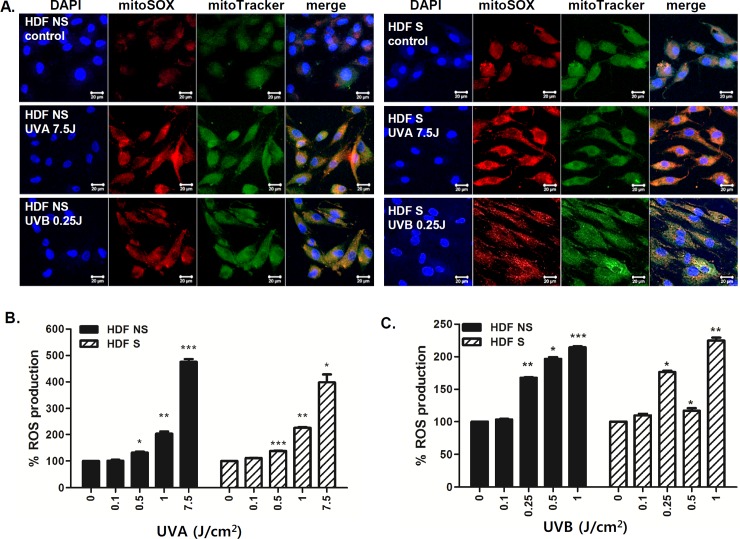
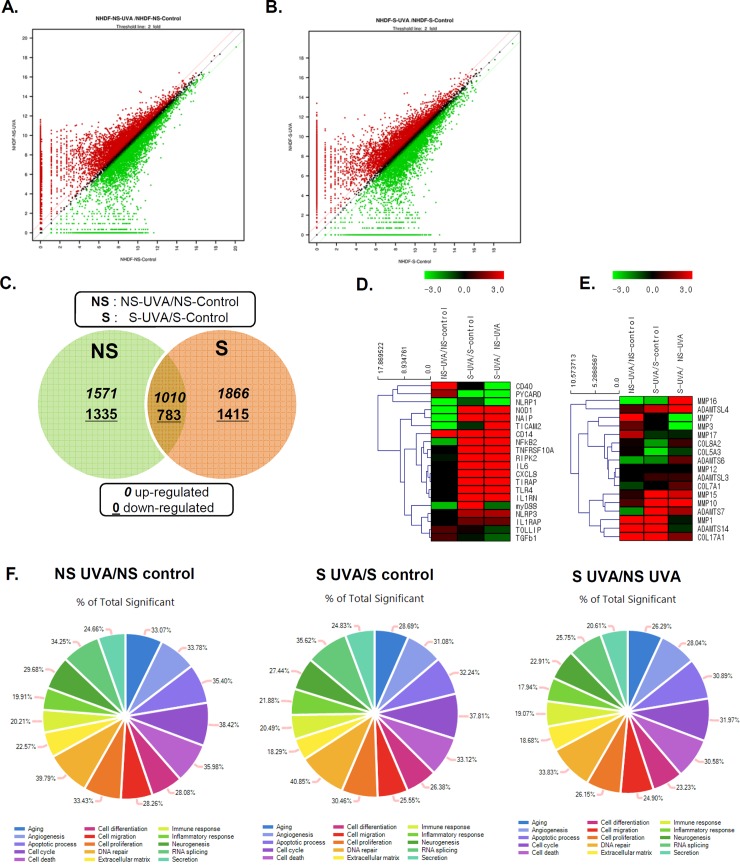
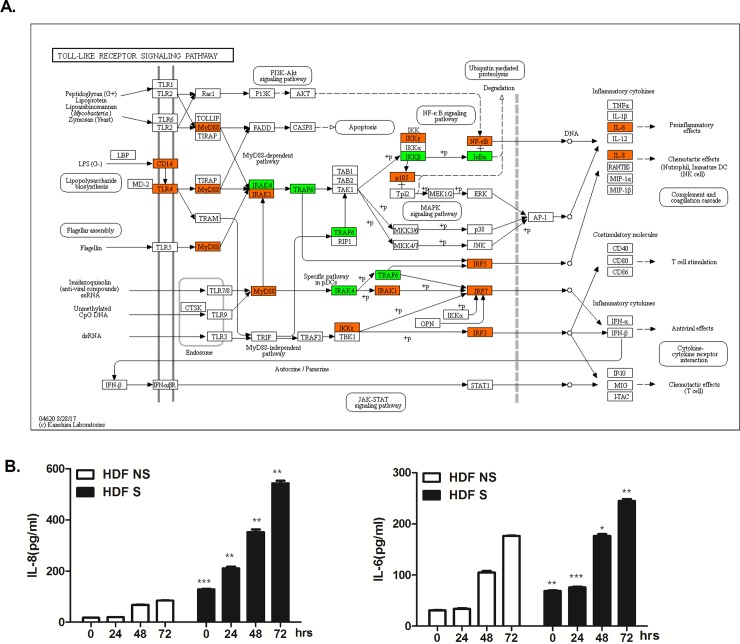
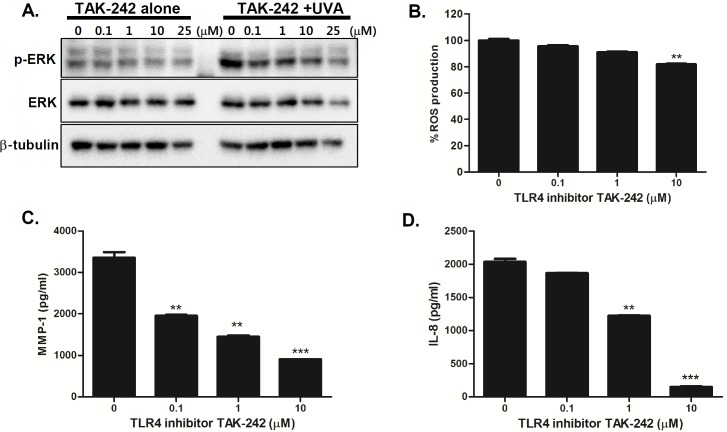
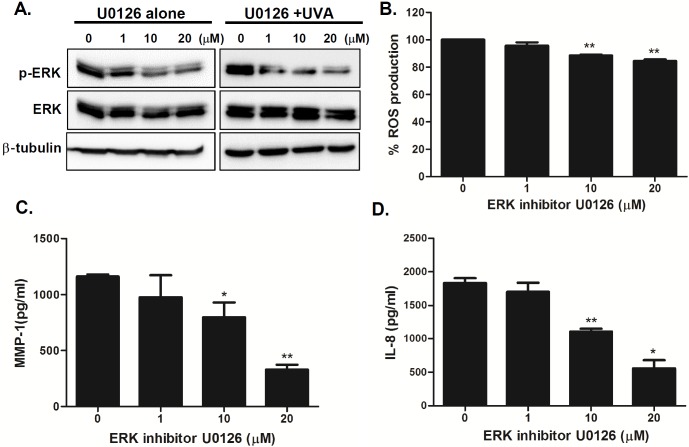
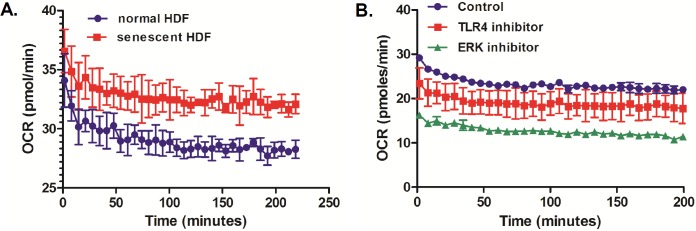
Exposure to ultraviolet (UV) radiation is a major contributing factor to premature aging (photoaging) and skin cancer. In vitro models of cellular senescence have proven to be very useful for the study of slow and progressive accumulation of damage resulting in the growth arrest of aging skin cells. In this study, we compared UVA-induced cellular responses in non-senescent (NS) vs. senescent (S) human dermal fibroblasts (HDFs). HDFs were irradiated with a single dose of UVA (7.5 J/cm2) and QuantSeq 3' mRNA sequencing was performed to assess differential gene expression. Both NS and S HDFs expressed similar numbers of differentially expressed genes, although distinct sets of genes were differentially expressed between the two groups. Higher expression of matrix metalloproteinases (MMPs) and Toll-like receptor (TLR) pathway genes, such as TLR4, MyD88, and CXCL-8, was detected in S HDFs as compared with NS HDFs, and UVA exposure led to a downregulation of collagen genes, such as COL8A2 and COL5A3. Consistent with gene expression profiling, enhanced IL-6 and IL-8 secretion was observed in S HDFs compared with NS HDFs, in response to UVA. Furthermore, we show that TLR4-mediated ERK pathway is responsible for the UVA-mediated mitochondrial dysfunction as well as increased secretion of MMP-1 and IL-8 in S HDFs. Taken together, our results demonstrate the UVA-induced common and distinct molecular patterns of cellular responses between NS and S HDFs and suggest TLR4/ERK pathways as candidate targets to reduce senescent phenotypes.


Conflict of interest statement

The authors have declared that no competing interests exist.

Figures

Fig 1
Fig 1. Cellular characteristics of NS and S HDFs following UV exposure.
(A)Normal or non-senescent (NS) and senescent (S) HDFs were irradiated with UVA (7.5 J/cm2) or UVB (0.25 J/cm2). The extent of senescence-associated β-galactosidase (SA-β-Gal) staining after UV irradiation was observed. Scale bar = 50 μm. (B, C) Immunofluorescence analysis of γ-H2AX foci formation was performed by confocal microscopy. DAPI (blue), γ-H2AX foci (red), and merge images are shown. Scale bar = 10 μm. The graph shows the number of γ-H2AX foci per cell. The data represent the mean ± SEM of three independent sets of experiments.
Fig 2
Fig 2. The effect of UV irradiation on ROS production in NS and S HDFs.
NS and S HDFs were irradiated with UVA (7.5 J/cm2) or UVB (0.25 J/cm2) for 2 h. (A) Cells were double-stained with DAPI (blue) and MitoSOX (red) or MitoTracker (green) and examined by confocal microscopy. Images are representative of three independent experiments; scale bar = 20 μm. (B,C) Cells were irradiated with various doses of UVA or UVB for 24 h. Total cellular ROS levels were determined by measuring DCF-DA levels using a spectrofluorometer. Percentage of ROS production in response to UVA (B) and UVB (C) is shown in the graphs. Data are presented as percentage normalized to the control (DMSO-treated cells). *p < 0.05; **p < 0.01; ***p < 0.001 vs. control cells.
Fig 3
Fig 3. Global overview of the gene expression profile of UVA-irradiated HDFs.
NS and S HDFs were irradiated with UVA (7.5 J/cm2) for 24 h. RNA was isolated and QuantSeq 3′ mRNA sequencing was performed. (A, B) A scatter plot is shown. The X-axis shows the expression level of genes from control groups, whereas the Y-axis shows the expression level of genes from UVA-irradiated NS (A) and S (B) HDFs. The red dots represent relatively highly expressed genes in UVA-irradiated groups, whereas the green dots represent relatively highly expressed genes in control groups. (C) Venn diagrams of overlapping differentially expressed genes (DEGs) profiles for NS and S cells. DEGs correspond to those displaying a change of more than 2-fold with a q-value of less than or equal to 0.05. The mRNA differential expression levels in UVA-irradiated NS and S cells compared with control are depicted in three overlapping circles for 2-fold up- and downregulation. The numbers indicate the mRNA counts in the indicated area. (D, E) Heatmap displays the enrichment of immune response and inflammation-related genes (D) and extracellular matrix genes (E), such as MMPs, in samples. Red, black, and green colors indicate levels of gene expression above, equal to, and below the mean, respectively. (F) Composite images of gene ontology (GO) graph are shown. The circle and bar indicate the GO terms related to gene functions and percentage of differentially expressed upregulated genes in each category, respectively.
Fig 4
Fig 4. Validation of DEGs in UVA-irradiated S cells that are involved in skin senescence.
(A) KEGG analysis shows the list of DEGs involved in Toll-like receptor signaling pathway. The orange, green, and white colors indicate significantly increased, significantly decreased, and unchanged gene expression between normal vs UVA-treated S HDFs, respectively. (B) NS and S HDFs were irradiated with UVA (1 J/cm2) and cultured for the indicated time periods (0, 4, 24, 48, and 72 h). IL-6 and IL-8 production levels in the culture media were measured by ELISA. The results are expressed as mean ± SEM of three different experiments. *p < 0.05, **p < 0.01, ***p < 0.001 vs. NS HDFs at each timepoints.
Fig 5
Fig 5. TLR4 inhibition suppresses UVA-induced MMP-1 and IL-8 production in UVA-irradiated senescent HDFs.
(A) Senescent HDFs were treated overnight with different concentrations of TAK242 (TLR4 inhibitor) and irradiated with UVA (1 J/cm2). Cells were cultured for 4 h and protein levels of phosphorylated/total ERK were analyzed by western blotting. Anti-β-tubulin monoclonal antibody was used as a loading control. The images shown are representative of three independent experiments. (B) Total cellular ROS levels were determined by measuring DCF-DA levels using a spectrofluorometer. % ROS production in response to UVA is shown in the graph. Data are presented as percentage compared to the control (DMSO-treated cells). *p < 0.05, **p < 0.01, ***p < 0.001 vs. control cells. (C) MMP-1 and (D) IL-8 secretion levels in the culture supernatant were measured by ELISA. The values are mean ± SEM of three different experiments. *p < 0.05, **p < 0.01, ***p < 0.001 vs. control cells.
Fig 6
Fig 6. Inhibition of ERK pathway modulates UVA-induced MMP-1 and IL-8 production in UVA-irradiated senescent HDFs.
(A) Senescent HDFs were treated overnight with different concentrations of U0126 (ERK inhibitor) and irradiated with UVA (1 J/cm2). Cells were cultured for 4 h and protein levels of phosphorylated/total ERK were analyzed by western blotting. Anti-β-tubulin monoclonal antibody was used as a loading control. The images shown are representative of three independent experiments. (B) Total cellular ROS levels were determined by measuring DCF-DA levels using a spectrofluorometer. % ROS production in response to UVA is shown in the graph. Data are presented as percentage compared to the control (DMSO-treated cells). (C) MMP-1 and (D) IL-8 secretion levels in the culture supernatant were measured by ELISA. The values are mean ± SEM of three different experiments. *p < 0.05, **p < 0.01, ***p < 0.001 vs. control cells.
Fig 7
Fig 7. TLR4 or ERK-specific inhibitor treatment reduces oxygen consumption rate (OCR) in UVA-irradiated senescent HDFs.
(A) OCR was measured in normal (NS) and senescent (S) HDFs over 3 hours. (B) The graph shows changes in OCR in control, TLR4 inhibitor (10μM)-treated, ERK inhibitor (10μM) treated UVA-irradiated senescent HDFs. The results are expressed as mean ± SEM of three biological replicates.

References

    1. Matsumura Y, Ananthaswamy HN. Molecular mechanisms of photocarcinogenesis. Front Biosci. 2002;7:d765–83. . - PubMed
    1. Gilchrest BA. Photoaging. J Invest Dermatol. 2013;133(E1):E2–6. 10.1038/skinbio.2013.176 . - DOI - PubMed
    1. Yaar M, Gilchrest BA. Photoageing: mechanism, prevention and therapy. Br J Dermatol. 2007;157(5):874–87. 10.1111/j.1365-2133.2007.08108.x . - DOI - PubMed
    1. Scharffetter K, Wlaschek M, Hogg A, Bolsen K, Schothorst A, Goerz G, et al. UVA irradiation induces collagenase in human dermal fibroblasts in vitro and in vivo. Arch Dermatol Res. 1991;283(8):506–11. . - PubMed
    1. Battie C, Jitsukawa S, Bernerd F, Del Bino S, Marionnet C, Verschoore M. New insights in photoaging, UVA induced damage and skin types. Exp Dermatol. 2014;23 Suppl 1:7–12. 10.1111/exd.12388 . - DOI - PubMed

Publication types

MeSH terms

LinkOut - more resources