. 2018 Sep 4;115(36):E8368-E8377.
doi: 10.1073/pnas.1802568115. Epub 2018 Aug 17.

Material microenvironmental properties couple to induce distinct transcriptional programs in mammalian stem cells

Affiliations

Material microenvironmental properties couple to induce distinct transcriptional programs in mammalian stem cells

Max Darnell et al. Proc Natl Acad Sci U S A. .

Abstract

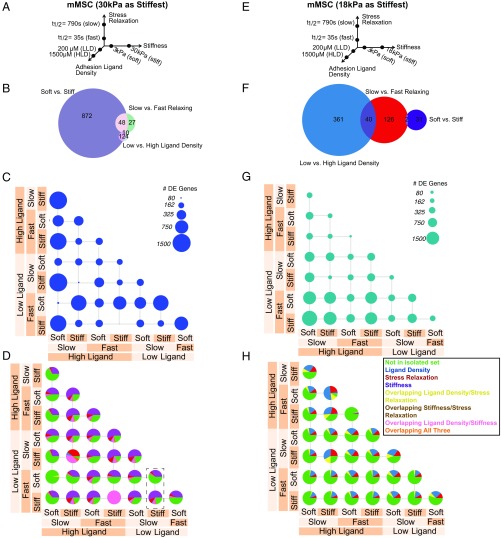
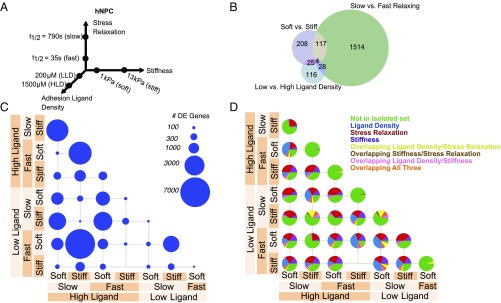
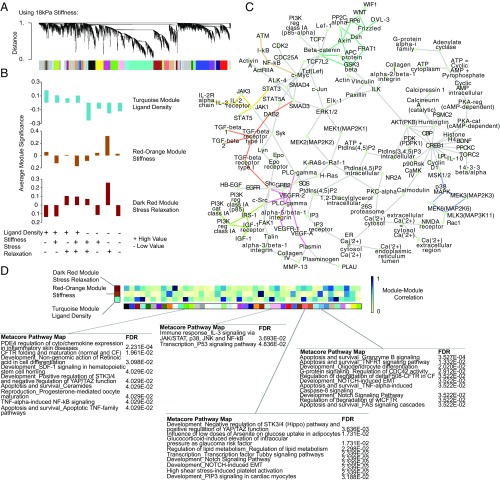
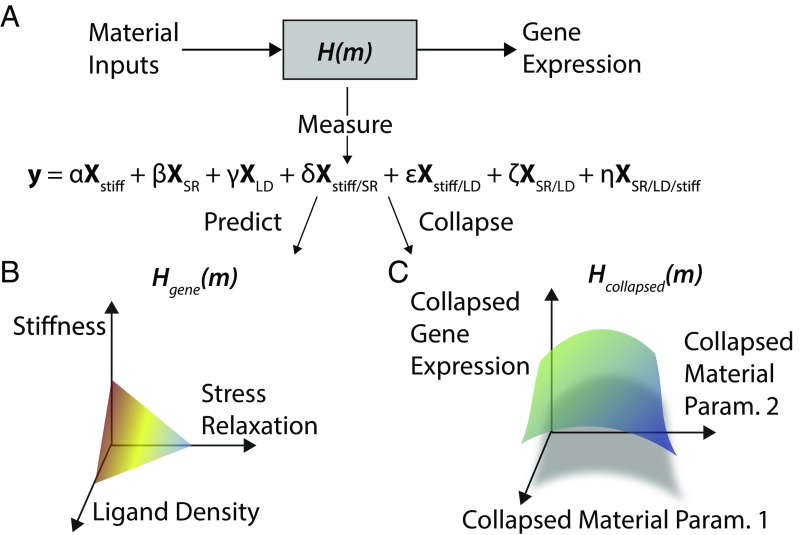
Variations in a multitude of material microenvironmental properties have been observed across tissues in vivo, and these have profound effects on cell phenotype. Phenomenological experiments have suggested that certain of these features of the physical microenvironment, such as stiffness, could sensitize cells to other features; meanwhile, mechanistic studies have detailed a number of biophysical mechanisms for this sensing. However, the broad molecular consequences of these potentially complex and nonlinear interactions bridging from biophysical sensing to phenotype have not been systematically characterized, limiting the overall understanding and rational deployment of these biophysical cues. Here, we explore these interactions by employing a 3D cell culture system that allows for the independent control of culture substrate stiffness, stress relaxation, and adhesion ligand density to systematically explore the transcriptional programs affected by distinct combinations of biophysical parameters using RNA-seq. In mouse mesenchymal stem cells and human cortical neuron progenitors, we find dramatic coupling among these substrate properties, and that the relative contribution of each property to changes in gene expression varies with cell type. Motivated by the bioinformatic analysis, the stiffness of hydrogels encapsulating mouse mesenchymal stem cells was found to regulate the secretion of a wide range of cytokines, and to accordingly influence hematopoietic stem cell differentiation in a Transwell coculture model. These results give insights into how biophysical features are integrated by cells across distinct tissues and offer strategies to synthetic biologists and bioengineers for designing responses to a cell's biophysical environment.

Keywords: RNA-seq; biomaterials; mechanotransduction; stem cells; systems biology.


Conflict of interest statement

The authors declare no conflict of interest.

Figures

Fig. 1.
Fig. 1.
Transcriptomic comparison of material parameter sensing in mMSCs. (AD) Transcriptomic comparison of material parameters sensing with 30 kPa as the high stiffness. (EH) Transcriptomic comparison of material parameters sensing with 18 kPa as the high stiffness. (A and E) Schematic of experimental conditions for mMSC culture. Hydrogels were fabricated in each of the eight combinations of the low- and high-parameter values and cells were seeded at a density of 10 million cells per milliliter. (B and F) Venn diagrams of DE genes in mMSCs for each material parameter comparison after controlling for other parameters. The numbers of DE genes shared by two parameters are indicated in the overlap in circles. (C and G) Number of DE genes in mMSCs for all pairwise material comparisons. Circle area corresponds to the number of DE genes as indicated in the legend. (D and H) Fraction of DE genes from C and G described by decoupled genes in B and F for all pairwise material comparisons in mMSCs. Green, DE genes not found in the sets from B and F; blue, DE genes from ligand density set from B and F; red, DE genes from stress relaxation set from B and F; purple, DE genes from stiffness set from B and F; yellow, DE genes from overlapping ligand density and stress relaxation set from B and F; brown, DE genes from overlapping stiffness and stress relaxation set from B and F; pink, DE genes from overlapping ligand density and stiffness set from B and F; orange, DE genes from overlapping ligand density, stiffness, and stress relaxation set from B and F. The dashed box in D highlights a comparison in which comparing one material parameter (stress relaxation) results in a different pie chart if the background stiffness is different.
Fig. 2.
Fig. 2.
Transcriptomic comparison of material parameter sensing in hNPCs. (A) Schematic of experimental conditions for hNPC culture. Hydrogels were fabricated in each of the eight combinations of the low- and high-parameter values and seeded at a density of 5 million cells per milliliter. (B) Venn diagram of DE genes in hNPCs for each material parameter comparison after controlling for other parameters. The number of DE genes shared by two parameters are indicated in the overlap in circles. (C) Number of DE genes in hNPCs for all pairwise material comparisons. Circle area corresponds to the number of DE genes as indicated in the legend. (D) Fraction of DE genes from C described by decoupled genes in B (each Venn diagram slice) for all pairwise material comparisons in hNPCs. Green, DE genes not found in the sets from B; blue, DE genes from ligand density set from B; red, DE genes from stress relaxation set from B; purple, DE genes from stiffness set from B; yellow, DE genes from overlapping ligand density and stress relaxation set from B; brown, DE genes from overlapping stiffness and stress relaxation set from B; pink, DE genes from overlapping ligand density and stiffness set from B; orange, DE genes from overlapping ligand density, stiffness, and stress relaxation set from B.
Fig. 3.
Fig. 3.
WGCNA of material parameter sensing networks in mMSCs. (A) Cluster dendrogram of gene expression showing module identification from WGCNA using an unsigned network and a soft thresholding parameter of 10 for the dataset containing 18-kPa hydrogels as the stiffest condition. (B) Selection of modules that most closely map to ligand density, stiffness, and stress relaxation for the dataset containing 18-kPa hydrogels as the stiffest condition. Average module significance is plotted as a function of each material, showing the correspondence between the module and that parameter of interest. These modules are identified in SI Appendix, Fig. S13. (C) Putative gene network seeded using the top hub genes from each of the modules corresponding to ligand density, stiffness, and stress relaxation (turquoise, red-orange, dark red). Enriched subnetworks were inferred using Metacore software and the three most significantly enriched (highest z-score) subnetworks were chosen and merged to arrive at the network shown. Connections corresponding to the Wnt (teal), TGF-β (orange), VEGF (pink), NF-κB (brown), Jak/STAT (yellow), IGF (green), and MAPK (purple) pathways are highlighted. (D) Heatmap showing absolute value of spearman correlations between the turquoise, orange-red, and dark red modules and all other modules, calculated by correlating the average expression of each module’s member genes. Module member genes for select comparisons showing particularly high or low correlations to the turquoise, orange-red, and dark red modules were selected and the most significant Metacore PathwayMaps were identified using these genes as seeds. Blue corresponds to high correlations and white to low correlations.
Fig. 4.
Fig. 4.
mMSCs modulate secreted cytokines in response to substrate stiffness. (A) Heatmap representing results of cytokine antibody array performed on conditioned media from mMSCs cultured in hydrogels from days 2–3 of culture. Values were normalized to internal positive controls and the maximum signal for each cytokine across the four materials. Cytokines were hierarchically clustered using a Euclidean distance metric and complete linkage. (B) Schematic of MSC–HSPC coculture set-up. Fast-relaxing hydrogels were used for all experiments. Soft corresponded to 3 kPa and stiff corresponded to 18 kPa. (C) Viable cell number as counted by flow cytometry of cells seeded on Transwell membrane after 1 wk of coculture. Error bars represent SD (one-way ANOVA, Tukey post hoc test, *P < 0.05, **P < 0.01). (D) Number and percentage of CD45+/lin cells from Transwell membrane after 1 wk of coculture as analyzed by flow cytometry. Error bars represent SD (one-way ANOVA, Tukey post hoc test, *P < 0.05, **P < 0.01).
Fig. 5.
Fig. 5.
Model for gene-expression effects of substrate properties. (A) Model of the substrate response, where cells sense material inputs, process them, and translate them into changes in gene expression. Formulating a statistical model of gene expression as explained by substrate properties and their interaction is loosely analogous to the transfer function between the gene-expression output and the substrate property input. (B) Response surface for gene expression as a function of substrate properties. One of these surfaces exists for each gene. (C) Response surface for collapsed gene expression as a function of collapsed substrate properties. In this approach, the dimensionality of gene-expression space and the substrate property space are collapsed to enable a holistic view of the most prominent substrate effects.

Similar articles

Cited by

References

    1. Levental KR, et al. Matrix crosslinking forces tumor progression by enhancing integrin signaling. Cell. 2009;139:891–906. - PMC - PubMed
    1. Murphy WL, McDevitt TC, Engler AJ. Materials as stem cell regulators. Nat Mater. 2014;13:547–557. - PMC - PubMed
    1. Cukierman E, Pankov R, Stevens DR, Yamada KM. Taking cell-matrix adhesions to the third dimension. Science. 2001;294:1708–1712. - PubMed
    1. Balaban NQ, et al. Force and focal adhesion assembly: A close relationship studied using elastic micropatterned substrates. Nat Cell Biol. 2001;3:466–472. - PubMed
    1. Gardel ML, Schneider IC, Aratyn-Schaus Y, Waterman CM. Mechanical integration of actin and adhesion dynamics in cell migration. Annu Rev Cell Dev Biol. 2010;26:315–333. - PMC - PubMed

Publication types

MeSH terms

LinkOut - more resources