

SNARE-mediated membrane fusion arrests at pore expansion to regulate the volume of an organelle
- PMID: 30120144
- PMCID: PMC6166129
- DOI: 10.15252/embj.201899193
SNARE-mediated membrane fusion arrests at pore expansion to regulate the volume of an organelle
Abstract
Constitutive membrane fusion within eukaryotic cells is thought to be controlled at its initial steps, membrane tethering and SNARE complex assembly, and to rapidly proceed from there to full fusion. Although theory predicts that fusion pore expansion faces a major energy barrier and might hence be a rate-limiting and regulated step, corresponding states with non-expanding pores are difficult to assay and have remained elusive. Here, we show that vacuoles in living yeast are connected by a metastable, non-expanding, nanoscopic fusion pore. This is their default state, from which full fusion is regulated. Molecular dynamics simulations suggest that SNAREs and the SM protein-containing HOPS complex stabilize this pore against re-closure. Expansion of the nanoscopic pore to full fusion can thus be triggered by osmotic pressure gradients, providing a simple mechanism to rapidly adapt organelle volume to increases in its content. Metastable, nanoscopic fusion pores are then not only a transient intermediate but can be a long-lived, physiologically relevant and regulated state of SNARE-dependent membrane fusion.
Keywords: SNAREs; endosomes; lysosomes; membrane fusion; vacuoles.
© 2018 The Authors.
Figures
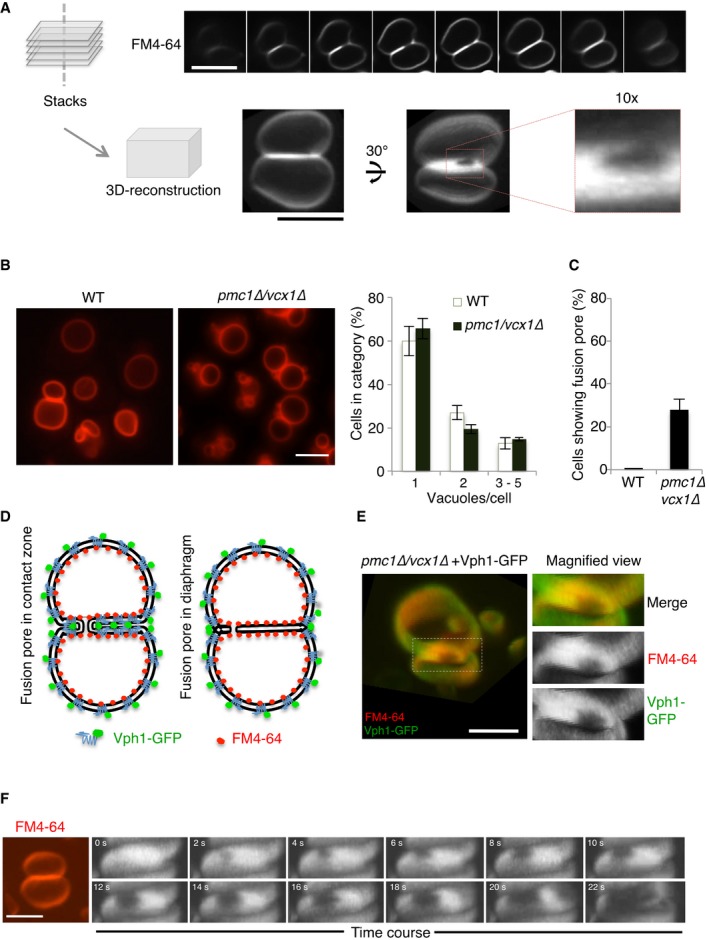
z‐stacks were acquired from FM4‐64‐labeled vacuoles in wild‐type cells (BJ3505), using a spinning disk microscope (step size 200 nm). 3D reconstructions from these stacks reveal a peripherally located fusion pore. Scale bar: 2 μm.
Wild‐type (BJ3505) and isogenic pmc1Δ/vcx1Δ mutant cells were labeled with FM4‐64. The number of vacuoles per cell was determined in three independent experiments evaluating 200 cells each. Scale bar: 2 μm.
Frequency of visible fusion pores. Cells were grown as in (B). The percentage of cells showing visible fusion pore was determined from z‐stacks. Means and SD are shown for 100 stained vacuoles from three independent experiments.
Schematic view of Vph1‐GFP and FM4‐64 distribution over the vacuolar membranes in the presence of a nanoscopic fusion pore or of an extended hemifusion diaphragm.
Distribution of Vph1‐GFP and FM4‐64 in vacuole–vacuole contact sites. Vph1‐GFP‐expressing cells, labeled with FM4‐64, were analyzed under a spinning disk confocal microscope equipped with two cameras for the simultaneous acquisition of GFP and FM4‐64 fluorescence signals. Separate channels are shown on the right. The entire contact surface, but not the pore, is accessible to both probes. Scale bar: 2 μm.
Expansion of a vacuolar fusion pore in real time. pmc1Δ/vcx1Δ cells were labeled with FM4‐64 and immobilized in a 50‐μl flow chamber (Ibidi). The osmotic value of the medium was changed by perfusion with water, using a pump with a flow of 30 μl/s. A frame was acquired every 2 s for a total period of the 30 s, using the laser at minimal intensity.
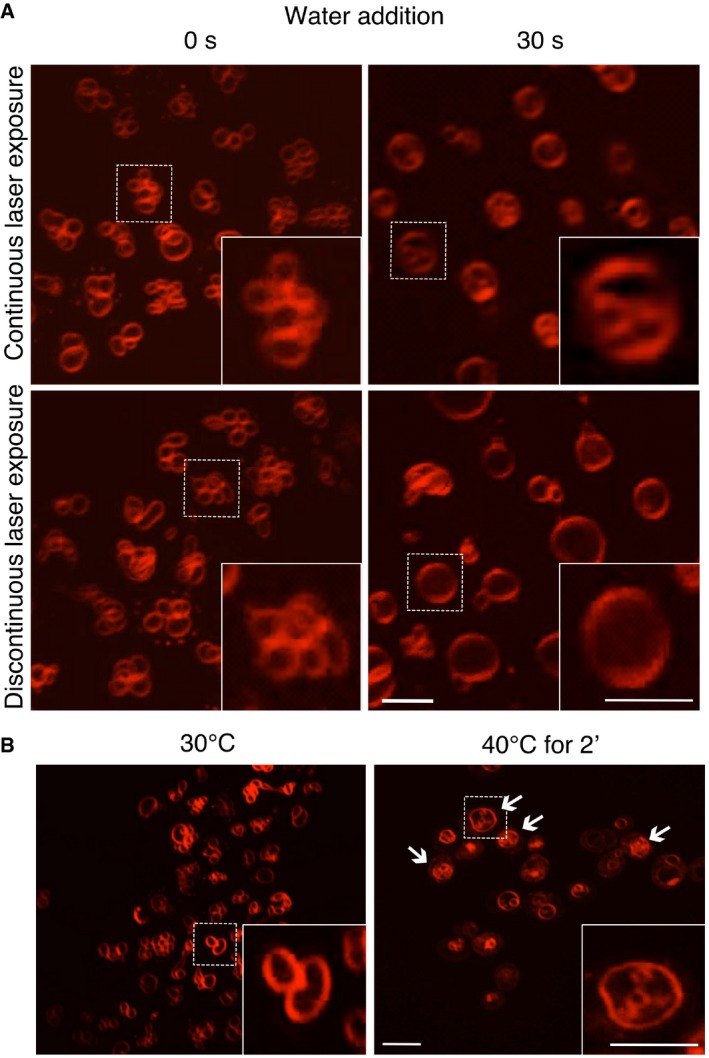
Effect of excessive excitation light. Vacuole fusion was stimulated in BY4741 cells, labeled with FM4‐64, by adding water. Pictures were acquired either under continuous laser excitation for 30 s, or with only a single laser flash before and 30 s after water addition.
Effect of elevated temperature. BY4741 cells were labeled with FM4‐64, and vacuole morphology was analyzed by spinning disk confocal microscopy before and after exposure to 40°C for 2 min. Arrows indicate vacuoles with lumenal vesicles.
- A
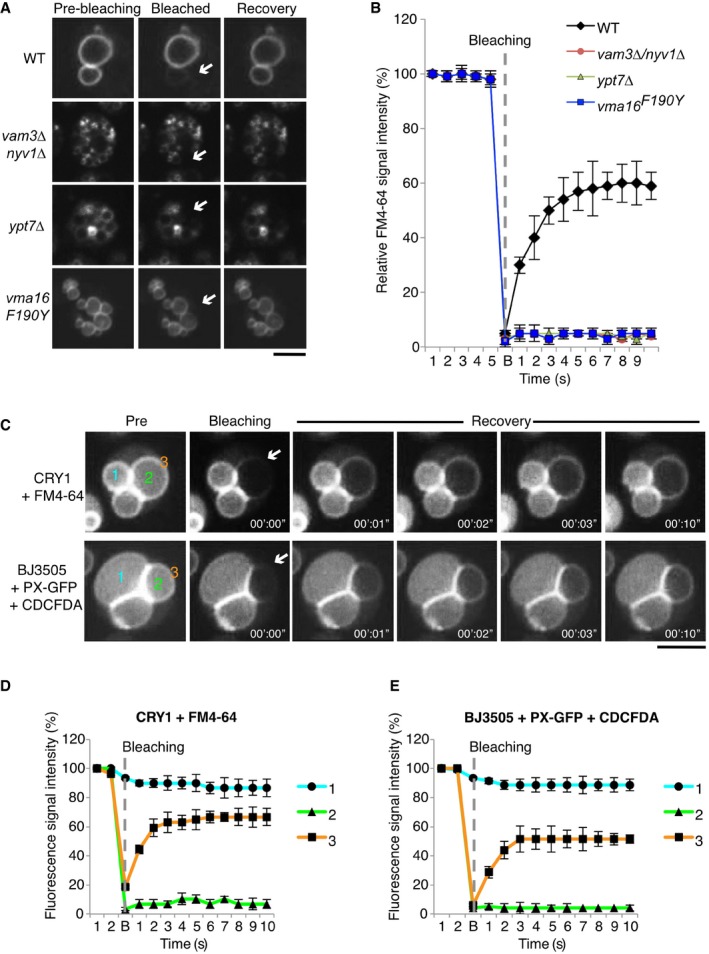
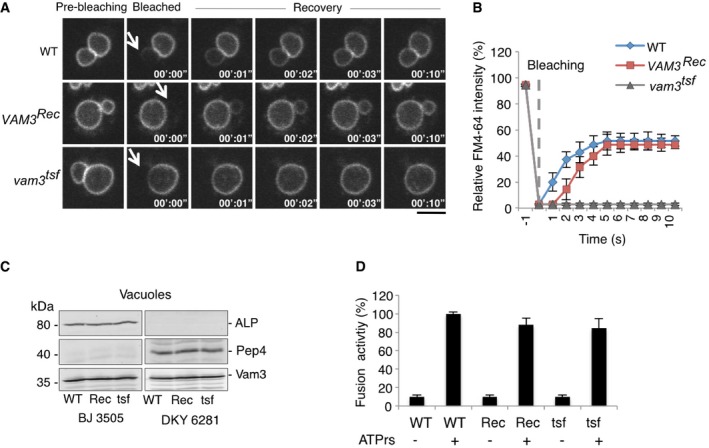
Vacuolar membranes of wild‐type (BY4741), nyv1Δ vam3Δ, ypt7Δ, or vma16 F190Y cells were labeled with the vital dye FM4‐64. A vacuole that was in a sufficiently peripheral location to be selectively photobleached was exposed to a laser pulse (white arrows indicate the bleaching area). Recovery of fluorescence in this area was assayed 10 s later by spinning disk confocal microscopy. Scale bar: 2 μm.
- B
Kinetics of FM4‐64 recovery in (A). Means and SD are shown for 20 vacuole clusters from three independent experiments.
- C
In vivo lipid and content mixing. Vacuoles in living yeast were labeled with the indicated lumenal (CDCFDA) and membrane (FM4‐64 or PX‐GFP) probes. Note that CRY1 cells lack the ADE2 gene and hence naturally accumulate 5‐amino‐1‐(5‐phospho‐D‐ribosyl)imidazole as fluorescent fluid phase marker in the vacuolar lumen. FRAP experiments were performed as in (A) (arrows indicate the bleaching area). (i) Non‐bleached lumenal area. (ii) Bleached lumenal area. (iii) Bleached membrane area. Scale bar: 2 μm.
- D, E
Kinetics of fluorescence recovery after photobleaching of the probes in (C). Numbers denote the areas shown in (C): (i) Non‐bleached lumenal area. (ii) Bleached lumenal area. (iii) Bleached membrane area. Means and SD are shown for 20 vacuole clusters from three independent experiments.
- A–E
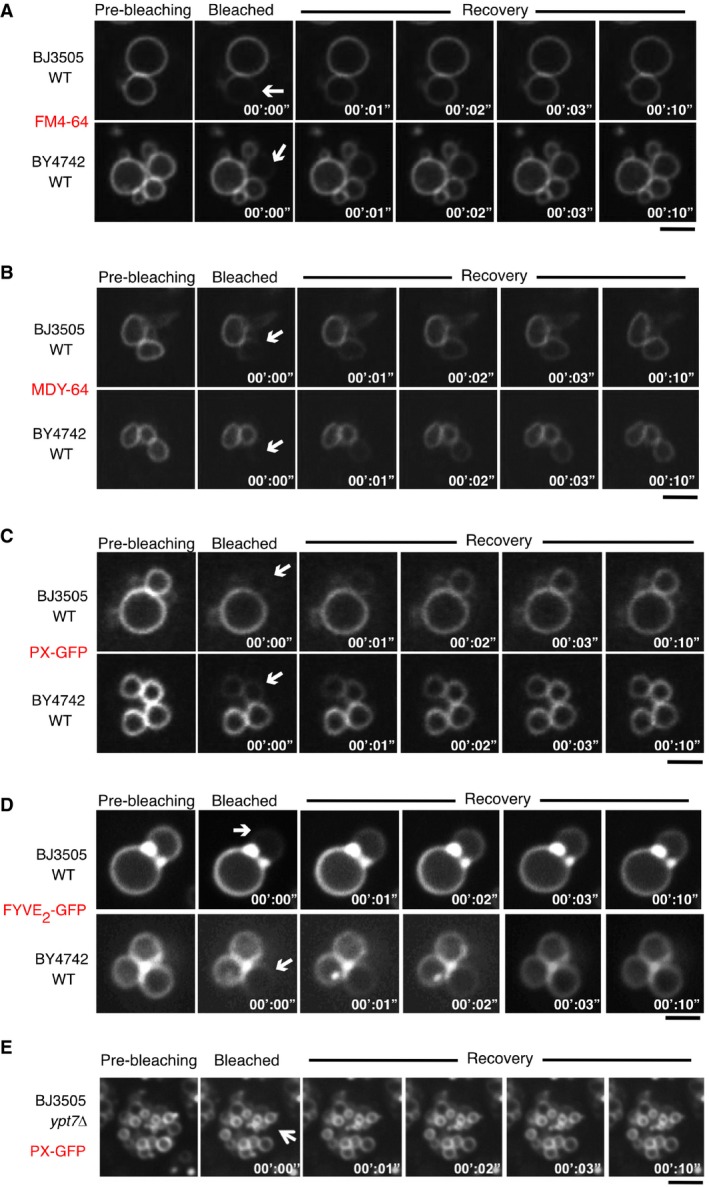
Wild‐type cells from two different backgrounds (BJ3505 and BY4741) were labeled with (A) FM4‐64 or (B) MDY‐64, or transformed with expression plasmids for (C) PX‐GFP or (D) FYVE2‐GFP in order to decorate the outer leaflet of the vacuolar membranes. The cells were subjected to FRAP assays as described in Fig 2. White arrows indicate the area of bleaching. (E) Same experiment as in (C), but using BJ ypt7Δ to illustrate that the transfer of PX‐GFP is impaired in fusion‐deficient mutants. Scale bars: 2 μm.
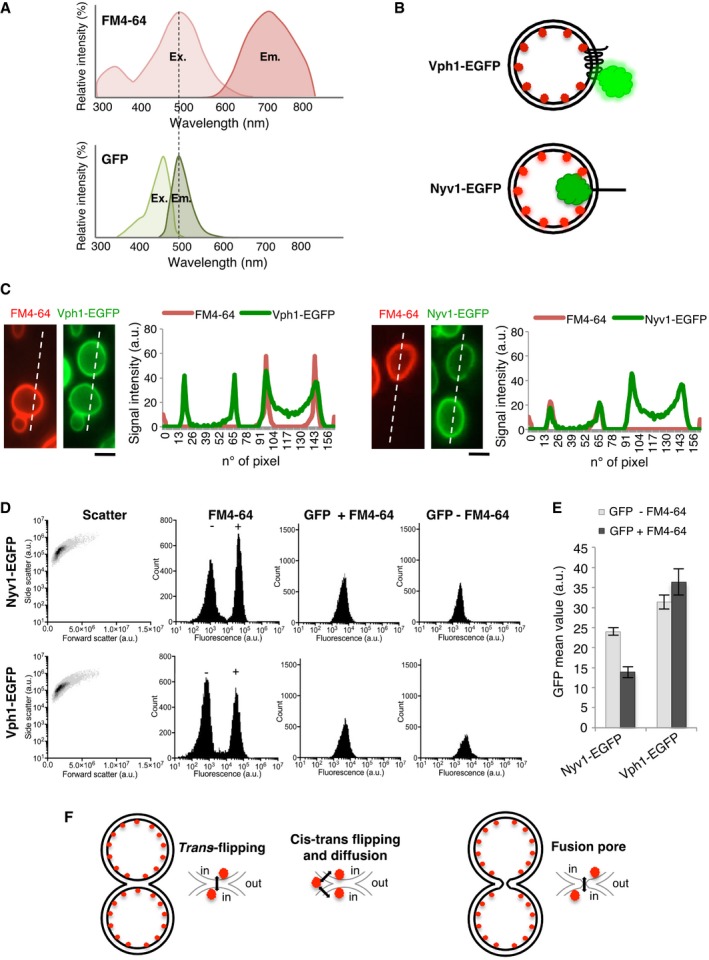
FM4‐64 and GFP excitation/emission spectra.
FRET‐based in vivo strategy to distinguish localization of FM4‐64 in the inner or outer leaflets of vacuolar membranes. EGFP tags were added to the cytosolic C‐terminus of Vph1 or to the lumenal C‐terminus of Nyv1.
Assay by microscopy. Half of two cultures of cells expressing Vph1‐EGFP or Nyv1‐EGFP were labeled with FM4‐64, washed, and mixed with the other, non‐labeled half of the same culture. Cells were analyzed by spinning disk confocal microscopy. The intensities of GFP fluorescence were tracked along the dashed lines and compared between neighboring FM4‐64‐labeled and unlabeled cells.
FACS analysis. The strains from (C) were labeled as described, washed, and analyzed by FACS. Shown are side (SSC‐A) and forward scatter (FSC‐A), as well as the fluorescence intensity distributions for FM4‐64 and for GFP in the absence or presence of FM4‐64.
Comparison of the GFP mean fluorescence from FM4‐64‐stained cells and unstained cells (20,000 each).
Possibilities for FM4‐64 transfer between the inner leaflets of two tethered vacuoles. Flipping between the trans‐leaflets of a hemifusion structure; reversible flipping into the outer leaflet, establishing a minor pool that then transfers through the buffer or through the outer leaflet; or passage through a fusion pore.
- A
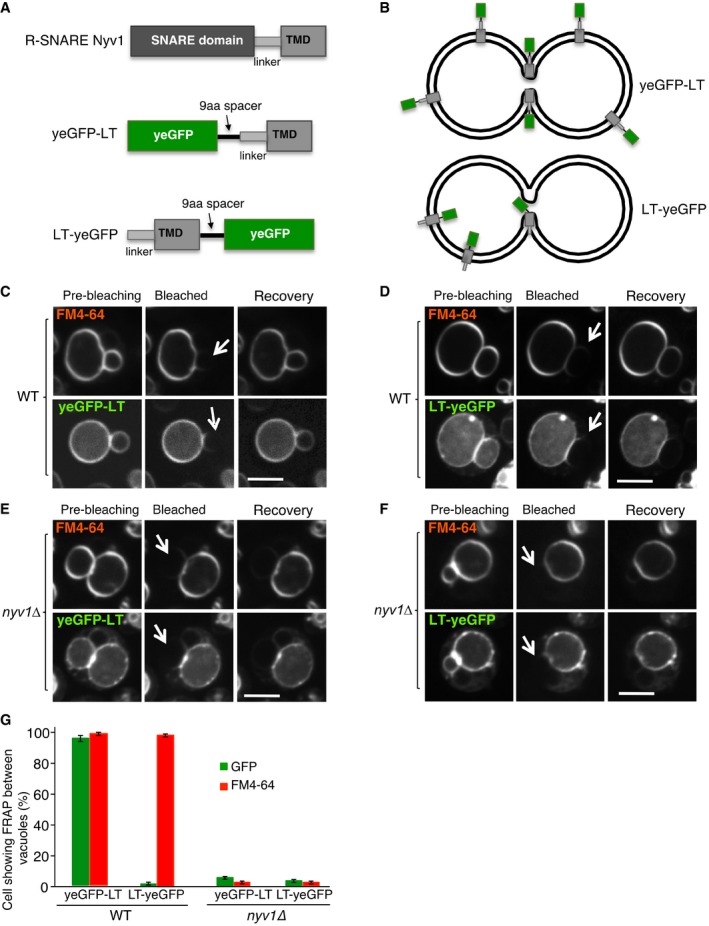
Synthetic reporter proteins carrying EGFP either at the lumenal or cytosolic end of the single‐spanning transmembrane domain of Nyv1, which carries no hydrophilic extensions at its lumenal C‐terminus.
- B
The topology of these constructs in the vacuolar membrane is indicated.
- C, D
FRAP assays for fusion pores. The indicated cells expressing (C) yeGFP‐LT or (D) LT‐yeGFP were labeled with FM4‐64 and subjected to FRAP experiments as in Fig 2. Cells were imaged before and 0 (bleached) or 30 s after photobleaching (recovery). The bleached areas are indicated by an arrow.
- E, F
FRAP assays for fusion pores were performed as in (C, D), but with nyv1Δ cells. Scale bar: 2 μm.
- G
The histogram reports the fraction of cells showing FRAP. Means and SD are shown from three independent experiments, with 100 cells analyzed in each.
- A–C
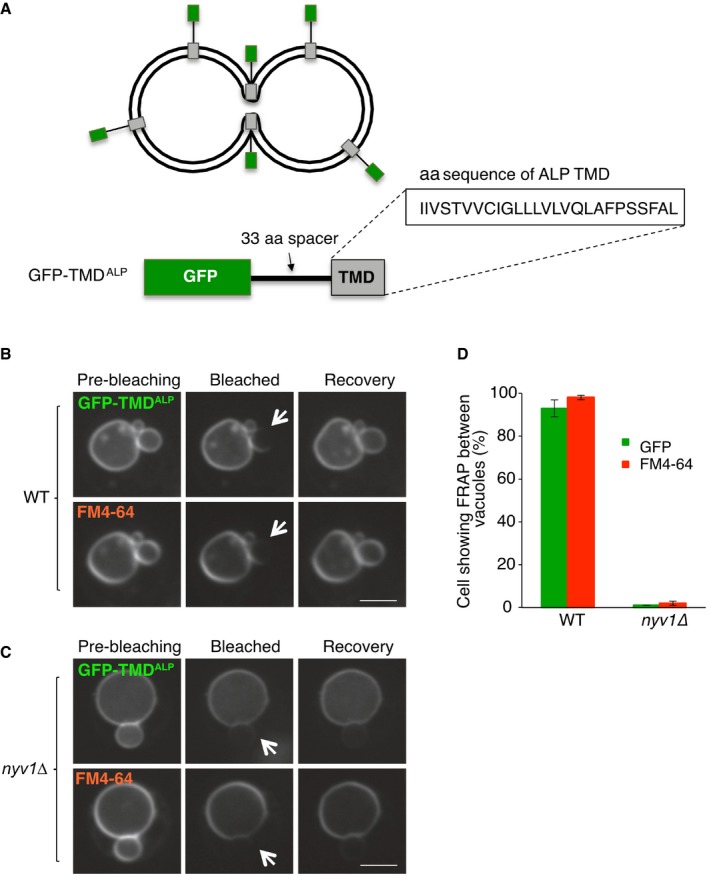
The synthetic reporter protein GFP‐TMDALP was created (A), which carries GFP at the cytosolic, N‐terminal end of the single‐spanning transmembrane domain of ALP, and expressed in (B) wild‐type or (C) isogenic BJ nyv1Δ cells. Cells were labeled with FM4‐64 and subjected to FRAP experiments as in Fig 4. Cells were imaged before and 0 or 30 s after photobleaching. The bleached area is indicated by an arrow. Scale bar: 2 μm.
- D
The histogram reports the fraction of cells showing FRAP. Means and SD are shown for three independent experiments with 100 cells analyzed for each.

- A
The synthetic reporter protein yeGFP‐LT (used in Fig 4A) was extended at its C‐terminal, lumenal end by adding the peptide sequences marked in blue.
- B–E
FRAP assays for fusion pores. Cells expressing (B) yeGFP‐LT, (C) yeGFP‐LT+S, (D) yeGFP‐LT+SK, or (E) yeGFP‐LT+SKADSA were labeled with FM4‐64 and subjected to FRAP experiments as in Fig 4. Cells were imaged before and 0 or 30 s after photobleaching. The bleached area is indicated by an arrow. Scale bar: 2 μm.
- F
The histogram reports the fraction of cells showing FRAP. Means and SD are shown for three independent experiments with 100 cells analyzed for each.
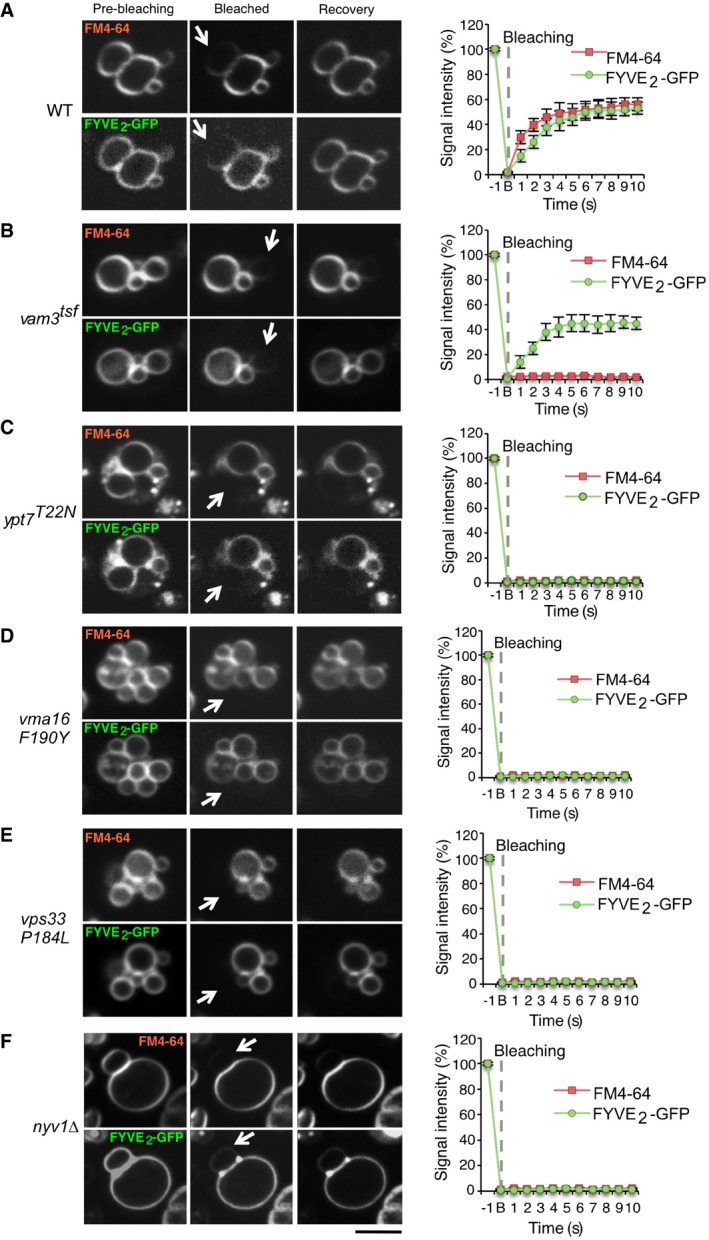
- A–F
The indicated yeast strains were transformed with expression plasmids for FYVE2‐GFP, and their vacuolar membranes were labeled with FM4‐64. FRAP was performed as in Fig 2, using a spinning disk microscope equipped with an emission beam splitter and two synchronized cameras, allowing to simultaneously analyze FM4‐64 and GFP fluorescence. The histograms show the kinetics of signal recovery for (A) wild‐type (WT), (B) vam3 tsf, (C) ypt7 T22N, (D) vma16 F190Y, (E) vps33 P184L, and (F) nyv1Δ cells. Scale bar: 2 μm. Arrows indicate the bleaching area. Means and SD are shown for 20 stained vacuoles from three independent experiments.
The indicated cells were labeled with FM4‐64 and analyzed by FRAP as in Fig 2. Dashed white circles indicate the area of bleaching. White arrows indicate the bleached area. Scale bar: 2 μm.
Kinetics of FM4‐64 recovery, recorded from experiments as in (A). Means and SD are shown from three experiments with 20 stained vacuoles each.
Vacuoles purified from the indicated strains were analyzed by SDS–PAGE and Western blotting against the reporter proteins for the content mixing assay, the vacuolar alkaline phosphatase Pho8 and the protease Pep4, as well as Vam3.
Vacuoles were prepared from the indicated strains as in (C) and used for in vitro fusion assay in the absence or presence of ATP. Fusion activity was measured through the activation of Pho8 by Pep4. Means and SD are shown for three independent experiments.
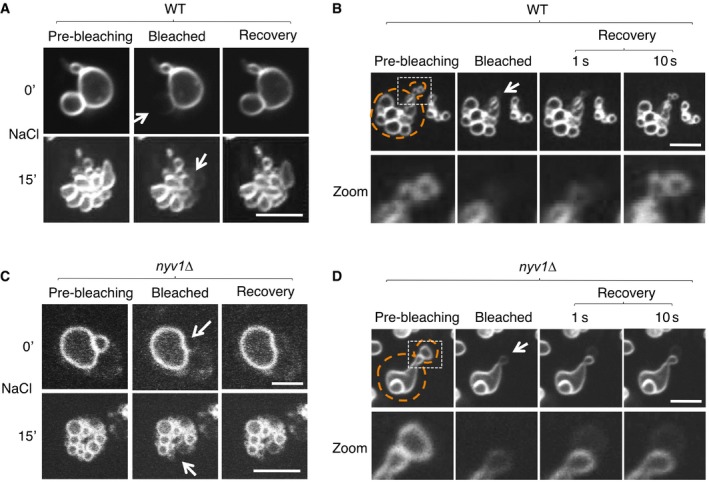
- A–D
Wild‐type (A, B) or nyv1Δ cells (C,D), which lack the vacuolar R‐SNARE Nyv1, were labeled with FM4‐64. Cells were immobilized on a chambered slide and subjected to FRAP experiments as in Fig 2A. (C) Vacuole fission induced by hypertonic shift. FRAP experiments were performed before (0′) or 15 min after addition of NaCl to 0.5 M. The fluorescence images show the vacuoles inside a single cell. (B, D) Cells in S‐phase were selected, which grow a daughter cell and therefore fission their vacuoles into a chain of tubulo‐vesicular structures, part of which are transported into the daughter cell. FRAP experiment on vesicles in the inheritance structure was performed. Arrows indicate the bleaching area, and dashed orange lines the cell cortex. Scale bar: 2 μm.
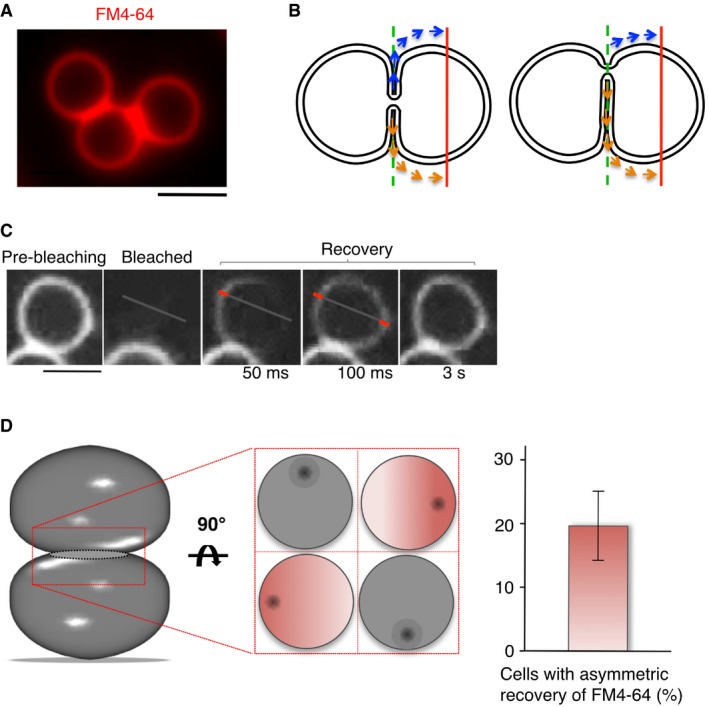
Wild‐type (BY4741) cells labeled with FM4‐64 show extensive contact zones between vacuoles. Scale bar: 2 μm.
Schematic view of FM4‐64 diffusion through a small fusion pore located centrally (left panel) or laterally (right panel). The laterally positioned fusion pore leads to diffusion paths of unequal length for fluorescence recovery on both sides of the bleached vacuole. The red line indicates the intersections with the membrane where fluorescence recovery is measured.
FRAP analysis of FM4‐64‐labeled wild‐type cells was performed by acquiring pictures in continuous acquisition mode after bleaching, for a total period of 5 s. Three representative frames after photobleaching are shown. The bars in the magnified parts of frames 2 and 3 illustrate the positions at which the recovery of FM4‐64 fluorescence was quantified. Scale bar: 2 μm.
Quantification of recovery experiments in (C). A delay of > 50 ms between the appearance of the signal on both sides of the photobleached vacuole was considered as asymmetric recovery. The histogram shows means and SD from three independent experiments evaluating 50 stained vacuoles each. A Schematic view of the various possible positions of a fusion pore and its consequences for our ability to detect asymmetric FM4‐64 recovery. The contact zone between the two vacuoles is tilted by 90° in the middle panel, which gives four examples for the positioning of the pore (shown as a black dot). Asymmetric recovery could only be detected if the pore is sufficiently far from the center of the contact zone and close to the optical plane that is imaged (the cases marked in red).
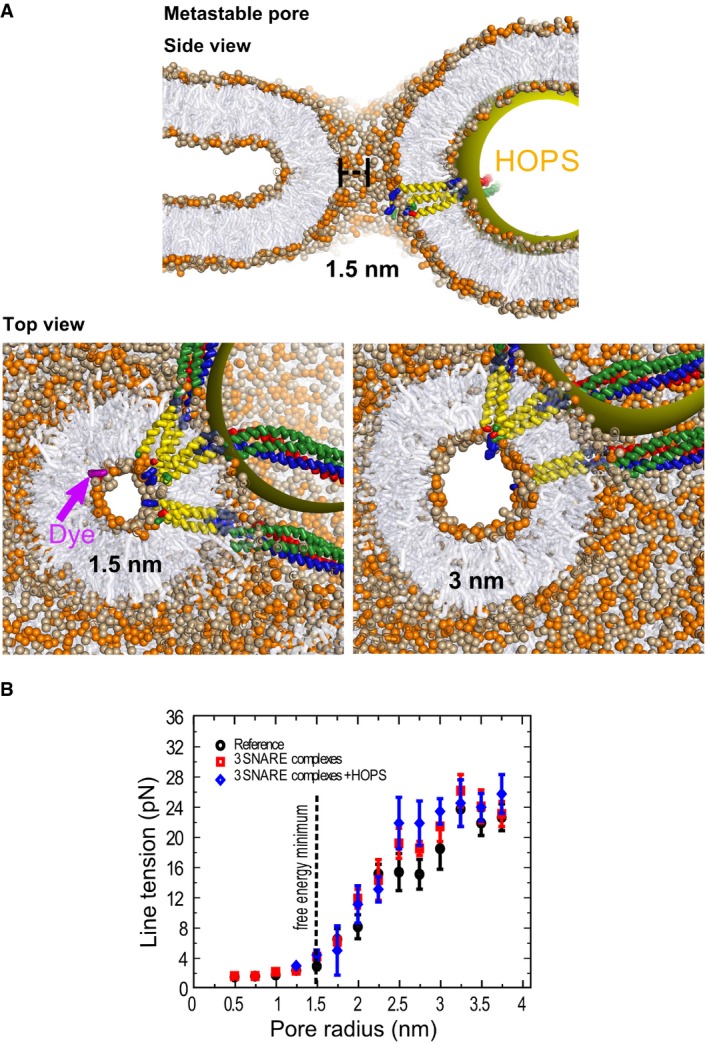
A tension‐less protein‐lined metastable fusion pore formed between two mixed (3:2, PC:PE) model membranes (POPC head groups colored light brown, POPE head groups colored orange). The radius of the pore is 1.5 nm. The yellow sphere mimics a steric perturbation on the fusion site imposed by HOPS binding to one of the SNARE complexes. The upper panel shows a cross‐section of this pore in side view. The lower panels show side views of cross‐sections through this 1.5 nm pore, which is at the free energy minimum, as well as of a 3 nm pore, which is at the threshold where the line tension converges to a constant value (see B). Notice that the cross‐sectional shape of the pore (shown in top views) remains largely spherical despite the heterogeneity of the fusion site. The top view show also a fluorescent dye molecule (dichlorofluorescein, MW = 401 Da, in purple) to illustrate its scale relative to the 1.5 nm pore.
Line tension of the fusion pore in pN as function of pore radius and the fusion proteins inserted into it. The black dotted line represents the position of the local minimum. The initial expansion is relatively insensitive to the presence of fusion proteins. Each data point represents the average line tension measured over an ˜600‐ns equilibrium simulation. Error bars are based on block averaging over the obtained data set (the autocorrelation time is ˜30 ns).
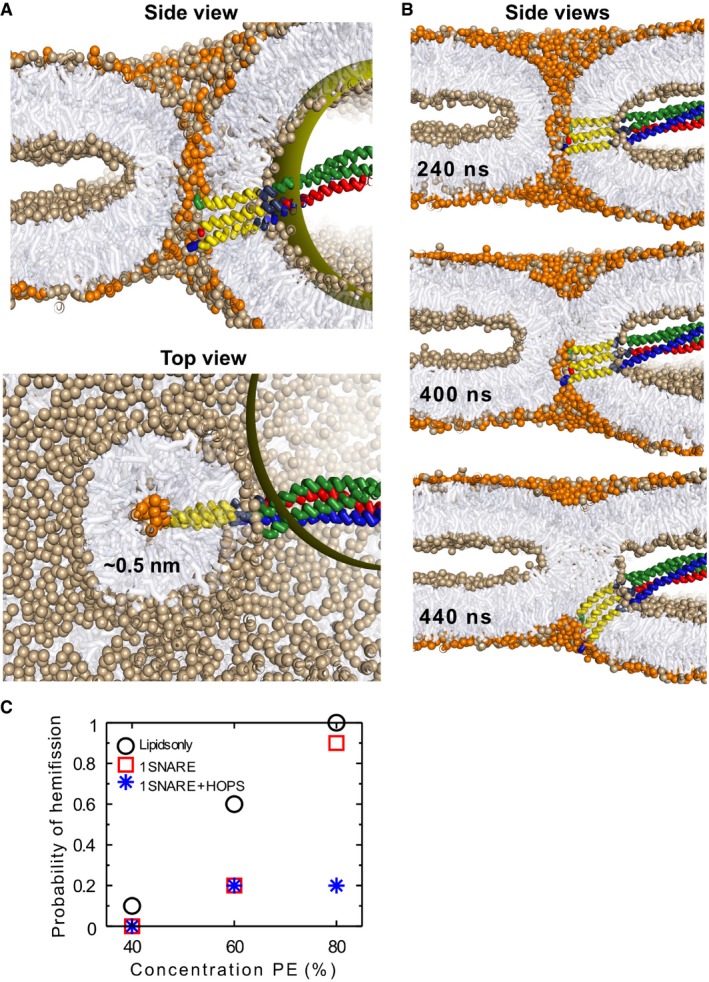
Asymmetry in lateral leaflet composition and population enforces a fusion pore with a radius of 0.5 nm (POPC head groups colored light brown, POPE colored orange). The panels show cross‐sections, viewed from the side (left) or from the top (right).
Hemifission event in the presence of a single SNARE complex and in the absence of HOPS. Notice that the SNARE complex is actively expelled from the interior of the pore and bent.
The graph shows the probability of hemifission after 2 μs for 9 scenarios differing in lipid and protein content of the pore (10 simulations for each scenario). We only vary the concentration of PE‐lipids in the trans‐leaflets and the presence of fusion constituents (lipids only: black circles, 1 SNARE complex: red squares, 1 SNARE complex + HOPS: blue stars). The trans‐leaflets are always comprised of 5% less lipids than the cis‐leaflets. The presence of SNARE complexes and/or HOPS reduces the frequency of hemifission with respect to a system consisting of lipids only.
Comment in
-
Uncovering the "secret" lives of vacuolar fusion pores in living cells.EMBO J. 2018 Oct 1;37(19):e100656. doi: 10.15252/embj.2018100656. Epub 2018 Sep 20. EMBO J. 2018. PMID: 30237311 Free PMC article.
References
Publication types
MeSH terms
Substances
LinkOut - more resources
Full Text Sources
Other Literature Sources
Molecular Biology Databases
