. 2018 Sep;30(9):2057-2081.
doi: 10.1105/tpc.18.00356. Epub 2018 Aug 17.

Glucose Uptake via STP Transporters Inhibits in Vitro Pollen Tube Growth in a HEXOKINASE1-Dependent Manner in Arabidopsis thaliana

Affiliations

Glucose Uptake via STP Transporters Inhibits in Vitro Pollen Tube Growth in a HEXOKINASE1-Dependent Manner in Arabidopsis thaliana

Theresa Rottmann et al. Plant Cell. 2018 Sep.

Abstract

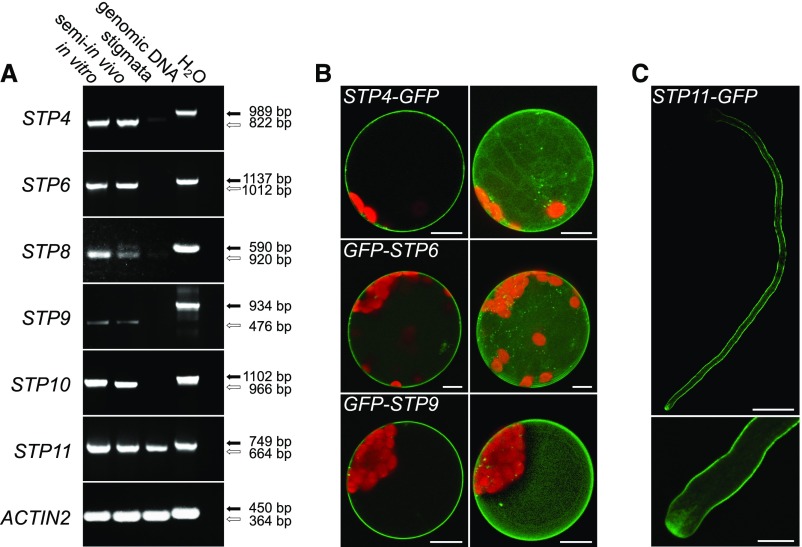
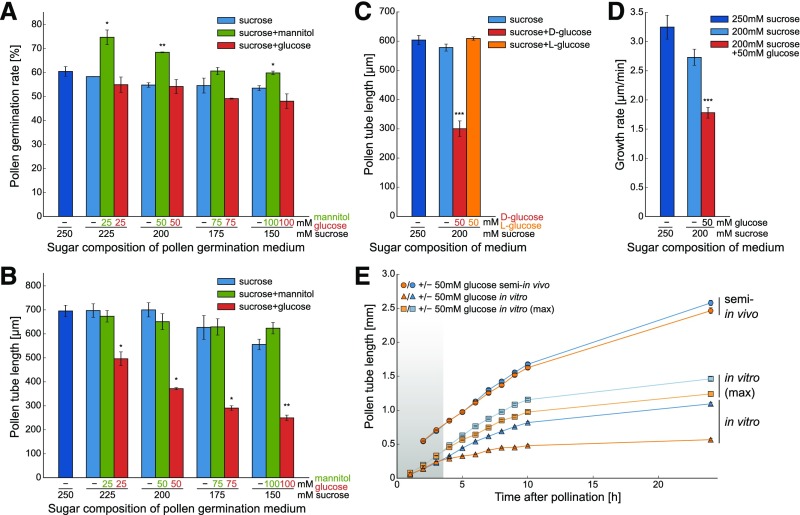
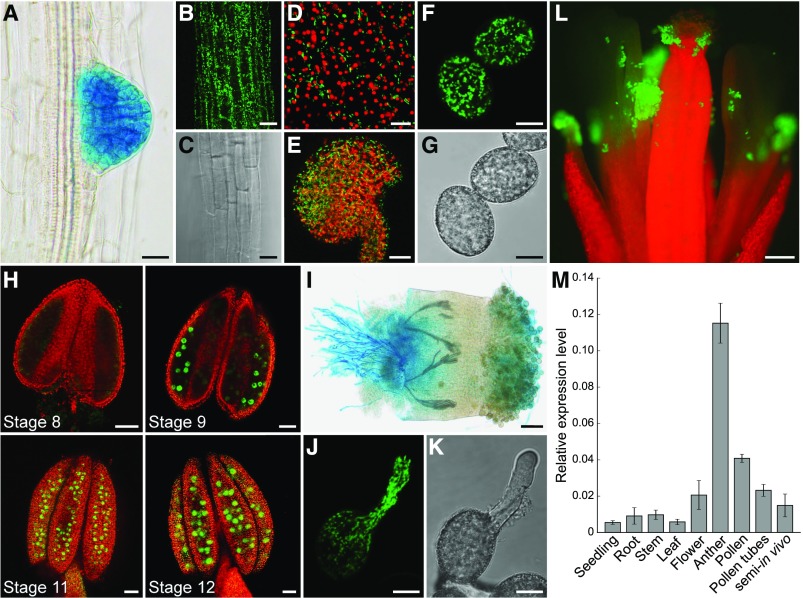
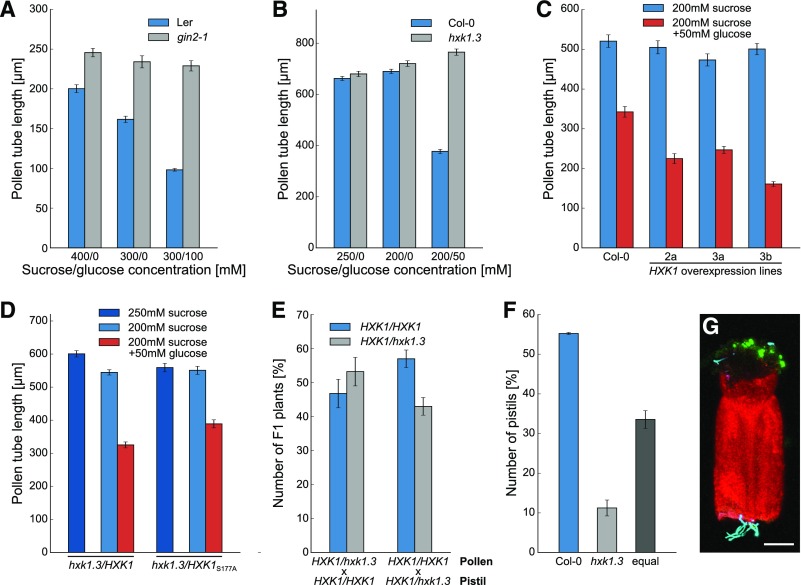
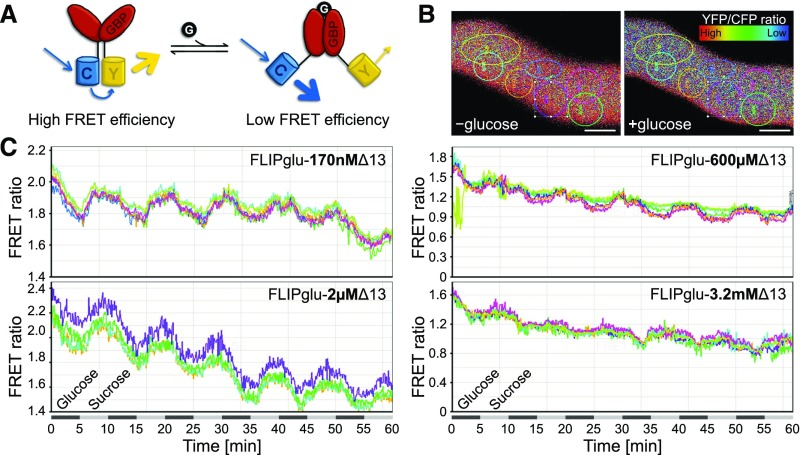
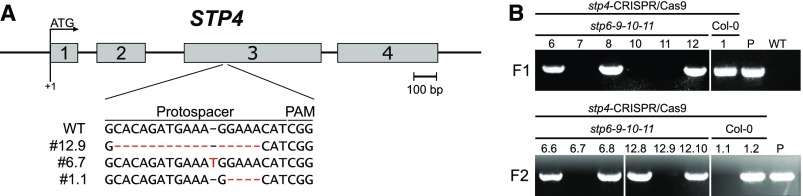
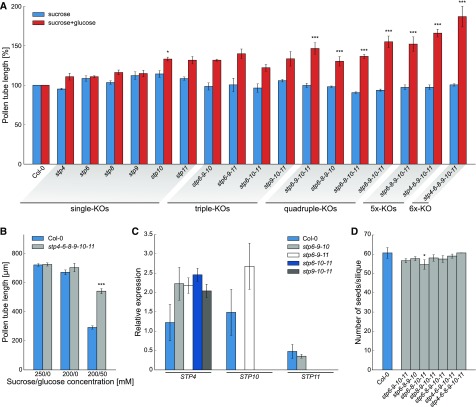
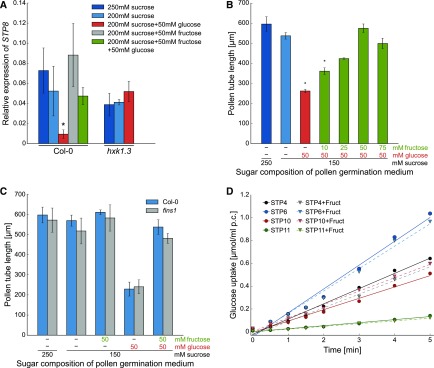
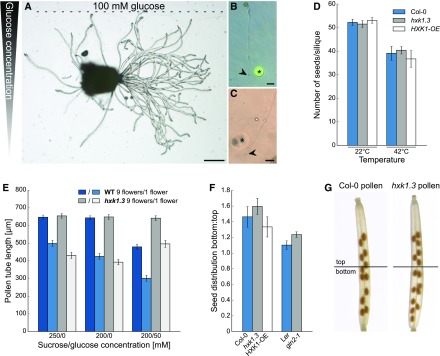
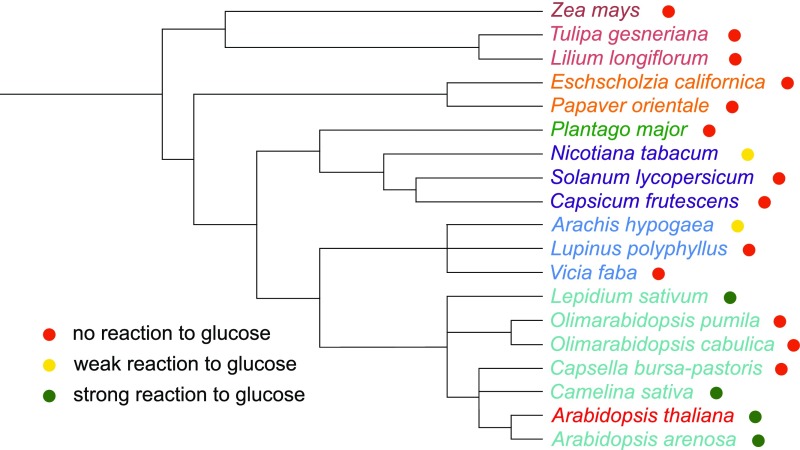
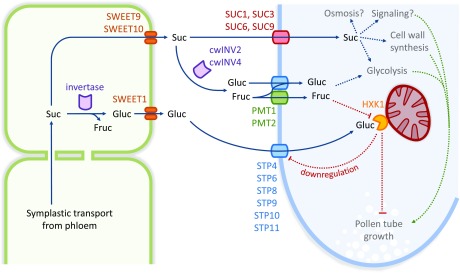
Pollen tube growth requires a high amount of metabolic energy and precise targeting toward the ovules. Sugars, especially glucose, can serve as nutrients and as signaling molecules. Unexpectedly, in vitro assays revealed an inhibitory effect of glucose on pollen tube elongation, contradicting the hypothesis that monosaccharide uptake is a source of nutrition for growing pollen tubes. Measurements with Förster resonance energy transfer-based nanosensors revealed that glucose is taken up into pollen tubes and that the intracellular concentration is in the low micromolar range. Pollen tubes of stp4-6-8-9-10-11 sextuple knockout plants generated by crossings and CRISPR/Cas9 showed only a weak response to glucose, indicating that glucose uptake into pollen tubes is mediated mainly by these six monosaccharide transporters of the SUGAR TRANSPORT PROTEIN (STP) family. Analyses of HEXOKINASE1 (HXK1) showed a strong expression of this gene in pollen. Together with the glucose insensitivity and altered semi-in vivo growth rate of pollen tubes from hxk1 knockout lines, this strongly suggests that glucose is an important signaling molecule for pollen tubes, is taken up by STPs, and detected by HXK1. Equimolar amounts of fructose abolish the inhibitory effect of glucose indicating that only an excess of glucose is interpreted as a signal. This provides a possible model for the discrimination of signaling and nutritional sugars.


Figures

Figure 1.
Figure 1.
Analyses of Pollen Tube-Specific Expression of Different STPs and of the Subcellular Localization of the Encoded Proteins. (A) RT-PCR-based comparison of STP4, STP6, STP8, STP9, STP10, and STP11 expression in in vitro-germinated pollen tubes, in pollen tubes grown through a stigma (semi-in vivo), and in virgin stigmata with gene-specific primers (Supplemental Table 3). Arrows indicate the predicted sizes of PCR products derived from genomic DNA (black) and reverse-transcribed mRNA (white). The presence of RNA in each sample was confirmed with ACTIN2 specific primers (Supplemental Table 3). (B) Single optical sections (left) and maximum projections (right) of mesophyll protoplasts expressing GFP fusion constructs of STPs under the control of the 35S promoter. GFP is given in green and chlorophyll autofluorescence in red. (C) Confocal optical section of a tobacco pollen tube transiently expressing STP11-GFP under the control of LAT52pro after particle bombardment. The bottom image shows the pollen tube tip at higher magnification. Bars = 10 µm in (B) and (C) (bottom) and 50 µm in (C) (top).
Figure 2.
Figure 2.
Influence of Glucose on Germination and Tube Growth of Col-0 Pollen. (A) In vitro pollen germination rate after 7 h on media with sucrose or sucrose plus different glucose concentrations. Addition of mannitol served as an osmotic control. Bars represent means of three independent experiments ± se (n ≥ 1500 in total for every sugar concentration). For this and the following pollen tube growth experiments, “independent experiments” indicates that they were performed on different days with pollen from different plants. (B) Lengths of pollen tubes germinated in vitro for 7 h on media with different sugar concentrations. Mean values ± se of three biological replicates are shown (n ≥ 600 in total for every sugar concentration). (C) Lengths of pollen tubes grown in vitro for 7 h on medium supplemented with 50 mM d- or l-glucose. Mean lengths ±se of five biological replicates (n ≥ 750 in total for every sugar concentration). (D) Mean growth rate of pollen tubes growing in vitro. Data were obtained by tracking the tip growth of individual pollen tubes in time series taken at intervals of 4 s during hour 1 to hour 3 after spreading pollen on the media (n = 10 for every sugar concentration). (E) Comparison of growth rates of pollen tubes germinated in vitro or semi-in vivo on 200 mM sucrose medium with or without additional glucose. Pollen tube lengths were determined every hour. In semi-in vivo experiments only the longest pollen tube of every stigma was measured because it was not possible to measure all lengths due to high pollen tube density (Supplemental Figure 1B). For a better comparability of semi-in vivo and in vitro lengths, the “in vitro (max)” curve is shown, which represents in vitro pollen tube length, when only the longest 10% of pollen tubes were used for the calculation of the mean value at every time point. The shaded area indicates the time during which no influence of glucose on pollen tube growth can be observed under in vitro conditions. Curves show mean values of three independent replicates ± se [n ≥ 60 pollen tubes for semi-in vivo and in vitro (max) experiments, n ≥ 600 for in vitro pollen tubes]. *P ≤ 0.05, **P ≤ 0.01, and ***P ≤ 0.001 by Student’s t test.
Figure 3.
Figure 3.
Analyses of HXK1 Expression in Different Tissues by Reporter Plant Studies and RT-qPCR. (A) and (I) Histochemical detection of GUS activity in Arabidopsis Col-0 expressing an HXK1pro:HXK1g-GUS construct. (B) to (H) and (J) to (L) Detection of GFP fluorescence (green) by confocal microscopy in HXK1pro:HXK1g-GFP reporter plants. Chlorophyll autofluorescence is given in red. (A) Root of an 8-d-old seedling with strong GUS staining in an emerging lateral root. (B) Root epidermis cells with HXK1-GFP. (C) Bright field of (B). (D) Epidermal cells of a sepal. (E) Maximum projection of an excised ovule. (F) Mature pollen grains with HXK1-GFP at the mitochondria. (G) Bright field of (F). (H) Anthers of different floral stages with HXK1-GFP in developing pollen grains. All flower stages 1 to 20 were named according to Smyth et al. (1990). (I) Pollen tubes grown semi-in vivo on a wild-type stigma. (J) In vitro growing pollen tube. (K) Bright field of (J). (L) Open pollinated flower. Bars = 20 µm in (A) to (C) and (E), 10 µm in (D), (F), (G), (J), and (K), 50 µm in (H) and (I), and 200 µm in (L). (M) Analysis of HXK1 transcript levels in different tissues. HXK1 transcripts were quantified by RT-qPCR using total RNA extracted from seedlings, roots, stems, leaves, pollinated flowers, young anthers, mature pollen, in vitro-germinated pollen tubes, and pollen tubes grown semi-in vivo through stigmata. The diagram depicts expression ratios relative to UBI10 expression in each tissue. Bars represent mean values ± se of three biological replicates with three technical replicates each. For each biological replicate, the tissue for RNA isolation was collected from a different Col-0 plant.
Figure 4.
Figure 4.
Characterization of the Glucose-Insensitive Mutants gin2-1 and hxk1.3 Regarding Pollen Tube Growth. (A) Mean lengths ± se of gin2-1 and wild-type (Ler) pollen tubes grown in vitro for 7 h on media with or without glucose (n ≥ 200 for every genotype on every sugar concentration). (B) Lengths of hxk1.3 and wild-type (Col-0) pollen tubes grown in vitro for 7 h on media with or without glucose. Mean values of three independent experiments ± se are shown (n ≥ 600 in total for every mean value). Independent experiments were performed on different days with pollen from different plants. (C) In vitro pollen tube lengths of three independent HXK1 overexpression lines in comparison to wild-type (Col-0) on media with or without glucose (n ≥ 200 pollen tubes for each line). (D) Pollen tube lengths of hxk1.3 complementation lines on medium with or without glucose. Complementation lines were generated by transformation of homozygous hxk1.3 plants with LAT52pro:HXK1c or with LAT52pro:HXK1cS177A encoding a catalytically inactive form of HXK1. Bars represent means of three biological replicates ± se (n ≥ 370 for every mean value). (E) Genotypes regarding HXK1 in the F1 descendants of cross-pollination experiments with heterozygous hxk1.3/HXK1 pollen and pistils from Col-0 plants. Reciprocal crosses were performed with Col-0 pollen and heterozygous hxk1.3/HXK1 pistils. Bars represent mean values of the percentage of each genotype in the F1 generation of four independent crossings (four different plants were used for crossing; n ≥ 98 F1 seedlings in total). (F) Results of the “pollen-tube race” experiment. Col-0 pistils were pollinated with GFP-labeled hxk1.3 pollen and Col-0 pollen expressing TagRFP-T, cut in the middle, and placed horizontally on germination medium. The graph depicts which pollen tubes emerged first form the cut-surface. Mean values ± se of three independent replicates (pollen and pistils of different plants were used on three different days) with 70 stigmata in total. (G) Representative confocal image of a “pollen-tube race” experiment. GFP is given in green, TagRFP-T in cyan, and chlorophyll autofluorescence in red. Bar = 150 µm.
Figure 5.
Figure 5.
Uptake of Glucose into Pollen Tubes Detected with FRET-Based Glucose Nanosensors. (A) Scheme of FLIPglu nanosensor function. eCFP (C) and eYFP (Y) are linked via a glucose binding protein (GBP). The conformational change upon binding of glucose to the GBP increases the distance between the chromophores and FRET efficiency decreases. (B) Ratiometric images of the same pollen tube in the presence and absence of glucose. Colored circles represent ROIs used for FRET ratio calculation. Bar = 2.5 µm. (C) Response of pollen tubes from transformants expressing FLIPglu-170nΔ13, FLIPglu-2µΔ13, FLIPglu-600µΔ13, or FLIPglu-3.2mΔ13 to perfusion with 50 mM glucose. Sugar concentration in the medium was changed between 250 mM sucrose and 200 mM sucrose + 50 mM glucose in intervals of 5 min. Quantification of FRET ratio was performed using the Leica FRET Sensitized Emission Wizard application.
Figure 6.
Figure 6.
Generation of stp4 Knockout Lines by CRISPR/Cas9-Mediated Mutagenesis. (A) Genomic organization of STP4. Exon regions (gray bars) are numbered; introns and untranslated regions are shown as black lines. The positions of the protospacer sequence and the mutations identified in plants transformed with the CRISPR/Cas9 construct are indicated. The plant lines were named #x.y, with x representing the number of the plant selected in the F1 generation and y offspring plant chosen in the respective F2 generation. (B) Control PCRs performed during generation of stp4 knockout lines by CRISPR/Cas9. In the F1 generation after dipping of Col-0 or stp6-9-10-11 plants, the presence of Cas9 was confirmed by PCR with the primer pair listed in Supplemental Table 2. The image shows representative results for plants 6, 7, 8, 10, 11, and 12 in the stp6-9-10-11 background and plant 1 in the Col-0 background of 20 plants tested. The plasmid used for transformation was used as a positive control (P), and genomic DNA isolated from a wild-type plant (WT) served as negative control. Plants of the F2 generation that had lost Cas9 by segregation were identified by PCR with the same primers as used before and analyzed for changes in STP4 by sequencing. The plant lines were named #x.y, with x representing the number of the plant selected in the F1 generation and y offspring plant chosen in the respective F2 generation.
Figure 7.
Figure 7.
Analysis of Single and Multiple Knockout Lines of Pollen Tube-Expressed STPs. (A) Pollen tube lengths of stp single, triple, quadruple, quintuple, and sextuple knockouts. Pollen tubes were grown for 7 h in vitro on medium with 250 mM sucrose or 200 mM sucrose + 50 mM glucose. Bars represent mean values of three individual replicates ± se (n ≥ 420 pollen tubes for each mean value). For each biological replicate, flowers of different plants of the same genotype were used for pollen sampling. During each mutant pollen germination experiment, pollen of a wild-type plant cultivated under the same conditions was germinated in parallel. For better comparability of the different knockout lines, pollen tube lengths of mutants are given as relative values compared with the mean pollen tube length of the respective wild type on the same medium. Statistical analysis was performed prior to this normalization step. (B) Mean lengths ±se of stp4-6-8-9-10-11 sextuple knockout and wild-type (Col-0) pollen tubes grown in vitro for 7 h on medium with or without glucose (n ≥ 550 pollen tubes for every genotype on every sugar concentration in three independent replicates). (C) Analyses of STP4, STP10, and STP11 transcript levels in pollen tubes of Col-0 and different stp triple knockout lines. Transcripts were quantified by RT-qPCR with primers listed in Supplemental Table 5 using total RNA extracted from Col-0 or mutant pollen tubes grown in vitro for 7 h. The diagram depicts expression ratios relative to UBI10. Means of three biological replicates (with three technical replicates each) ± se are shown. For every biological replicate, pollen of four different flowers from individual plants was used for pollen germination and subsequent RNA isolation. (D) Average number of seeds/silique ± sd of multiple stp knockout plants and wild-type plants after self-pollination. n > 30 siliques/genotype. *P ≤ 0.05 and ***P ≤ 0.001 by Student’s t test.
Figure 8.
Figure 8.
Influence of Fructose on Expression of STP8, Pollen Tube Growth, and Glucose Uptake via STPs. (A) Analysis of STP8 transcript levels in Col-0 and hxk1.3 pollen tubes germinated in vitro on media with different sugars. STP8 transcripts were quantified by RT-qPCR using total RNA extracted from Col-0 or hxk1.3 pollen tubes grown in vitro for 6 h on media containing either 250 mM sucrose, 200 mM sucrose, or 200 mM sucrose supplemented with 50 mM of glucose, fructose, or glucose and fructose. The diagram depicts expression ratios relative to UBI10 expression under each growth condition. Bars represent mean values of three biological replicates with three technical replicates each. For every biological replicate, pollen of four different flowers from individual plants was used for pollen germination and subsequent RNA isolation. Error bars correspond to se. *P ≤ 0.05 by Student's t test. (B) Lengths of Col-0 pollen tubes on medium with sucrose only, sucrose with glucose, or sucrose with glucose and different concentrations of fructose. Lengths were measured 7 h after germination. Means of three biological replicates ± se are shown (n ≥ 570 pollen tubes in total for every medium composition). Biological replicates were produced by usage of pollen from different plants on different days. *P ≤ 0.05 by Student’s t test. (C) Mean lengths ± se of fins1 and Col-0 pollen tubes grown in vitro for 7 h on medium supplemented with glucose, fructose, or glucose and fructose (n ≥ 200 pollen tubes for every genotype on every sugar concentration). (D) Determination of 14C-glucose transport activity of STP4, STP9, STP10, and STP11 in the presence of nonradioactive fructose in 10-fold excess. Uptake of 14C-glucose into yeast cells expressing STP4, STP9, STP10, or STP11 was determined at an initial outside concentration of 20 µM at pH 5.5.
Figure 9.
Figure 9.
Analyses of SWEET1, SWEET9, and SWEET10 Expression in Pistils. (A) to (C) Histochemical detection of β-glucuronidase activity in flowers of Arabidopsis Col-0 expressing a SWEET1pro:SWEET1g-GUS fusion construct. (A) Pollinated stage-14 flower with strong GUS signals in the anthers and the stigma. (B) Stigma at higher magnification stained for a shorter time compared with (A) to better see the origin of GUS staining in the region of the style. (C) Cross section through the style of a GUS-stained pistil. (D) and (E) Detection of GUS activity in Col-0 plants transformed with a SWEET9pro:SWEET9g-GUS construct. (D) Flower with GUS staining in the stigma and the nectaries. (E) Stigma at higher magnification. (F) and (G) Histochemical detection of GUS activity in flowers of Arabidopsis Col-0 expressing a SWEET10pro:SWEET10g-GUS fusion construct. (F) Flower with GUS staining in the anthers and near the vascular tissue. (G) Upper part of the ovary at higher magnification. Bars = 500 µm in (A), (D), and (F), 100 µm in (B), (E), and (G), and 50 µm in (C).
Figure 10.
Figure 10.
Analyses of Hypotheses on the Physiological Functions of Glucose on Pollen Tube Growth. (A) to (C) Influence of glucose gradients on pollen tube growth direction. (A) Representative image of semi-in vivo growing pollen tubes challenged with a linear glucose gradient in the germination medium. The glucose gradient across the pollen germination medium was established by pipetting gelatin containing 100 mM glucose in a small band along one side of the pollen germination pad at the beginning of the growth assay. (B) and (C) Growth of pollen tubes when gelatin beads containing 500 mM glucose (asterisk) were placed in close proximity to the pollen tube tips (arrowheads). In (B), carboxyfluorescein was added in addition to the gelatin beads to monitor possible diffusion. (D) Number of seeds produced by Col-0, hxk1.3, or HXK1-OE plants under normal conditions (22°C) and after heat stress (42°C for 3 h). n ≥ 10 siliques from different plants for every genotype under each temperature condition. (E) Mean lengths ± se of hxk1.3 and wild-type pollen tubes germinated in vitro for 7 h. Samples were either prepared by spreading the total pollen of one flower or of nine flowers on the cellulosic membrane of the germination media with different sugar concentrations (n ≥ 200 pollen tubes for each genotype on every sugar concentration). (F) Distribution of seeds in the top and bottom half of Col-0 siliques after pollination with minimal amounts of Col-0, hxk1.3, HXK1-OE, Ler, or gin2-1 pollen. Means ± se of three independent experiments with n ≥ 50 siliques of every genotype in total. Independent experiments were performed with different pistil and pollen donor plants on different days. (G) Representative image of siliques pollinated with limited amounts of Col-0 or hxk1.3 pollen. Top and bottom part as defined for the measurements shown in (F) are indicated.
Figure 11.
Figure 11.
Influence of Glucose on Pollen Tube Growth of Different Plant Species. Pollen of different species were germinated in vitro on media (Supplemental Table 12) with or without glucose and imaged after ∼7 h. Length measurements of three biological replicates (different plants and different days) for every species were performed to analyze which species have glucose-sensitive pollen tubes. A slight but not significant reduction of pollen tube growth in the presence of glucose was classified as “weak reaction to glucose.” Significant reduction of pollen tube growth was classified as “strong reaction.” The results are graphically indicated in a phylogenetic tree depicting all species tested to indicate their relationships. The phylogenetic tree was generated using phyloT (https://phylot.biobyte.de/) and visualized in iTOL (Letunic and Bork, 2016) using already existing phylogenetic information from the NCBI Taxonomy Browser (https://www.ncbi.nlm.nih.gov/Taxonomy/Browser/wwwtax.cgi).
Figure 12.
Figure 12.
Schematic Model of Sugar Supply to Pollen Tubes. Sucrose delivered into cells of the stigma or transmitting tissue of the style from source tissues is unloaded into the apoplast via SWEET9/SWEET10 or cleaved by intracellular invertases. Sucrose can either be taken up into pollen tubes via SUC transporters or its monosaccharide components are taken up after cleavage by cell wall invertases (cwINV) through PMTs and STPs. Sucrose and monosaccharides derived from extracellular invertase activity contribute to pollen tube growth as signaling molecules, osmotic components or substrates for glycolysis and cell wall synthesis. Release of additional glucose from pistil cells via SWEET1 increases the glucose to fructose ratio in the apoplastic space. After uptake into pollen tubes via STPs glucose activates a signaling pathway through HXK1 localized at mitochondria or in the nucleus. Eventually, this results in the deceleration of pollen tube growth. Activated HXK1 additionally downregulates expression of STP4, STP8, and STP10. In the equimolar presence of glucose and fructose, the glucose signaling pathway is repressed.

References

    1. Abel S., Theologis A. (1994). Transient transformation of Arabidopsis leaf protoplasts: a versatile experimental system to study gene expression. Plant J. 5: 421–427. - PubMed
    1. Aguilera-Alvarado G.P., Sánchez-Nieto S. (2017). Plant hexokinases are multifaceted proteins. Plant Cell Physiol. 58: 1151–1160. - PubMed
    1. Aki T., Konishi M., Kikuchi T., Fujimori T., Yoneyama T., Yanagisawa S. (2007). Distinct modulations of the hexokinase1-mediated glucose response and hexokinase1-independent processes by HYS1/CPR5 in Arabidopsis. J. Exp. Bot. 58: 3239–3248. - PubMed
    1. Alonso J.M., et al. (2003). Genome-wide insertional mutagenesis of Arabidopsis thaliana. Science 301: 653–657. - PubMed
    1. Aluri S., Büttner M. (2007). Identification and functional expression of the Arabidopsis thaliana vacuolar glucose transporter 1 and its role in seed germination and flowering. Proc. Natl. Acad. Sci. USA 104: 2537–2542. - PMC - PubMed

MeSH terms

LinkOut - more resources