

Epigenetic dysregulation of naive CD4+ T-cell activation genes in childhood food allergy
- PMID: 30120223
- PMCID: PMC6098117
- DOI: 10.1038/s41467-018-05608-4
Epigenetic dysregulation of naive CD4+ T-cell activation genes in childhood food allergy
Abstract
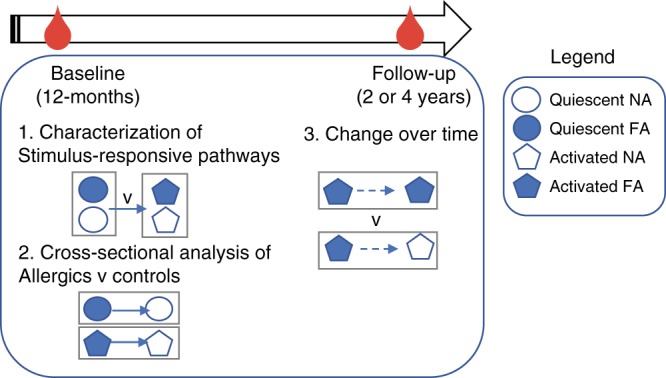
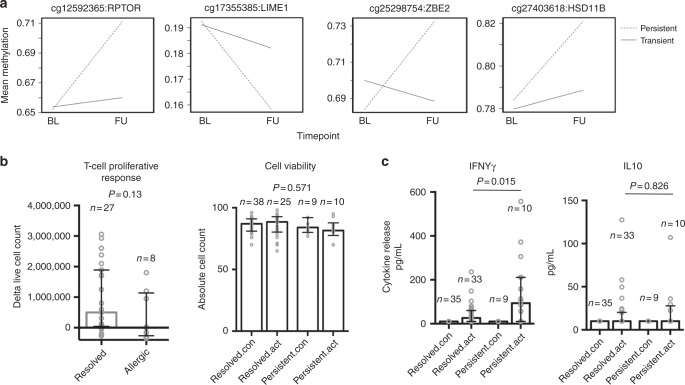
Food allergy poses a significant clinical and public health burden affecting 2-10% of infants. Using integrated DNA methylation and transcriptomic profiling, we found that polyclonal activation of naive CD4+ T cells through the T cell receptor results in poorer lymphoproliferative responses in children with immunoglobulin E (IgE)-mediated food allergy. Reduced expression of cell cycle-related targets of the E2F and MYC transcription factor networks, and remodeling of DNA methylation at metabolic (RPTOR, PIK3D, MAPK1, FOXO1) and inflammatory genes (IL1R, IL18RAP, CD82) underpins this suboptimal response. Infants who fail to resolve food allergy in later childhood exhibit cumulative increases in epigenetic disruption at T cell activation genes and poorer lymphoproliferative responses compared to children who resolved food allergy. Our data indicate epigenetic dysregulation in the early stages of signal transduction through the T cell receptor complex, and likely reflects pathways modified by gene-environment interactions in food allergy.
Conflict of interest statement
The authors declare no competing interests.
Figures
Similar articles
-
T-cell activation genes differentially expressed at birth in CD4+ T-cells from children who develop IgE food allergy.Allergy. 2012 Feb;67(2):191-200. doi: 10.1111/j.1398-9995.2011.02737.x. Epub 2011 Nov 11. Allergy. 2012. PMID: 22077487
-
Epigenome-wide association study reveals longitudinally stable DNA methylation differences in CD4+ T cells from children with IgE-mediated food allergy.Epigenetics. 2014 Jul;9(7):998-1006. doi: 10.4161/epi.28945. Epub 2014 Apr 24. Epigenetics. 2014. PMID: 24762976 Free PMC article.
-
Defining CD4 T cell memory by the epigenetic landscape of CpG DNA methylation.J Immunol. 2015 Feb 15;194(4):1565-79. doi: 10.4049/jimmunol.1401162. Epub 2015 Jan 9. J Immunol. 2015. PMID: 25576597 Free PMC article.
-
Epigenetics and development of food allergy (FA) in early childhood.Curr Allergy Asthma Rep. 2014 Sep;14(9):460. doi: 10.1007/s11882-014-0460-6. Curr Allergy Asthma Rep. 2014. PMID: 25096861 Review.
-
Clinical spectrum of food allergy in children in Australia and South-East Asia: identification and targets for treatment.Ann Med. 1999 Aug;31(4):272-81. doi: 10.3109/07853899908995890. Ann Med. 1999. PMID: 10480758 Review.
Cited by
-
Household size, T regulatory cell development, and early allergic disease: a birth cohort study.Pediatr Allergy Immunol. 2022 Jun;33(6):e13810. doi: 10.1111/pai.13810. Pediatr Allergy Immunol. 2022. PMID: 35754137 Free PMC article.
-
Epigenomic and epigenetic investigations of food allergy.Pediatr Allergy Immunol. 2024 Jan;35(1):e14065. doi: 10.1111/pai.14065. Pediatr Allergy Immunol. 2024. PMID: 38284919 Free PMC article. Review.
-
DNA methylation is not associated with sensitization to or dietary introduction of highly allergenic foods in a subset of the CHILD cohort at age 1 year.J Allergy Clin Immunol Glob. 2023 Jun 26;2(4):100130. doi: 10.1016/j.jacig.2023.100130. eCollection 2023 Nov. J Allergy Clin Immunol Glob. 2023. PMID: 37781669 Free PMC article.
-
Food Allergy Genetics and Epigenetics: A Review of Genome-Wide Association Studies.Allergy. 2025 Jan;80(1):106-131. doi: 10.1111/all.16429. Epub 2024 Dec 19. Allergy. 2025. PMID: 39698764 Free PMC article. Review.
-
Biomarkers in Food Allergy.Curr Allergy Asthma Rep. 2018 Oct 3;18(11):64. doi: 10.1007/s11882-018-0816-4. Curr Allergy Asthma Rep. 2018. PMID: 30284049 Review.
References
-
- Nowak-Wegrzyn, A., Szajewska, H. & Lack, G. Food allergy and the gut. Nat. Rev. Gastroenterol. Hepatol. 14, 241–257 (2017). - PubMed
Publication types
MeSH terms
LinkOut - more resources
Full Text Sources
Other Literature Sources
Medical
Molecular Biology Databases
Research Materials
Miscellaneous
