. 2018 Aug 17;9(1):3303.
doi: 10.1038/s41467-018-05812-2.

SUMOylation of VEGFR2 regulates its intracellular trafficking and pathological angiogenesis

Affiliations

SUMOylation of VEGFR2 regulates its intracellular trafficking and pathological angiogenesis

Huanjiao Jenny Zhou et al. Nat Commun. .

Erratum in

Abstract

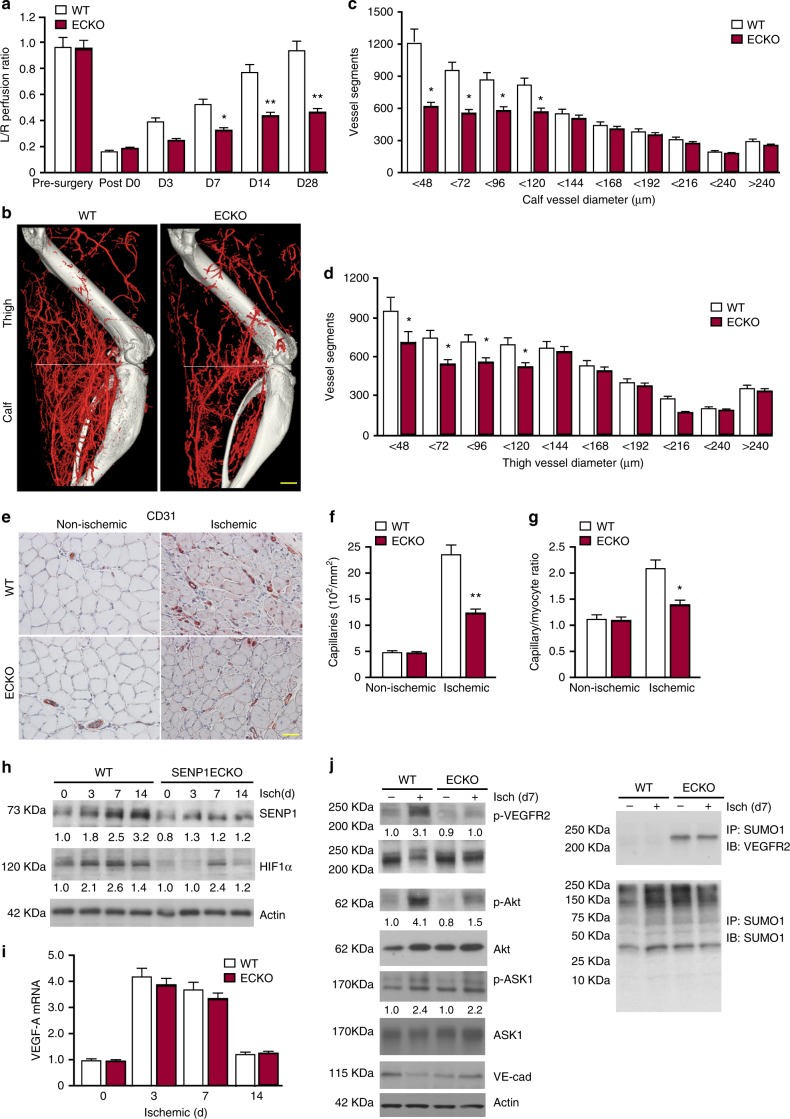
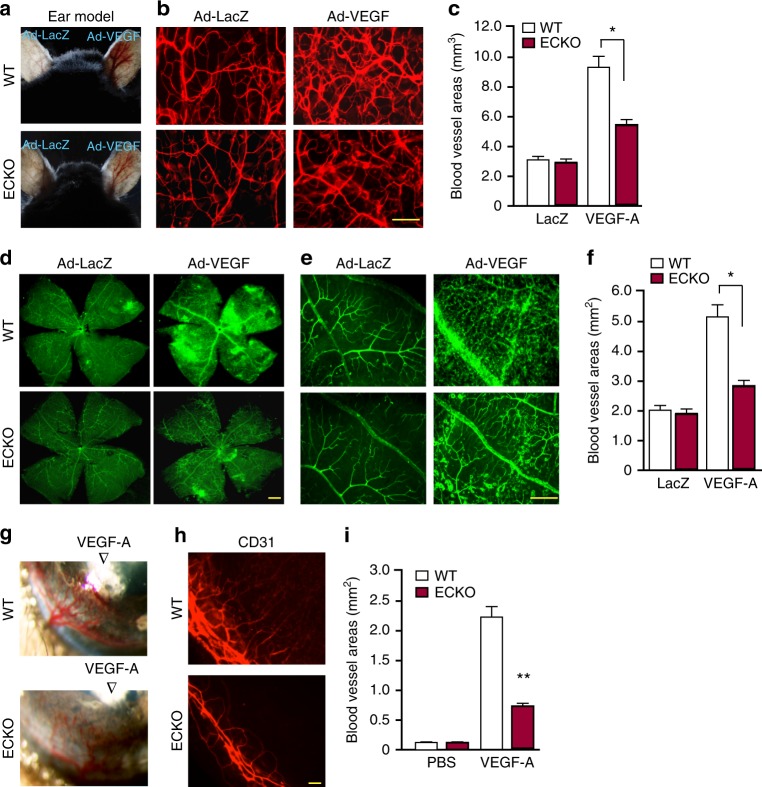
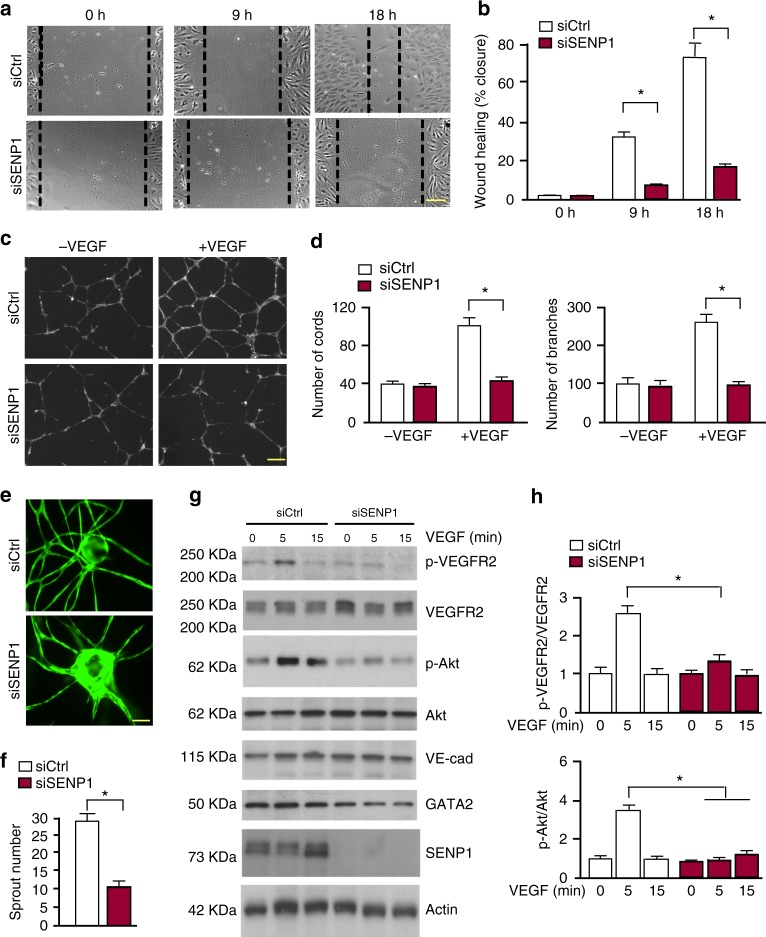
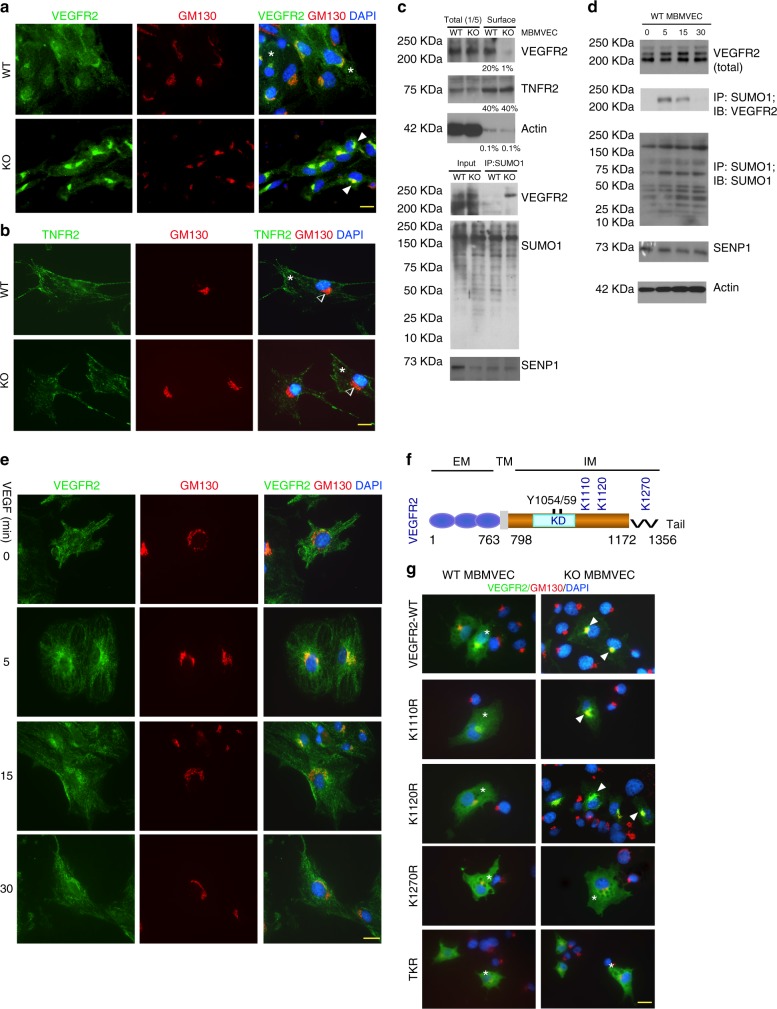
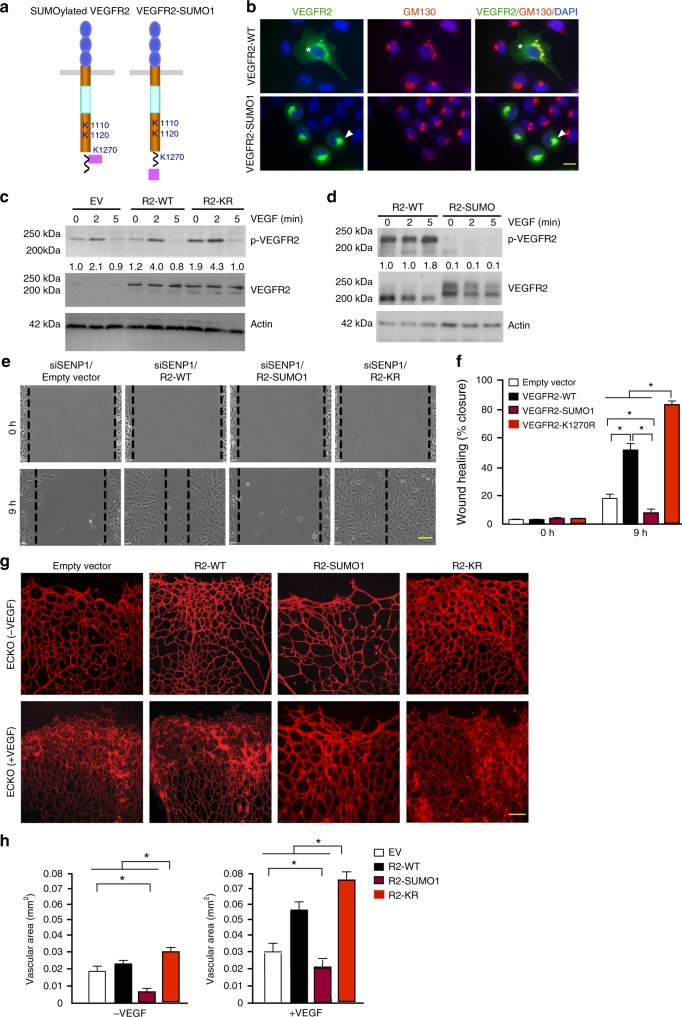
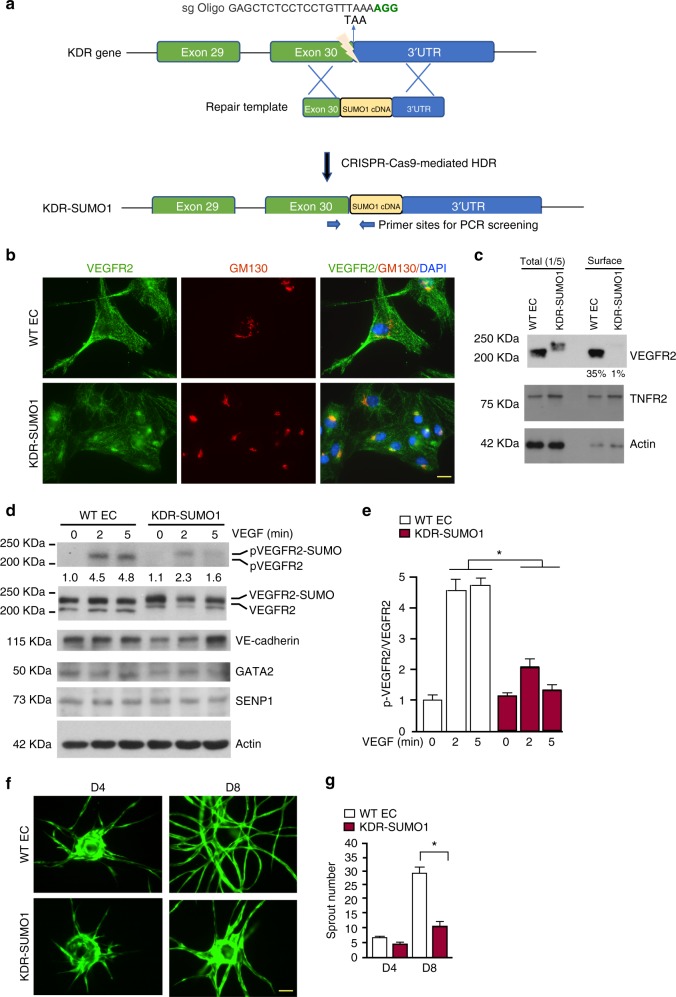
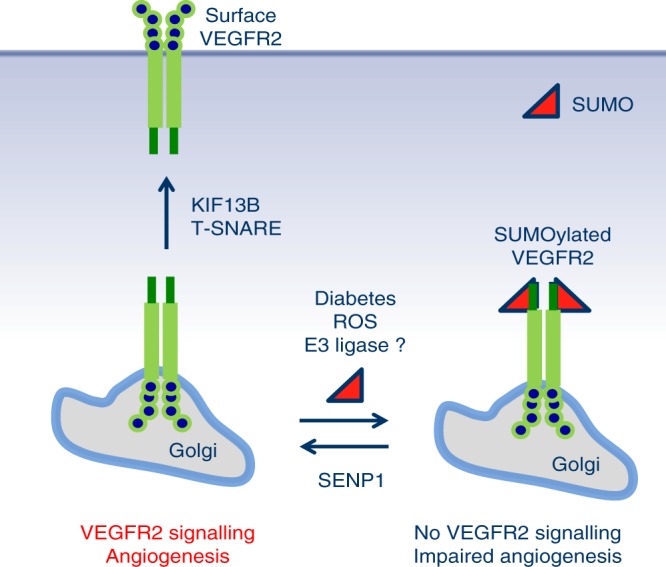
Regulation of VEGFR2 represents an important mechanism for the control of angiogenesis. VEGFR2 activity can be regulated by post-translational modifications such as ubiquitination and acetylation. However, whether VEGFR2 can be regulated by SUMOylation has not been investigated. Here we show that endothelial-specific deletion of the SUMO endopeptidase SENP1 reduces pathological angiogenesis and tissue repair during hindlimb ischemia, and VEGF-induced angiogenesis in the cornea, retina, and ear. SENP1-deficient endothelial cells show increased SUMOylation of VEGFR2 and impaired VEGFR2 signalling. SUMOylation at lysine 1270 retains VEGFR2 in the Golgi and reduces its surface expression, attenuating VEGFR2-dependent signalling. Moreover, we find that SENP1 is downregulated and VEGFR2 hyper-SUMOylated in diabetic settings and that expression of a non-SUMOylated form of VEGFR2 rescues angiogenic defects in diabetic mice. These results show that VEGFR2 is regulated by deSUMOylation during pathological angiogenesis, and propose SENP1 as a potential therapeutic target for the treatment of diabetes-associated angiogenesis.


Conflict of interest statement

The authors declare no competing interests.

Figures

Fig. 1
Fig. 1
SENP1-ECKO mice exhibit attenuated arteriogenesis and angiogenesis in vivo. WT and SENP1-ECKO mice were subjected to hindlimb ischemic ligation model (HLI). a Laser Doppler analysis of blood flow. The graph shows blood flow in the ischemic foot expressed as a ratio to flow in the normal foot. Quantitative analysis of laser Doppler images indicates significant alterations in hindlimb reperfusion starting at 7 days after femoral artery ligation in SENP1-ECKO mice relative to WT mice (n = 6 each strain). b Representative micro-CT images of WT and SENP1-ECKO mice 14 days after HLI. c, d Quantitative micro-CT analysis of arterial vasculature above and below the knee in WT mice (n = 6500 cross-sections per mouse) and SENP1-ECKO mice (n = 4500 cross-sections per mouse) 14 days after common femoral artery ligation. Note a marked decrease in total number of <120-μm-diameter vessels in SENP1-ECKO mice relative to WT littermates in thigh and calf (mean ± SEM, *P < 0.05). Statistical significance was assessed using a Mann–Whitney U test and repeated measures analysis performed using one-way nonparametric ANOVA (Kruskal Wallis test). eg Attenuated angiogenesis in SENP1-ECKO mice. Capillary density was immunostained with an EC marker CD31. Representative sections from non-ischemic and ischemic groups of WT and SENP1-ECKO mice on day 28 post-ischemia are shown in (e). Quantification of capillary density (number/mm2 muscle area) and ratio of CD31/myocyte are shown in (f, g). Data are mean ± SEM from ten fields per section (three sections/mouse and n = 4 for each strain). hj Attenuated VEGF-VEGFR2 signalling in SENP1-ECKO. Muscle tissues from WT and SENP1-ECKO were harvested at various days post-ischemia as indicated. h HIF-1α, SENP1, and β-actin were determined by western blot with respective antibodies. i VEGF-A mRNA was measured by qRT-PCR with GAPDH for normalization. Fold changes are presented. n = 2 per group. j Phosphorylations of VEGFR2, Akt, and ASK1 as well as total proteins as indicated in tissue lysates were determined by western blot with respective antibodies. SUMOylated VEGFR2 was determined by co-immunoprecipitation assays with anti-SUMO1 followed by western blotting with anti-VEGFR2. Protein bands in (h, j) were quantified by densitometry and fold changes are presented by taking WT non-ischemia as 1.0. n = 2. Error bars, mean ± SEM; P < 0.05, **P < 0.01, one-way ANOVA. Scale bar: 500 μm (b); 20 μm (e)
Fig. 2
Fig. 2
VEGF-induced retina and cornea neovascularization were greatly attenuated in SENP1-ECKO mice. ac VEGF-induced ear angiogenesis. Adenovirus encoding VEGF164 (1 × 109 pfu) (Ad-VEGF) or β-galactosidase (Ad-LacZ) was intradermally injected into the mice right and left ear skin, respectively. a VEGF-induced angiogenesis in WT and SENP1-ECKO mice was accessed by a direct microscopy. b Ear vasculature was visualized by a whole-mount staining with PE-conjugated anti-CD31. c Quantification of vessel density from 10 fields per ear (n = 5 for each group). df VEGF-induced retina angiogenesis. Ad-VEGF or Ad-LacZ (1 × 109 pfu) was injected intravitreously into WT and SENP1-ECKO mice. Retina vasculature was visualized by isolectin staining (low power images in (d) and high power images in (e) with quantification of vessel density in (f). gi VEGF-induced cornea angiogenesis assay. A Hydron pellet containing VEGF protein was implanted into the cornea of WT and SENP1-ECKO mice. Angiogenesis was assessed by stereomicroscopy on day 5 following implantation (g) and immunostaining with anti-CD31 (h). Vascular density was quantified in (i). Quantificaitons were from ten fields per tissue (ear, retina or cornea) (n = 5 for each group). Error bars, mean ± SEM; P < 0.05, **P < 0.01, one-way ANOVA. Scale bar: 100 μm (b, e, h); 400 μm (d)
Fig. 3
Fig. 3
VEGF-induced angiogenic responses were inhibited by SENP1 silencing. HUVEC were transfected with control siRNA (siCtrl) or SENP1 siRNA (siSENP1) for 24 h. Cells were cultured in 0.5% FBS for overnight and subjected to EC migration and tube formation in response to VEGF (10 ng/ml). a, b EC migration by a scratch assay for indicated times. Wound healing (% closure) was quantified. c, d EC tube formation in a Matrigel assay. Representative images are shown in (c). Number of cords and branches were quantified from ten fields per group (d). e, f 3D spheroid sprouting assay. siRNA-transfected HUVECs were infected with EGFP-expressing retroviruses. Cells were coated with microbeads, embedded in fibrin gels and grown in EGM2 medium for 8 days. e A representative image of ten beads for each sample is shown. f Quantification of sprout number is shown in panel. Three independent experiments were performed. g, h Ctrl siRNA and SENP1 siRNA HUVEC were cultured overnight in 0.5% FBS followed by VEGF treatment (10 ng/ml) for indicated times (0–15 min). g Phosphorylation of VEGFR2 and Akt as well as the total proteins as indicated were determined by western blot with respective antibodies. h Protein bands were quantified by densitometry and fold changes are presented by taking untreated siCtrl group as 1.0. n = 2. Error bars, mean ± SEM; P < 0.05, Student t-test (f) or one-way ANOVA. Scale bar: 1 mm (a, c, e)
Fig. 4
Fig. 4
SUMOylation of VEGFR2 at the C-terminal lysine-1270 retains VEGFR2 in the Golgi. a, b. MBMVEC isolated from WT and SENP1-ECKO mice were subjected to immunofluorescence staining for VEGFR2 (a) or TNFR2 (b) together with a Golgi marker GM130. c WT and SENP1-ECKO MBMVECs were cultured in normal media. Cell-surface VEGFR2 was labeled by cell-surface biotinylation, and analyzed by streptavidin bead pull-down followed by western blotting with anti-VEGFR2. Percentage of cell-surface vs total proteins (VEGFR2, TNFR2 and actin) were quantified. n = 2. d Cell lysates of MBMVEC isolated from WT and SENP1-ECKO mice were subjected to western blot for total SENP1, VEGFR2, and co-immunoprecipitation assays for VEGFR2 SUMOylation. Relative molecular weights are shown on the left. e WT MBMVEC were treated with VEGF (10 ng/ml) for indicated times, and cells were subjected to immunofluorescence staining for co-localisation of VEGFR2 with GM130 (e). f Schematic diagram of VEGFR2 domains. EM: extracellular domain, TM: transmembrane domain, IM: intracellular domain, Tail: a flexible C-terminal segment (residues aa1172–1356). The numbers refer to the amino acid number, indicating the boundary of each domain. Y1054/59 located at the activation loop and putative SUMO sites within the IM (K1110, K1120, and K1270) are indicated. All VEGFR2 expression constructs are Flag-tagged at the N termini. g VEGFR2-WT and mutants were transfected into WT or SENP1-deficient MBMVEC. Co-localisation of VEGFR2 (anti-FLAG) with GM130 was determined. Merged images are shown (see Supplementary Fig. 6 for split channel images). A total of 10 cells from each group were analyzed. Golgi-accumulated VEGFR2 is indicated by arrows while membrane/cytosolic VEGFR2 by asterisks (a, be, g). TNFR2 was absent in Golgi (b). Three independent experiments were performed. Scale bar, 20 μm (a, b, e, g)
Fig. 5
Fig. 5
SUMOylation of VEGFR2 blocks VEGFR2 surface targeting and VEGFR2-mediated angiogenesis. a Schematic diagram of VEGFR2-SUMO1 fusion compared to endogenous SUMOylated VEGFR2. b HUVECs were transfected with VEGFR2-WT or VEGFR2-SUMO1, and cells were co-immunostained with anti-VEGFR2 and GM130. Merged images with DAPI counterstaining (blue) are shown. A total of 10 cells from each group were analyzed. Golgi-accumulated VEGFR2 is indicated by arrows while membrane/cytosolic VEGFR2 by asterisks. c, d HUVECs were infected with lentivirus expressing empty vector (EV), VEGFR2-WT, VEGFR2-KR or VEGFR2-SUMO1 followed by VEGF treatment as indicated. Phosphor- and total VEGFR2 were examined by western blotting. Protein bands were quantified by densitometry and fold changes are presented by taking untreated VEGFR2-WT group as 1.0. n = 2. e, f HUVEC were infected with lentivirus expressing empty vector, VEGFR2-WT, VEGFR2-SUMO1 and VEGFR2-K1270R for 24 h. Cells were cultured in 0.5% FBS for overnight and subjected to EC migration in response to VEGF (10 ng/ml). Representative images are presented in (e) and wound healing (% closure) at 9 h was quantified in (f). Data are mean ± SEM from ten fields per group. Three independent experiments were performed. g, h VEGFR2-SUMO1 blunts retina angiogenesis. Ad-VEGF or Ad-LacZ (1 × 109 pfu) was co-injected intravetrously with VEGFR2-WT, VEGFR2-SUMO1 or VEGFR2-K1270R into 4 day-old pups. Retina was harvested on day 5 post-injection and retina vasculature was visualized by isolectin staining with confocal images in (g) with quantification of vessel density in (h). n = 5 for each group. Error bars, mean ± SEM; P < 0.05, one-way ANOVA. Scale bar, 20 μm (b); 1 mm (e); 100 μm (g)
Fig. 6
Fig. 6
VEGFR2-SUMO1 fusion in human EC inhibits VEGF-mediated angiogenesis. a Schematic diagram of KDR-SUMO1 knockin in human EC by CRISPR/Cas9-mediated gene editing. A specific sgRNA targeting the vicinity of the stop codon of KDR gene encoding VEGFR2 and a repair template containing targeting arms with exon 30 as 5′ arm and the 3′UTR of the KDR gene as 3′ arm flanking the SUMO1 cDNA. Upon CRISPR/Cas9-mediated DNA double-strand breaks were repaired through homologous-directed repair, the SUMO1 cDNA was integrated into the KDR locus just before the termination signal. The PCR primers used for screening for KDR-SUMO1 fusion clones are indicated. b WT human EC and KDR-SUMO1 knockin EC were subjected to immunofluorescence staining for co-localisation of VEGFR2 with GM130. Similar pattern localisation was observed in cells derived from additional two clones. c WT human EC and KDR-SUMO1 knockin EC were cultured in normal media. Cell-surface VEGFR2 was labeled by cell-surface biotinylation, and analyzed by streptavidin bead pull-down followed by western blotting with anti-VEGFR2. Percentage of cell-surface VEGFR2 vs total VEGFR2 in WT EC and KDR-SUMO1 EC were quantified. n = 3. d, e WT human EC and KDR-SUMO1 knockin EC were treated with VEGF (10 ng/ml) for indicated times, and cells were subjected to western blot for VEGFR2 phosphorylation (c). Protein bands were quantified by densitometry and fold changes are presented by taking untreated WT group as 1.0 (d). n = 2. f, g 3D spheroid sprouting assay. Human ECs were infected with EGFP-expressing retroviruses. Cells were coated with microbeads, embedded in fibrin gels and grown in EGM2 medium for 8 days. A representative image of ten beads for each sample is shown (f). Quantification of sprout number is shown in panel (g). Three independent experiments were performed. Error bars, mean ± SEM; *P < 0.05, one-way ANOVA. Scale bar: 20 μm (b); 1 mm (f)
Fig. 7
Fig. 7
The SENP1-VEGFR2 signalling in diabetic angiogenesis. a, b HUVEC were cultured under 5 mM or 25 mM glucose for 72 h. Expression of SENP1 and VEGFR2 SUMOylation were determined (a). VEGFR2 localisation was determined by indirect immunofluorescence for VEGFR2 and GM130 (b). c Tissues from WT and STZ mice were harvested. SENP1 expression in brain (whole lysates), retina and ear skin (the vascular layer) was determined by western blot with anti-SENP1. d SENP1 expression in MBMVEC isolated from WT and STZ mice. Protein bands in (c, d) were quantified by densitometry and fold changes are presented by taking WT group as 1.0. n = 2. e VEGFR2 localisation in MBMVEC isolated from WT and STZ mice was determined by indirect immunofluorescence for VEGFR2 and GM130. fh Adenovirus encoding VEGF164 (1 × 109 pfu) (Ad-VEGF) or β-galactosidase (Ad-LacZ) was co-injected with empty vector, VEGFR2-WT, VEGFR2-SUMO1 or VEGFR2-K1270R intradermally into ear skin of SENP1-ECKO mice. VEGF-induced angiogenesis in WT and SENP1-ECKO mice was accessed by a whole-mount staining with anti-CD31 antibody. Vascular density was quantified and data are mean ± SEM from ten fields per mouse ear. (n = 5 for each group). Error bars, mean ± SEM; *P < 0.05, one-way ANOVA. Scale bar: 20 μm (b); 100 μm (f)
Fig. 8
Fig. 8
A model for SENP1-mediated VEGFR2 trafficking. SENP1 maintains VEGFR2 in an un-SUMOylated state, ensuring normal trafficking of VEGFR2 from ER/Golgi to plasma membrane in EC. We propose that a pool of VEGFR2 is constantly SUMOylated by an unidentified SUMO E3 ligase in resting EC or upon VEGF-engagement, and stored at the Golgi. Under pathological conditions such as ischemia, SENP1 expression is induced so that SUMOylated VEGFR2 can be rapidly deconjugated and transported to plasma membrane for strong angiogenesis response. Pathological conditions such as hyperglycemia and diabetes downregulate/inactivate SENP1, causing VEGFR2 hyper-SUMOylation and impaired angiogenic signalling as seen in SENP1-deficient EC (see text for details)

References

    1. Carmeliet P, Jain RK. Molecular mechanisms and clinical applications of angiogenesis. Nature. 2011;473:298–307. doi: 10.1038/nature10144. - DOI - PMC - PubMed
    1. Ferrara N, Gerber HP, LeCouter J. The biology of VEGF and its receptors. Nat. Med. 2003;9:669–676. doi: 10.1038/nm0603-669. - DOI - PubMed
    1. Simons M, Gordon E, Claesson-Welsh L. Mechanisms and regulation of endothelial VEGF receptor signalling. Nat. Rev. Mol. Cell Biol. 2016;17:611–625. doi: 10.1038/nrm.2016.87. - DOI - PubMed
    1. Gampel A, et al. VEGF regulates the mobilization of VEGFR2/KDR from an intracellular endothelial storage compartment. Blood. 2006;108:2624–2631. doi: 10.1182/blood-2005-12-007484. - DOI - PubMed
    1. Manickam V, et al. Regulation of vascular endothelial growth factor receptor 2 trafficking and angiogenesis by Golgi localized t-SNARE syntaxin 6. Blood. 2011;117:1425–1435. doi: 10.1182/blood-2010-06-291690. - DOI - PMC - PubMed

Publication types

MeSH terms

LinkOut - more resources