. 2018 Aug 17;9(1):3291.
doi: 10.1038/s41467-018-05825-x.

Insights into degradation mechanism of N-end rule substrates by p62/SQSTM1 autophagy adapter

Affiliations

Insights into degradation mechanism of N-end rule substrates by p62/SQSTM1 autophagy adapter

Do Hoon Kwon et al. Nat Commun. .

Abstract

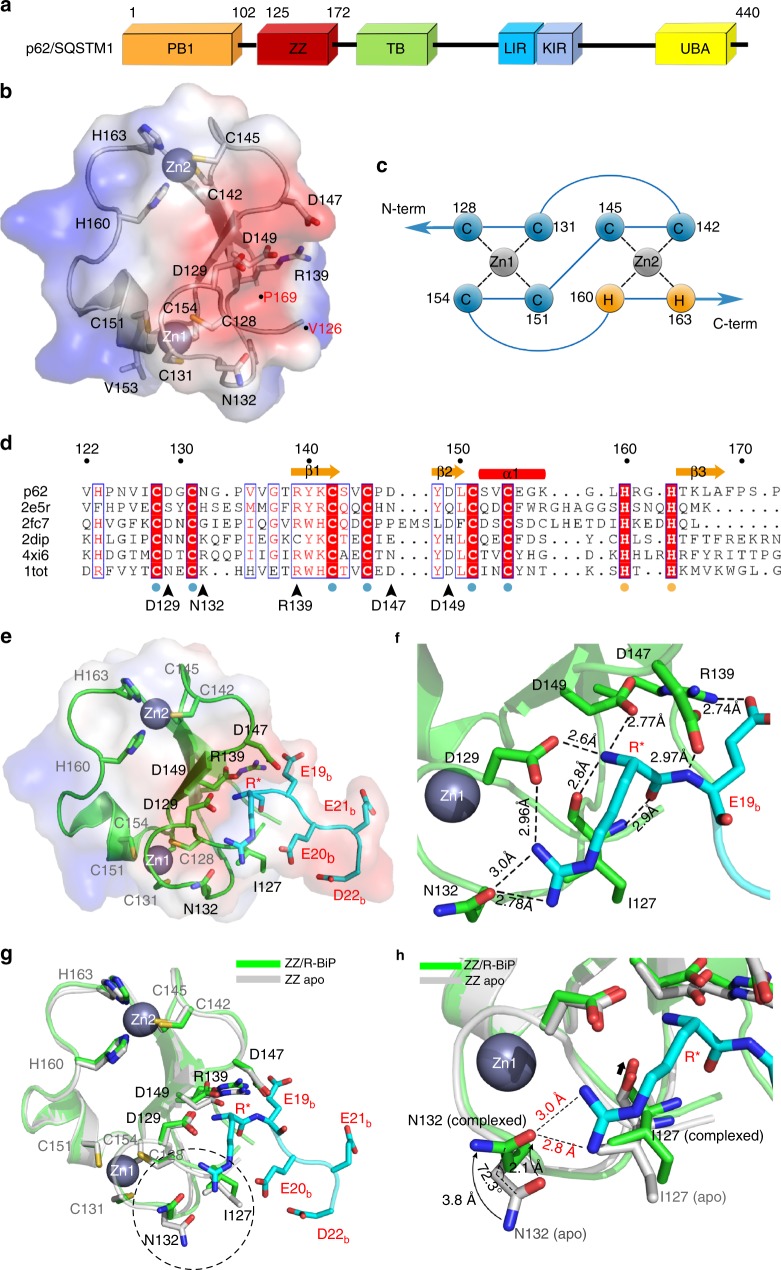
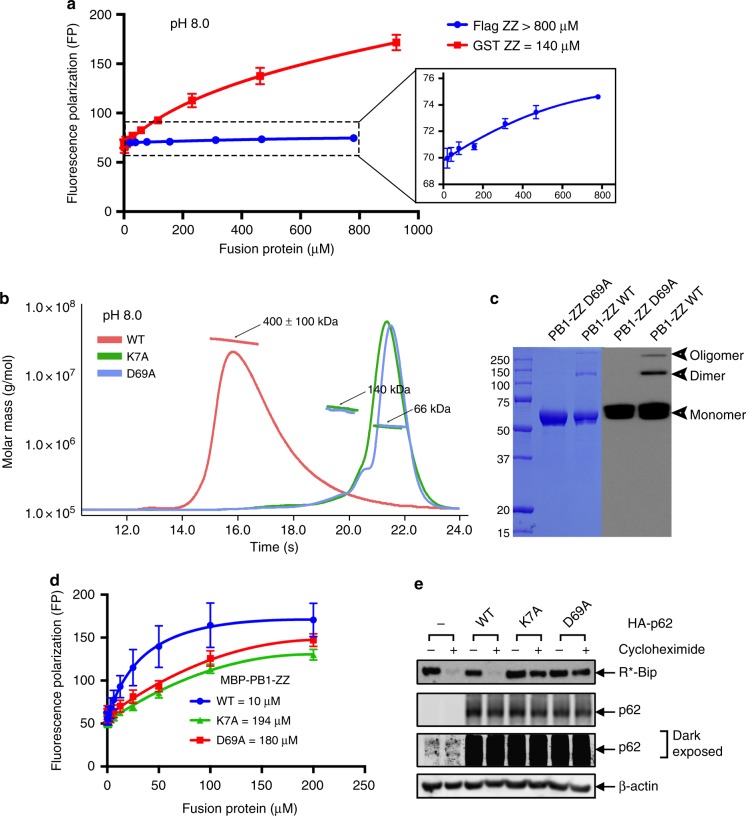
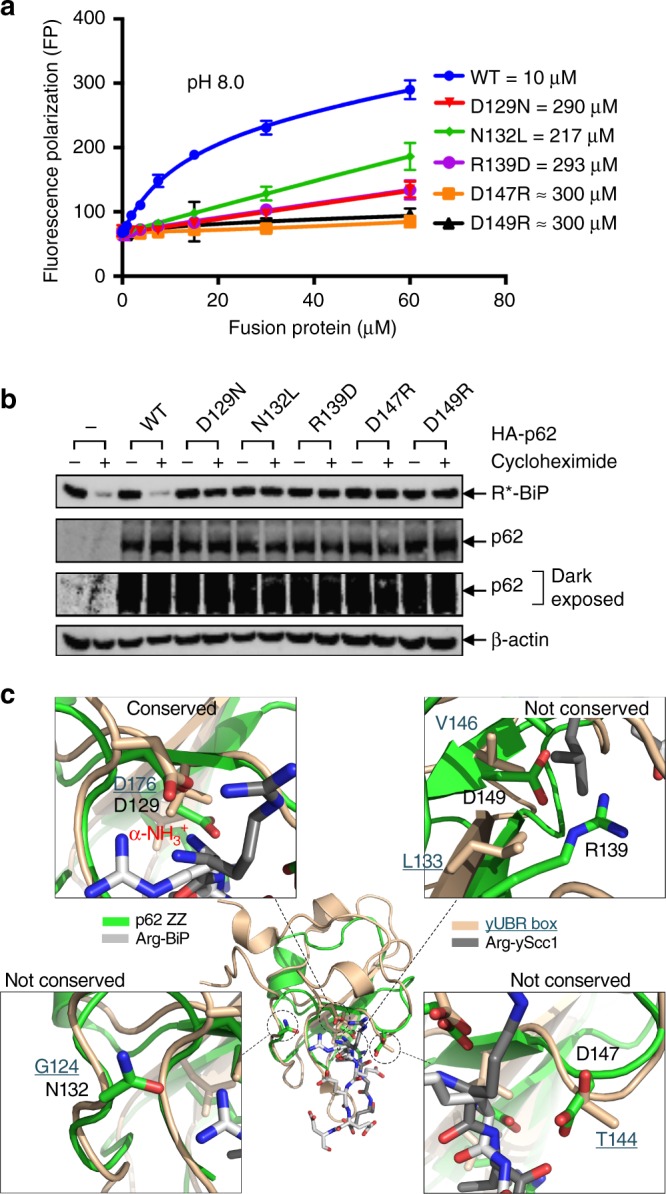
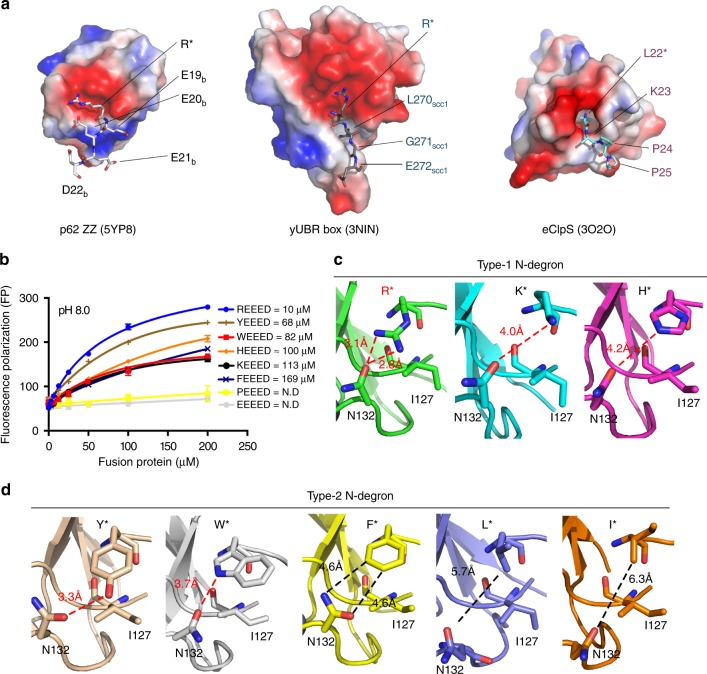
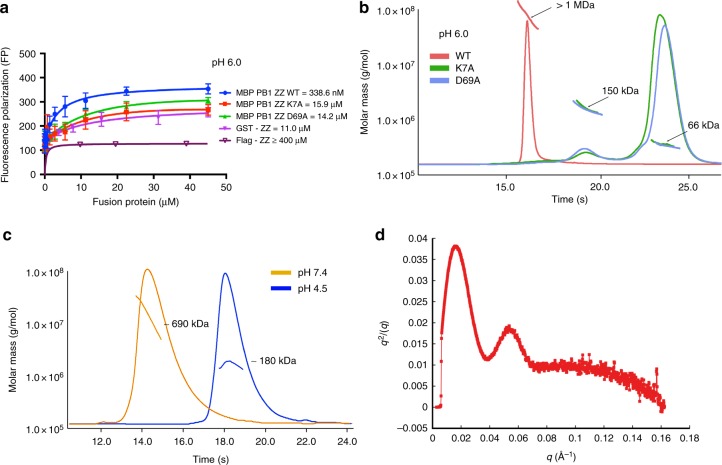
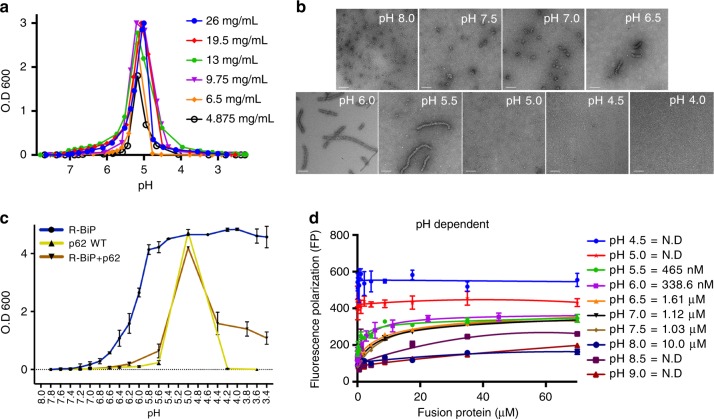
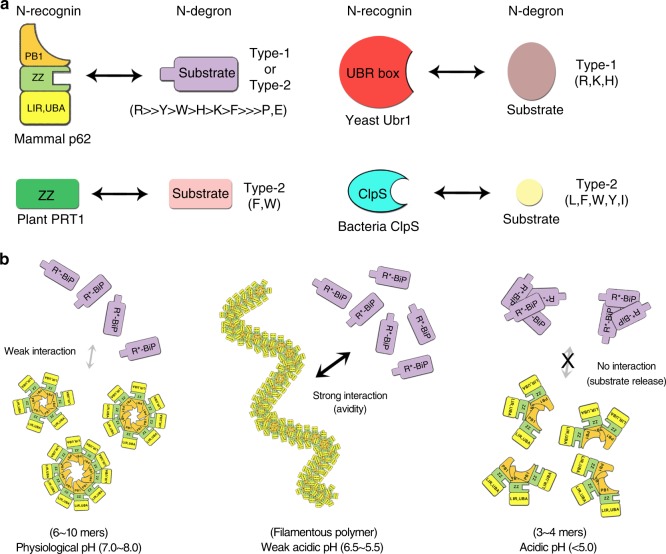
p62/SQSTM1 is the key autophagy adapter protein and the hub of multi-cellular signaling. It was recently reported that autophagy and N-end rule pathways are linked via p62. However, the exact recognition mode of degrading substrates and regulation of p62 in the autophagic pathway remain unknown. Here, we present the complex structures between the ZZ-domain of p62 and various type-1 and type-2 N-degrons. The binding mode employed in the interaction of the ZZ-domain with N-degrons differs from that employed by classic N-recognins. It was also determined that oligomerization via the PB1 domain can control functional affinity to the R-BiP substrate. Unexpectedly, we found that self-oligomerization and disassembly of p62 are pH-dependent. These findings broaden our understanding of the functional repertoire of the N-end rule pathway and provide an insight into the regulation of p62 during the autophagic pathway.


Conflict of interest statement

The authors declare no competing interests.

Figures

Fig. 1
Fig. 1
Structure of the ZZ-domain of p62. a Domain architecture of p62. The PB1 domain is responsible for oligomerization and localization. The ZZ-domain recognizes both type-1 and type-2 N-degrons. The TB domain, LIR motif and UBA are involved in the interaction with TRAF6, LC3-family proteins and ubiquitin, respectively. b Transparent molecular surface showing the electrostatic potential of the ZZ-domain. Negatively and positively charged surfaces are colored red and blue, respectively. Side chains of residues that participate in zinc coordination are shown as stick models and bound zinc ions are shown as slate-colored spheres. The built model of the ZZ-domain comprises residues from Val126 to Pro169 and are marked with dots and labeled. c Schematic diagram showing zinc-coordination. The first zinc atom (Zn1) is coordinated by four cysteine residues, and the second zinc (Zn2) by two cysteine and two histidine residues. d Sequence alignment of ZZ-domain structures in the Protein Data Bank (2e5r: human α-dystrobrevin; 2fc7: human ZZZ3 protein; 2dip: human SWIM domain containing protein 2; 4xi6: human mind bomb 1; 1tot: mouse CREB-binding protein). Zinc-coordinated residues are strictly conserved among all ZZ-domains, although key residues involved in the recognition of N-degrons (marked with black arrow-heads) are not conserved. e Ribbon diagram with transparent electrostatic surface showing the structure of the ZZ-domain in complex with R-BiP substrate (REEED). Residues coordinating zinc atoms and key residues in p62 involved in the recognition of N-degrons are shown as stick models with carbon, nitrogen, and oxygen atoms in green, blue and red, respectively. The bound N-degron is also shown as a stick model with carbon atoms in cyan. Residues of the ZZ-domain are labeled black and those of R-BiP are labeled red with the * and subscript “b” next to the sequence number for clarity. f Close-up view of interaction region between the ZZ-domain and R-BiP. Hydrogen bonds are shown as dotted lines and the distance is indicated. g Superposition of the structure of apo-ZZ-domain (gray) with that of the R-BiP complex (green). The two structures are almost identical except for Asn132 indicated by a dotted circle. h Close-up view of conformational change of Asn132 of the ZZ-domain of p62 upon complex formation
Fig. 2
Fig. 2
Oligomerization of p62 affects the binding affinity and degradation of R-BiP. a Binding affinity measurements using FITC-labeled R-BiP peptide against increasing concentrations of the ZZ-domain at pH 8.0. The ZZ-domain fused with dimeric GST (red line) showed higher affinity than that with the flag-tag (blue line), which has extremely weak binding affinity as shown in the inset. The error bars represent standard error of the mean (S.E.M.) of more than three independent experiments. b The SEC-MALS results with MBP-PB1-ZZ WT (red line) and mutants K7A (green line) and D69A (sky blue line) at pH 8.0. The horizontal line represents the measured molar mass. Each species is indicated by an arrow with experimental (SEC-MALS) molar mass. WT showed a higher oligomeric state whereas the K7A and D69A mutants mainly adopted a monomeric state with minor dimeric species. c The SDS-PAGE results with MBP-PB1-ZZ WT and D69A mutant. The left blue gel is stained with Coomassie Brilliant Blue and the right shows the results of the Western blot. The D69A mutant adopted exclusively a monomeric state whereas WT showed oligomeric forms even under denaturing conditions. d Binding affinity measurements using FITC-labeled R-BiP peptide against increasing concentrations of MBP-PB1-ZZ WT (blue line) and mutants K7A (green line) and D69A (red line) at pH 8.0. The error bars represent standard error of the mean (S.E.M.) of more than three independent experiments. e Degradation assay of R-BiP generated from Ub–R-BiP using oligomerization defect mutants (K7A and D69A) in HeLa cells in the absence of MG132. Cells were treated with 50 μg/ml cycloheximide, and then subjected to immunoblotting of R-BiP. Oligomerization defect mutants are unable to degrade R-BiP protein in the cell (see also Supplementary Fig. 7 for p62 degradation). Uncropped images of Western blots are shown in Supplementary Figure 11
Fig. 3
Fig. 3
Mutational effects of key determinants on the recognition of N-degrons. a Binding affinity measurements using FITC-labeled R-BiP peptide against increasing concentrations of p62 mutants (MBP-PB1-ZZ WT—blue line, D129N—red line, N132L—green line, R139D—violet line, D147R—orange line, and D149R—black line) at pH 8.0. The error bars represent standard error of the mean (S.E.M.) of more than three independent experiments. b Degradation assay of R-BiP generated from Ub–R-BiP using key determinant mutants (D129N, N132L, R139D, D147R, and D149R) in HeLa cells in the absence of MG132. Cells were treated with 50 μg/ml cycloheximide, and then subjected to immunoblotting of R-BiP. Recognition defect mutants are unable to degrade R-BiP protein in the cell. Uncropped images of Western blots are shown in Supplementary Figure 11. c Superposition of structures of R-BiP-bound ZZ-domain (green ribbon) and Scc1-bound UBR box (beige ribbon). Key residues in the ZZ-domain are marked with black dotted circles (center) with a close-up view of each region for details. The labeled residues for the ZZ-domain and UBR box are colored black and dark green (underlined), respectively, for clarity
Fig. 4
Fig. 4
Recognition of type-1 and type-2 N-degrons by p62. a Molecular surface showing the electrostatic potential of the ZZ-domain (left), yeast UBR box (middle) and E. coli ClpS (right). Bound peptides are shown in white, gray, and cyan as stick models for R-BiP, Arg-Scc1 and Leu-peptide substrates, respectively. Red and blue colors represent negatively and positively charged surfaces, respectively (see Supplementary Fig. 8). b Binding affinity measurements using various FITC-labeled N-degron peptides against increasing concentrations of MBP-PB1-ZZ at pH 8.0. Different line colors and symbols are used to distinguish each peptide. The error bars represent standard error of the mean (S.E.M.) of more than three independent experiments. c Close-up view of the recognition of type-1 N-degrons by the ZZ-domain of p62. d Close-up view of the recognition of type-2 N-degrons by the ZZ-domain of p62. The bound peptide and key residues of p62 are shown as stick models. Nitrogen and oxygen atoms are colored blue and red, respectively. Hydrogen bonding and van der Waals contact distances are marked as dashed lines and labeled. Asn132 of p62 is particularly important for the recognition of type-1 as well as type-2 N-degron substrates (see Supplementary Fig. 9)
Fig. 5
Fig. 5
Oligomeric states of p62 are controlled by pH. a Binding affinity measurements using FITC-labeled R-BiP peptide against increasing concentrations of p62 constructs (MBP-PB1-ZZ WT—blue line, MBP-PB1-ZZ K7A—red line, MBP-PB1-ZZ D69A—green line, GST-ZZ—violet line, and Flag-ZZ—wine line) at pH 6.0. The error bars represent standard error of the mean (S.E.M.) of more than three independent experiments. b The SEC-MALS results with MBP-PB1-ZZ WT (red line) and mutants K7A (green line) and D69A (sky blue line) at pH 6.0. The horizontal line represents the measured molar mass. Each species is indicated by an arrow with experimental (SEC-MALS) molar mass. WT protein adopted huge polymeric states whereas the K7A and D69A mutants adopted mainly monomeric states with minor dimeric species as shown in Fig. 2b. c The SEC-MALS result with MBP-PB1-ZZ WT at physiological pH 7.4 (orange line) and acidic pH 4.5 (blue line). The horizontal lines represent the measured molar mass, which approximated a decamer at pH 7.4 and trimer at pH 4.5. d Kratky plot of SAXS experiment to verify folding of p62 at pH 4.5
Fig. 6
Fig. 6
pH-dependent assembly and disassembly of p62. a Monitoring of high-order oligomerization of p62 by particle turbidity with decreasing pH. Depending on the concentration of MBP-PB1-ZZ, the pH values showing maximal particle size differ slightly. At least three experiments were performed using various protein and HCl concentrations. b Representative negative-stain TEM images of MBP-PB1-ZZ at various pH conditions (8.0, 7.5, 7.0, 6.5, 6.0, 5.5, 5.0, 4.5, and 4.0). Filamentous p62 proteins of various lengths are formed at pH 6.5, 6.0 and 5.5. Relatively globular small oligomers are observed at pH 8.0, 7.5 and 7.0. Particle sizes are too small to observe at pH values below 5.0. The indicated scale bar represents 100 nm. c Monitoring of aggregation of R-BiP in absence/presence of p62 by particle turbidity with decreasing pH. Although the R-BiP protein is ordinarily denatured at acidic pH, denaturation is limited via protection by the p62 protein. At least three experiments were performed using various protein and HCl concentrations. The error bars represent standard error of the mean (S.E.M.). d Binding affinity measurements using FITC-labeled R-BiP peptide against increasing concentrations of p62 at various pH ranging from 4.5 to 9.0. Strong nano-molar scale binding was observed at pH 5.5 and 6.0, while no binding was observed under extremely acidic or basic conditions. The error bars represent standard error of the mean (S.E.M.) of more than three independent experiments
Fig. 7
Fig. 7
Schematic model of N-degron recognition and pH-dependent regulation of p62. a The ZZ-domain of mammalian p62 recognizes cargo-bound R-BiP or unknown N-degron (type-1 or type-2) proteins (colored lavender). The PB1, ZZ and remaining (LIR and UBA) domains in p62 are colored orange, light green and yellow, respectively. The ZZ-domain of plant PRT1 E3 Ub ligase recognizes bulky aromatic hydrophobic N-degron. The UBR box from yeast Ubr1 and bacterial ClpS protein recognize basic type-1 and hydrophobic type-2 substrates, respectively. b pH-dependent regulation of p62 oligomerization. The R-BiP chaperon (colored lavender) binds to the ubiquitylated aggregate under certain conditions such as stress. The R-BiP containing N-degron is recognized by small-oligomer p62 at physiological pH with very weak affinity (left). p62 forms a long filamentous polymer at lower pH conditions, which might be similar to the environment for forming pre-autophagosomal structures or autophagosomes, and the functional affinity increases markedly via enhanced avidity (middle). The filamentous p62 polymer is converted into smaller-sized oligomers at below pH 5.0, as reflects lysosomal pH conditions, which facilitates release of the substrates from the p62-bound complex (right)

Comment in

References

    1. Klionsky DJ, Emr SD. Cell biology—autophagy as a regulated pathway of cellular degradation. Science. 2000;290:1717–1721. doi: 10.1126/science.290.5497.1717. - DOI - PMC - PubMed
    1. Nakatogawa H, Suzuki K, Kamada Y, Ohsumi Y. Dynamics and diversity in autophagy mechanisms: lessons from yeast. Nat. Rev. Mol. Cell Biol. 2009;10:458–467. doi: 10.1038/nrm2708. - DOI - PubMed
    1. Varshavsky A. The ubiquitin system, autophagy, and regulated protein degradation. Annu. Rev. Biochem. 2017;86:123–128. doi: 10.1146/annurev-biochem-061516-044859. - DOI - PubMed
    1. Hershko A, Ciechanover A. The ubiquitin system for protein degradation. Annu. Rev. Biochem. 1992;61:761–807. doi: 10.1146/annurev.bi.61.070192.003553. - DOI - PubMed
    1. Cohen-Kaplan V, et al. p62- and ubiquitin-dependent stress-induced autophagy of the mammalian 26S proteasome. Proc. Natl Acad. Sci. USA. 2016;113:E7490–E7499. doi: 10.1073/pnas.1615455113. - DOI - PMC - PubMed

Publication types