. 2018 Aug 17;8(1):12390.
doi: 10.1038/s41598-018-29658-2.

Tdp-25 Routing to Autophagy and Proteasome Ameliorates its Aggregation in Amyotrophic Lateral Sclerosis Target Cells

Affiliations

Tdp-25 Routing to Autophagy and Proteasome Ameliorates its Aggregation in Amyotrophic Lateral Sclerosis Target Cells

Maria Elena Cicardi et al. Sci Rep. .

Abstract

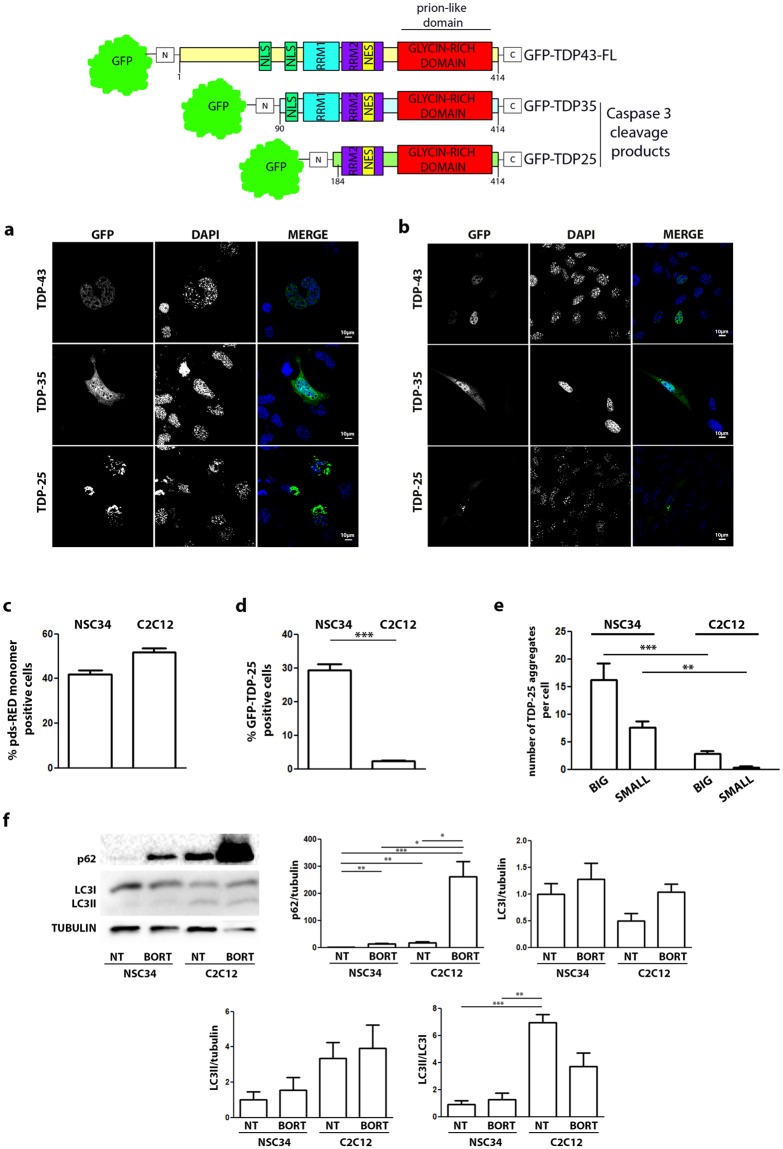
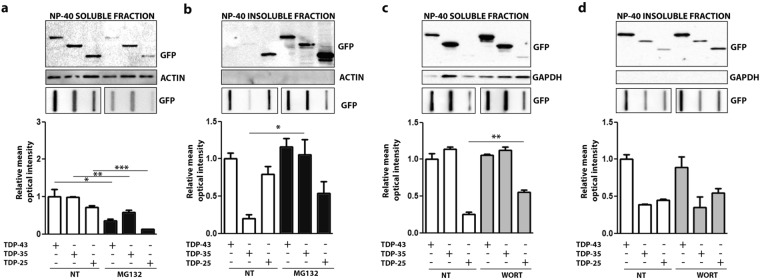
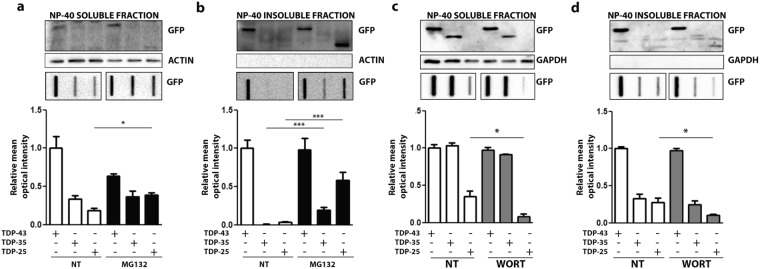
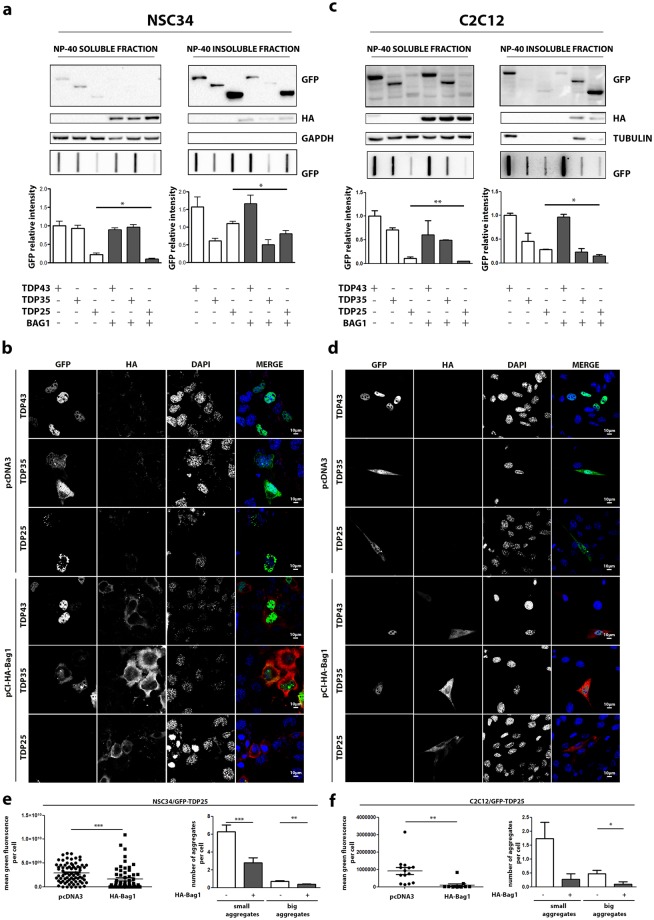
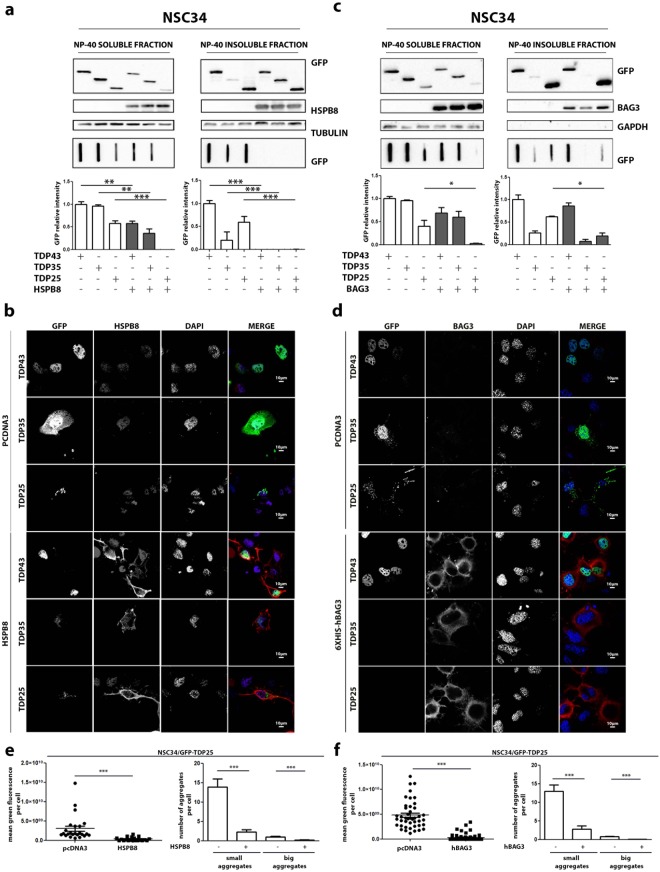
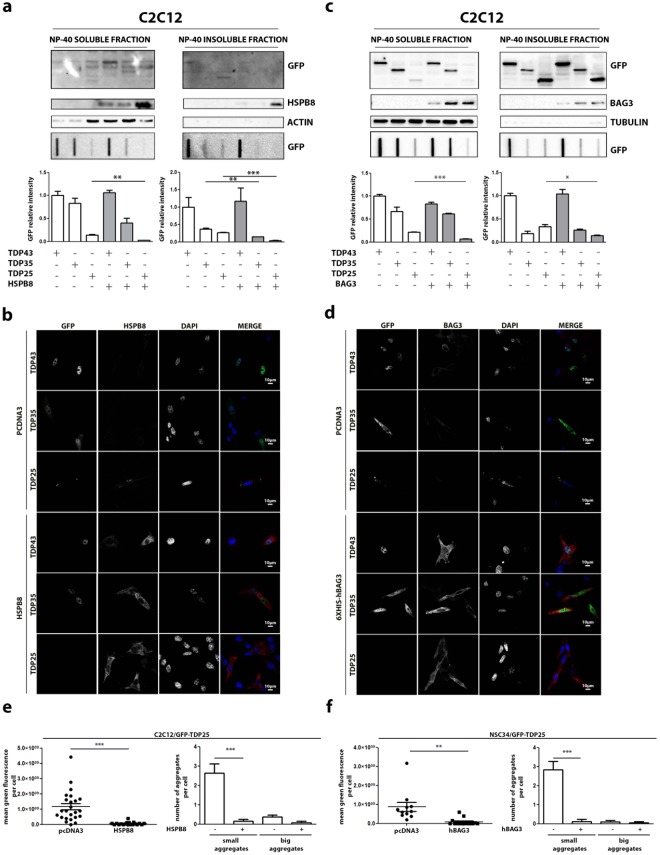
Amyotrophic lateral sclerosis (ALS) is a fatal neurodegenerative disease that primarily affects motoneurons, while non-neuronal cells may contribute to disease onset and progression. Most ALS cases are characterized by the mislocalization and aggregation of the TAR DNA binding protein 43 (TDP-43) in affected cells. TDP-43 aggregates contain C-terminal TDP-43 fragments of 35 kDa (TDP-35) and 25 kDa (TDP-25) and have been mainly studied in motoneurons, while little is currently known about their rate of accumulation and clearance in myoblasts. Here, we performed a comparative study in immortalized motoneuronal like (NSC34; i-motoneurons) cells and stabilized myoblasts (C2C12; s-myoblasts) to evaluate if these two cell types differentially accumulate and clear TDP forms. The most aggregating specie in i-motoneurons is the TDP-25 fragment, mainly constituted by the "prion-like" domain of TDP-43. To a lower extent, TDP-25 also aggregates in s-myoblasts. In both cell types, all TDP species are cleared by proteasome, but TDP-25 impairs autophagy. Interestingly, the routing of TDP-25 fragment to proteasome, by overexpressing BAG1, or to autophagy, by overexpressing HSPB8 or BAG3 decreased its accumulation in both cell types. These results demonstrate that promoting the chaperone-assisted clearance of ALS-linked proteins is beneficial not only in motoneurons but also in myoblasts.


Conflict of interest statement

The authors declare no competing interests.

Figures

Figure 1
Figure 1
TDP-43 variants show different behavior in NSC34 and C2C12 cells. (Upper Panel) schematic representation of TDPs variants used in this study. (a,b) Confocal microscope analyses. NSC34 (a) or C2C12 (b) cells were transiently transfected with GFP-TDP-43, GFP-TDP-35, GFP-TDP-25 plasmids. Nuclei were stained with DAPI. Images were acquired using confocal microscope with 63X magnification. (c,d) Fluorescent flow cytometry analysis. NSC34 and C2C12 were transiently transfected with pDS-RED-monomer and GFP-TDP-25: (c) percentage of cells displaying red fluorescence and (d) percentage of red fluorescent cells displaying green fluorescence. (e) Aggregates count. NSC34 and C2C12 were transiently transfected with GFP-TDP-43, GFP-TDP-35, GFP-TDP-25. Big aggregates: dots composed of more than 1,000,000 pixels. Small aggregates: dots composed of less than 1,000,000 pixels. (f) Degradative systems activation in NSC34 and C2C12. NSC34 and C2C12 were treated with Bortezomib 200 nM. WB (15% polyacrilamide gel) shows p62, LC3I and LC3II levels. Graphics show quantification of p62 protein levels normalized on tubulin, quantification of LC3I protein levels normalized on tubulin, quantification of LC3II protein levels normalized on tubulin, LC3II/LC3I ratio (full-length blots/gels are presented in Supplementary Figure S4).
Figure 2
Figure 2
TDP-43 variants behavior in NSC34 and C2C12 cells. (a) Fractionation. NSC34 cells were transiently transfected with GFP-TDP-43, GFP-TDP-35, GFP-TDP-25. Western blot (WB) shows PBS, TRITON X-100, SDS and formic acid (FA) extracts, each set of sample loaded on a separate 10% polyacrylamide gel. Tubulin was used as loading control (full-length blots/gels are presented in Supplementary Figure S5). (b) Confocal microscope analysis. NSC34 cells were transiently transfected with GFP-TDP-43, or p2XFLAG-TDP-43. Nuclei were stained with DAPI. Images were acquired using confocal microscope with 63X magnification. (c) Nucleus/cytoplasm fractionation: NSC34 cells were transiently transfected with pcDNA3, GFP-TDP-43, or p2XFLAG-TDP-43. WB shows nuclear and cytoplasmic fractions, each set of sample loaded on a different 10% polyacrylamide gel (full-length blots/gels are presented in Supplementary Figure S5). (d) Filter retardation assay performed on PBS extracts of NSC34 transfected with pEGFP-TDP-43 and p2XFLAG-TDP-43 (full-length blots/gels are presented in Supplementary Figure S5). (e) Fractionation. C2C12 cells were transiently transfected with GFP-TDP-43, GFP-TDP-35, GFP-TDP-25. WB shows PBS, TRITON X-100, SDS and formic acid (FA) extracts, each set of sample loaded on a separate 10% polyacrylamide gel. Tubulin was used as loading control (full-length blots/gels are presented in Supplementary Figure S6). (f) Confocal microscope analysis. C2C12 cells were transiently transfected with GFP-TDP-43, or p2XFLAG-TDP-43. Nuclei were stained with DAPI. Images were acquired using confocal microscope with 63X magnification. (g) Nucleus/cytoplasm fractionation: C2C12 were transiently transfected with pcDNA3, GFP-TDP-43, or p2XFLAG-TDP-43. WB shows nuclear and cytoplasmic fractions, each set of sample loaded on a different 10% polyacrylamide gel (full-length blots/gels are presented in Supplementary Figure S6). (h) Filter retardation assay performed on PBS extracts of C2C12 transfected with pEGFP-TDP-43 and p2XFLAG-TDP-43 (full-length blots/gels are presented in Supplementary Figure S6).
Figure 3
Figure 3
Degradative systems involvement in NSC34 cells with GFP-TDPs species. NSC34 transiently transfected with GFP-TDP-43, GFP-TDP-35 and GFP-TDP-25 were treated for 10 hrs with MG132 (10 µM) or for 36 hrs with Wortmannin (50 nM). (a,c) Panel shows NP-40 soluble extracts WB analysis (upper inset, 12% polyacrylamide gels) (full-length blots/gels are presented in Supplementary Figure S7), NP-40 soluble extracts FRA analysis (middle inset) (full-length blots/gels are presented in Supplementary Figure S7) and quantification of NP-40 soluble extracts FRA assay (*p < 0.05; **p < 0,01; ***p < 0.001) (lower inset); (b,d) Panel shows NP-40 insoluble extracts WB analysis (upper inset, 12% polyacrylamide gels) (full-length blots/gels are presented in Supplementary Figure S7), NP-40 insoluble extracts FRA analysis (middle inset) (full-length blots/gels are presented in Supplementary Figure S7) and quantification of NP-40 insoluble extracts FRA assay (*p < 0.05) (lower inset).
Figure 4
Figure 4
Degradative systems involvement in C2C12 with GFP-TDPs species. C2C12 were transiently transfected with GFP-TDP-43, GFP-TDP-35 and GFP-TDP-25 and were treated for 10 hrs with MG132 (10 µM) or for 36 hrs with Wortmannin (50 nM). (a,c) Panels show NP-40 soluble extracts WB analysis (upper inset, 12% polyacrylamide gels) (full-length blots/gels are presented in Supplementary Figure S8), NP-40 soluble extracts FRA analysis (middle inset) (full-length blots/gels are presented in Supplementary Figure S7) and quantification of NP-40 soluble extracts FRA assay (*p < 0.05; **p < 0,01) (lower inset); (b,d) Panels show NP-40 insoluble extracts WB analysis (upper inset, 12% polyacrylamide gels) (full-length blots/gels are presented in Supplementary Figure S7), NP-40 insoluble extracts FRA analysis (middle inset) (full-length blots/gels are presented in Supplementary Figure S7) and quantification of NP-40 insoluble extracts FRA assay (*p < 0.05; **p < 0,01) (lower inset).
Figure 5
Figure 5
Proteasome re-routing is beneficial to GFP-TDP-25 aggregation. (a) NSC34 overexpressing GFP-TDPs, and co-transfected with pCI-HA-Bag1 or pcDNA3. Left panel: NP-40 soluble extracts WB analysis (upper inset, 12% polyacrylamide gels), NP-40 soluble extracts FRA analysis (middle inset) and quantification of NP-40 soluble extracts FRA analysis (*p < 0.05 vs GFP-TDP-25 co-transfected with pcDNA3) (lower inset). Right panel: NP-40 insoluble extracts WB analysis (upper inset, 12% polyacrylamide gels), NP-40 insoluble extracts FRA analysis (middle inset) and quantification of NP-40 insoluble extracts FRA analysis (*p < 0.05 vs GFP-TDP-25 co-transfected with pcDNA3) (lower inset). (b) NSC34 overexpressing GFP-TDPs, and co-transfected with pCI-HA-Bag1 or pcDNA3 analysed with confocal microscope. 63X magnification. Green: GFP-TDPs; Red: hBag1; nuclei: DAPI. (c) C2C12 overexpressing GFP-TDPs, and co-transfected with pCI-HA-Bag1 or pcDNA3. Left panel: NP-40 soluble extracts WB analysis (upper inset, 12% polyacrylamide gels), NP-40 soluble extracts FRA analysis (middle inset) and quantification of NP-40 soluble extracts FRA analysis (**p < 0.05 vs GFP-TDP-35 co-transfected with pcDNA3) (lower inset). Right panel: NP-40 insoluble extracts WB analysis (upper inset, 12% polyacrylamide gels), NP-40 insoluble extracts FRA analysis (middle inset) and quantification of NP-40 insoluble extracts FRA analysis (*p < 0.05 vs GFP-TDP-25 co-transfected with pcDNA3). (d) C2C12 overexpressing GFP-TDPs, and co-transfected with pCI-HA-Bag1 or pcDNA3 as control vector analysed with confocal microscope. 63X magnification. Green: GFP-TDPs; Red: hBag1; nuclei: DAPI. (e) Microscope analysis of NSC34 transiently co-transfected with GFP-TDP-25 and HA-Bag1 or pcDNA3. Right panel: quantification of green fluorescence per cell (***p < 0.001 vs pcDNA3). Left panel: quantification of aggregates per cell. Small aggregates: dots composed of less than 1,000,000 pixels (***p < 0.001 vs pcDNA3). Big aggregates: dots composed of more than 1,000,000 pixels (**p < 0.01 vs pcDNA3). (f) Microscope analysis of C2C12 transiently co-transfected with GFP-TDP-25 and HA-Bag1 or pcDNA3. Right panel: quantification of green fluorescence per cell (**p < 0.01 vs pcDNA3). Left panel: quantification of aggregates per cell. Small aggregates: dots composed of less than 1,000,000 pixels. Big aggregates: dots composed of more than 1,000,000 pixels (*p < 0.05 vs pcDNA3). Full-length blots/gels are presented in Supplementary Figure S8.
Figure 6
Figure 6
HSPB8 and its co-chaperone BAG3 counteract GFP-TDP-25 aggregation in NSC34. (a) NSC34 overexpressing GFP-TDPs, and co-transfected with pCI-hHSPB8 or pcDNA3. Left panel: NP-40 soluble extracts WB analysis (upper inset, 12% polyacrylamide gels) NP-40 soluble extracts FRA analysis (middle inset) and quantification of NP-40 soluble extracts FRA analysis (**p < 0.01; ***p < 0.001 vs relative GFP-TDPs co-transfected with pcDNA3) (lower inset). Right panel: NP-40 insoluble extracts WB analysis (upper inset, 12% polyacrylamide gels), NP-40 insoluble extracts FRA analysis (middle inset) and quantification of NP-40 insoluble extracts FRA analysis (***p < 0.001 vs GFP-TDP-25 co-transfected with pcDNA3) (lower inset). (b) NSC34 overexpressing GFP-TDPs, and co-transfected with pCI-hHSPB8 or pcDNA3 analysed with confocal microscope. 63X magnification. Green: GFP-TDPs; Red: hHSPB8; nuclei: DAPI. (c) NSC34 overexpressing GFP-TDPs, and co-transfected with pCI-6xHis-Bag3 or pcDNA3. Left panel: NP-40 soluble extracts WB analysis (upper inset, 12% polyacrylamide gels), NP-40 soluble extracts FRA analysis (middle inset) and quantification of NP-40 soluble extracts FRA analysis (*p < 0.05 vs GFP-TDP-25 co-transfected with pcDNA3) (lower inset). Right panel: NP-40 insoluble extracts WB analysis (upper inset, 12% polyacrylamide gels), NP-40 insoluble extracts FRA analysis (middle inset) and quantification of NP-40 insoluble extracts FRA analysis (*p < 0.05 vs GFP-TDP-25 co-transfected with pcDNA3) (lower inset). (d) NSC34 overexpressing GFP-TDPs, and co-transfected with pCI-6xHis-Bag3 or pcDNA3 analysed with confocal microscope. 63X magnification. Green: GFP-TDPs; Red: hBAG3; nuclei: DAPI. (e) Microscope analysis of NSC34 co-transfected with GFP-TDP-25 and pCI-hHSPB8 or pcDNA3. Right panel: quantification of green fluorescence per cell (***p < 0.001 vs pcDNA3). Left panel: quantification of aggregates per cell. Small aggregates: dots composed of less than 1,000,000 pixels (***p < 0.001 vs pcDNA3). Big aggregates: dots composed of more than 1,000,000 pixels (***p < 0.001 vs pcDNA3). (f) Microscope analysis of NSC34 co-transfected with GFP-TDP-25 and pCI-6xHis-Bag3 or pcDNA3. Right panel: quantification of green fluorescence per cell (***p < 0.001 vs pcDNA3). Left panel: quantification of aggregates per cell. Small aggregates: dots composed of less than 1,000,000 pixels (***p < 0.001 vs pcDNA3). Big aggregates: dots composed of more than 1,000,000 pixels (***p < 0.001 vs pcDNA3). Full-length blots/gels are presented in Supplementary Figure S9.
Figure 7
Figure 7
HSPB8 and BAG3 overexpression counteracted GFP-TDP-25 accumulation in C2C12. (a) C2C12 transiently overexpressing GFP-TDPs, and co-transfected with pCI-hHSPB8 or pcDNA3. Left panel: NP-40 soluble extracts WB analysis (upper inset, 12% polyacrylamide gels), NP-40 soluble extracts FRA analysis (middle inset) and quantification of NP-40 soluble extracts FRA analysis (**p < 0.01 vs GFP-TDP-25 co-transfected with pcDNA3) (lower inset). Right panel: NP-40 insoluble extracts WB analysis (upper inset, 12% polyacrylamide gels), NP-40 insoluble extracts FRA analysis (middle inset) and quantification of NP-40 insoluble extracts FRA analysis (**p < 0.01; ***p < 0,001 vs relative GFP-TDPs co-transfected with pcDNA3). (b) C2C12 transiently overexpressing GFP-TDPs, and co-transfected with pCI-hHSPB8 or pcDNA3 as control vector analysed with confocal microscope. 63X magnification. Green: GFP-TDPs; Red: hHSPB8; nuclei staining: DAPI. (c) C2C12 transiently overexpressing GFP-TDPs, and co-transfected with pCI-6xHis-Bag3 or pcDNA3. Left panel: NP-40 soluble extracts WB analysis (upper inset, 12% polyacrylamide gels), NP-40 soluble extracts FRA analysis (middle inset) and quantification of NP-40 soluble extracts FRA analysis (***p < 0.001 vs GFP-TDP-25 co-transfected with pcDNA3) (lower inset). Right panel: NP-40 insoluble extracts WB analysis (upper inset, 12% polyacrylamide gels), NP-40 insoluble extracts FRA analysis (middle inset) and quantification of NP-40 insoluble extracts FRA analysis (*p < 0.05 vs GFP-TDP-25 co-transfected with pcDNA3). (d) C2C12 transiently overexpressing GFP-TDPs, and co-transfected with pCI-6xHis-Bag3 or pcDNA3 analysed with confocal microscope. 63X magnification. Green: GFP-TDPs; Red: hBAG3; nuclei: DAPI. (e) Microscope analysis of C2C12 co-transfected with GFP-TDP-25 and pCI-hHSPB8 or pcDNA3. Right panel: quantification of green fluorescence per cell (***p < 0.001 vs pcDNA3). Left panel: quantification of aggregates per cell. Small aggregates: dots composed of less than 1,000,000 pixels (***p < 0.001 vs pcDNA3). Big aggregates: dots composed of more than 1,000,000 pixels. (f) Microscope analysis of C2C12 co-transfected with GFP-TDP-25 and pCI-6xHis-Bag3 or pcDNA3. Right panel: quantification of green fluorescence per cell (**p < 0.001 vs pcDNA3). Left panel: quantification of aggregates per cell. Small aggregates: dots composed of less than 1,000,000 pixels (***p < 0.001 vs pcDNA3). Big aggregates: dots composed of more than 1,000,000 pixels. Full-length blots/gels are presented in Supplementary Figure S11.

References

    1. White MA, Sreedharan J. Amyotrophic lateral sclerosis: recent genetic highlights. Curr Op Neurol. 2016;29:557–564. doi: 10.1097/WCO.0000000000000367. - DOI - PubMed
    1. Taylor JP, Brown RH, Jr., Cleveland DW. Decoding ALS: from genes to mechanism. Nature. 2016;539:197–206. doi: 10.1038/nature20413. - DOI - PMC - PubMed
    1. Robberecht W, Philips T. The changing scene of amyotrophic lateral sclerosis. Nature Rev Neurosci. 2013;14:248–264. doi: 10.1038/nrn3430. - DOI - PubMed
    1. Arai, T. et al. TDP-43 is a component of ubiquitin-positive tau-negative inclusions in frontotemporal lobar degeneration and amyotrophic lateral sclerosis. Biochem Biophys Res Comm351, 602–611, 10.1016/j.bbrc.2006.10.093 (2006). - PubMed
    1. Neumann M, et al. Ubiquitinated TDP-43 in frontotemporal lobar degeneration and amyotrophic lateral sclerosis. Science. 2006;314:130–133. doi: 10.1126/science.1134108. - DOI - PubMed

Publication types

MeSH terms

Grants and funding