

Quantitative prediction of long-term molecular response in TKI-treated CML - Lessons from an imatinib versus dasatinib comparison
- PMID: 30120281
- PMCID: PMC6098052
- DOI: 10.1038/s41598-018-29923-4
Quantitative prediction of long-term molecular response in TKI-treated CML - Lessons from an imatinib versus dasatinib comparison
Abstract
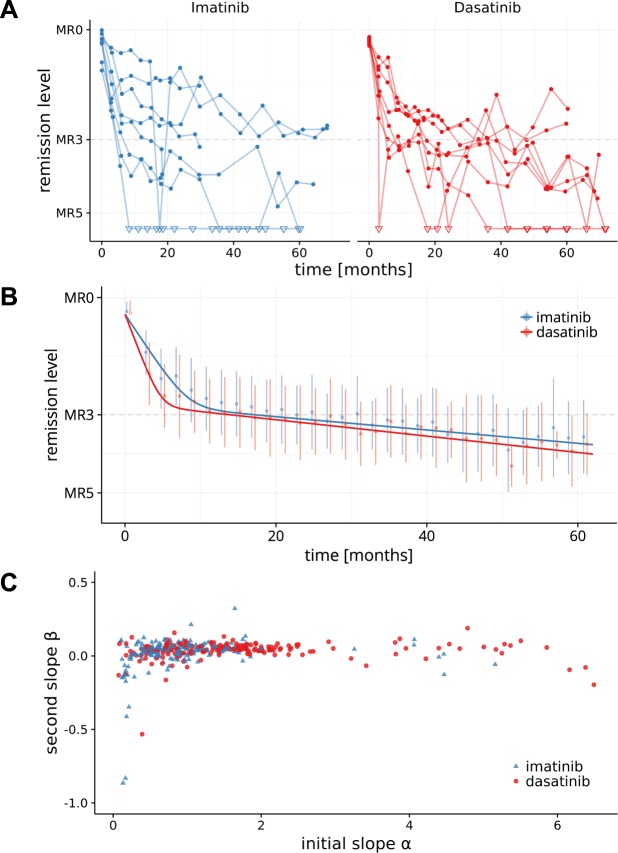
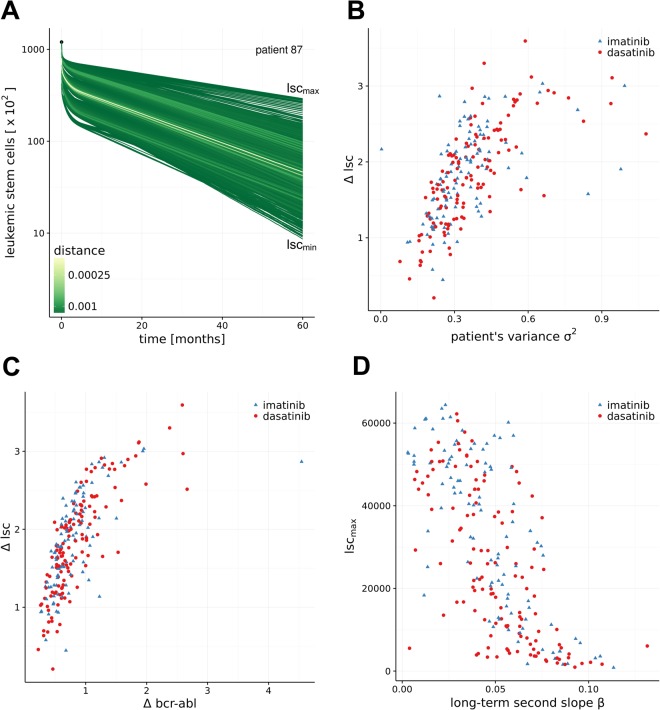
Longitudinal monitoring of BCR-ABL transcript levels in peripheral blood of CML patients treated with tyrosine kinase inhibitors (TKI) revealed a typical biphasic response. Although second generation TKIs like dasatinib proved more efficient in achieving molecular remission compared to first generation TKI imatinib, it is unclear how individual responses differ between the drugs and whether mechanisms of drug action can be deduced from the dynamic data. We use time courses from the DASISION trial to address statistical differences in the dynamic response between first line imatinib vs. dasatinib treatment cohorts and we analyze differences between the cohorts by fitting an established mathematical model of functional CML treatment to individual time courses. On average, dasatinib-treated patients show a steeper initial response, while the long-term response only marginally differed between the treatments. Supplementing each patient time course with a corresponding confidence region, we illustrate the consequences of the uncertainty estimate for the underlying mechanisms of CML remission. Our model suggests that the observed BCR-ABL dynamics may result from different, underlying stem cell dynamics. These results illustrate that the perception and description of CML treatment response as a dynamic process on the level of individual patients is a prerequisite for reliable patient-specific response predictions and treatment optimizations.
Trial registration: ClinicalTrials.gov NCT00481247.
Conflict of interest statement
The authors declare the following competing interests: I.G. travel and research funding by BMS, A.R. BMS employee and stock owner, X.W. BMS employee and stock owner, I.R. honorarium, travel and research funding by BMS. M.K., C.B., T.R., P.S. and H.L. declare no competing interests.
Figures
Similar articles
-
The Impact of Tyrosine Kinase Inhibitors on Chronic Myeloid Leukemia Stem Cells and the Implication in Discontinuation.Stem Cells Dev. 2019 Nov 15;28(22):1480-1485. doi: 10.1089/scd.2019.0117. Epub 2019 Oct 22. Stem Cells Dev. 2019. PMID: 31530245
-
Dasatinib rapidly induces deep molecular response in chronic-phase chronic myeloid leukemia patients who achieved major molecular response with detectable levels of BCR-ABL1 transcripts by imatinib therapy.Int J Clin Oncol. 2017 Oct;22(5):972-979. doi: 10.1007/s10147-017-1141-y. Epub 2017 May 26. Int J Clin Oncol. 2017. PMID: 28550414 Free PMC article. Clinical Trial.
-
NKG2A Down-Regulation by Dasatinib Enhances Natural Killer Cytotoxicity and Accelerates Effective Treatment Responses in Patients With Chronic Myeloid Leukemia.Front Immunol. 2019 Jan 17;9:3152. doi: 10.3389/fimmu.2018.03152. eCollection 2018. Front Immunol. 2019. PMID: 30705677 Free PMC article.
-
Treatment-free remission with first- and second-generation tyrosine kinase inhibitors.Am J Hematol. 2019 Mar;94(3):346-357. doi: 10.1002/ajh.25342. Epub 2018 Nov 25. Am J Hematol. 2019. PMID: 30394563 Free PMC article. Review.
-
[Research advance on molecular genetics of CML blast crisis].Zhongguo Shi Yan Xue Ye Xue Za Zhi. 2008 Feb;16(1):217-21. Zhongguo Shi Yan Xue Ye Xue Za Zhi. 2008. PMID: 18315935 Review. Chinese.
Cited by
-
Identification of key microRNAs as predictive biomarkers of Nilotinib response in chronic myeloid leukemia: a sub-analysis of the ENESTxtnd clinical trial.Leukemia. 2022 Oct;36(10):2443-2452. doi: 10.1038/s41375-022-01680-4. Epub 2022 Aug 23. Leukemia. 2022. PMID: 35999259 Clinical Trial.
-
Continuous therapy response references for BCR::ABL1 monitoring in pediatric chronic myeloid leukemia.Sci Rep. 2023 Oct 24;13(1):18199. doi: 10.1038/s41598-023-45364-0. Sci Rep. 2023. PMID: 37875583 Free PMC article.
-
Differential response to cytotoxic therapy explains treatment dynamics of acute myeloid leukaemia patients: insights from a mathematical modelling approach.J R Soc Interface. 2020 Sep;17(170):20200091. doi: 10.1098/rsif.2020.0091. Epub 2020 Sep 9. J R Soc Interface. 2020. PMID: 32900301 Free PMC article.
-
Dasatinib vs. imatinib in patients with chronic myeloid leukemia in chronic phase (CML-CP) who have not achieved an optimal response to 3 months of imatinib therapy: the DASCERN randomized study.Leukemia. 2020 Aug;34(8):2064-2073. doi: 10.1038/s41375-020-0805-1. Epub 2020 Apr 7. Leukemia. 2020. PMID: 32265500 Free PMC article. Clinical Trial.
-
Gene Expression Pattern of ESPL1, PTTG1 and PTTG1IP Can Potentially Predict Response to TKI First-Line Treatment of Patients with Newly Diagnosed CML.Cancers (Basel). 2023 May 8;15(9):2652. doi: 10.3390/cancers15092652. Cancers (Basel). 2023. PMID: 37174118 Free PMC article.
References
-
- Rosti, G., Castagnetti, F., Gugliotta, G. & Baccarani, M. Tyrosine kinase inhibitors in chronic myeloid leukaemia: which, when, for whom? Nat Rev Clin Oncol, 10.1038/nrclinonc.2016.139 (2016). - PubMed
Publication types
MeSH terms
Substances
Associated data
LinkOut - more resources
Full Text Sources
Other Literature Sources
Medical
Miscellaneous
