. 2019 Jan;38(3):421-444.
doi: 10.1038/s41388-018-0450-6. Epub 2018 Aug 17.

The miR-96 and RARγ signaling axis governs androgen signaling and prostate cancer progression

Affiliations

The miR-96 and RARγ signaling axis governs androgen signaling and prostate cancer progression

Mark D Long et al. Oncogene. 2019 Jan.

Abstract

Expression levels of retinoic acid receptor gamma (NR1B3/RARG, encodes RARγ) are commonly reduced in prostate cancer (PCa). Therefore, we sought to establish the cellular and gene regulatory consequences of reduced RARγ expression, and determine RARγ regulatory mechanisms. RARG shRNA approaches in non-malignant (RWPE-1 and HPr1-AR) and malignant (LNCaP) prostate models revealed that reducing RARγ levels, rather than adding exogenous retinoid ligand, had the greatest impact on prostate cell viability and gene expression. ChIP-Seq defined the RARγ cistrome, which was significantly enriched at active enhancers associated with AR binding sites. Reflecting a significant genomic role for RARγ to regulate androgen signaling, RARγ knockdown in HPr1-AR cells significantly regulated the magnitude of the AR transcriptome. RARγ downregulation was explained by increased miR-96 in PCa cell and mouse models, and TCGA PCa cohorts. Biochemical approaches confirmed that miR-96 directly regulated RARγ expression and function. Capture of the miR-96 targetome by biotin-miR-96 identified that RARγ and a number of RARγ interacting co-factors including TACC1 were all targeted by miR-96, and expression of these genes were prominently altered, positively and negatively, in the TCGA-PRAD cohort. Differential gene expression analyses between tumors in the TCGA-PRAD cohort with lower quartile expression levels of RARG and TACC1 and upper quartile miR-96, compared to the reverse, identified a gene network including several RARγ target genes (e.g., SOX15) that significantly associated with worse disease-free survival (hazard ratio 2.23, 95% CI 1.58 to 2.88, p = 0.015). In summary, miR-96 targets a RARγ network to govern AR signaling, PCa progression and disease outcome.


Conflict of interest statement

The authors declare that they have no conflict of interest.

Figures
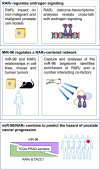
Fig. 1
Fig. 1
The workflow for investigating the consequences of altered RARγ expression in cell line, murine and human prostate cells, and how miR-96 regulates RARγ to drive aggressive prostate cancer
Fig. 2
Fig. 2
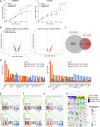
Stable knockdown of RARγ in prostate cell lines. RWPE-1 (a, b) and LNCaP (c, d) cells were each stably transfected with two shRNA constructs targeting RARG. a Validation of RARG knockdown, and unaltered expression of RARA and RARB mRNA and b RARγ protein levels in RWPE-1-shCTL and RWPE-1-shRARG cells. c, d Similar validation results are shown for LNCaP-shCTL and LNCaP-shRARG cells. Significance of difference between shRARG and shCTL cells are noted (**p < 0.01, ***p < 0.001)
Fig. 3
Fig. 3
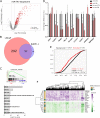
RARγ expression levels impact cell viability and gene expression in prostate cells. a Time-dependent measurements of cellular levels of ATP, as an indicator of cell viability, of each of the stable shRARG clones compared to vector controls in RWPE-1 (left) and LNCaP (right) cells. Each measurement was performed in biological triplicate, in triplicate wells. Significance of differences between viability of control and RARγ knockdown cells at the end of each study is noted. b Cells were treated in triplicate with CD437 (RWPE-1, 10 nM; LNCaP, 250 nM, 24 h) or DMSO vehicle control and gene expression was profiled using Illumina microarray (Illumina HT12v4) using DESeq2. Volcano plots depicting expression changes upon RARγ knockdown or in response to exogenous RARγ specific ligand (CD437) in RWPE-1 cells. Dotted lines indicate DEG thresholds (p.adj < 0.05, fold change of ±1.2), and red dots represent RARγ-dependent DEGs. Genes regulated by exogenous ligand were calculated as those that were differentially expressed in shCTL cells treated with ligand (shCTL+CD437/shCTL-DMSO) and not in shRARG cells treated with CD437. c Venn diagram depicting number of determined DEGs associated with reducing RARγ expression levels, and those from adding exogenous ligand. d Summary of significantly enriched pathways from gene set enrichment analyses (GSEA) (NES > 1.8, FDR q.val < 0.05) associated with reducing RARγ expression levels, and those from adding exogenous ligand in RWPE-1 (left) and LNCaP (right) cells. The top enriched meta-groups among significant GSEA sets are indicated. e, f Examples of top significant GSEA pathway enrichments observed in RWPE-1 cells and g in LNCaP cells. h Heatmap depicting the relative expression of a panel of androgen response genes defined previously by the TCGA consortium to reflect AR signaling [61]. Unsupervised hierarchical clustering of the gene expression patterns of these AR-regulated genes separated shRARG from shCTL cells
Fig. 4
Fig. 4
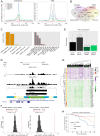
The RARγ cistrome is enriched at active enhancers of genes that are also enriched for androgen receptor binding and associate with aggressive prostate cancer. Stable transfection of a bacterial artificial chromosome containing a fusion RARG-EGFP gene transcribed from the endogenous RARG promoter was undertaken to generate RWPE-1-RARG-EGFP clones. Stably expressing RARγ-EGFP RWPE-1 cells were treated in triplicate with either CD437 (10 nM, 2 h) or vehicle (DMSO), and subjected to ChIP-Seq undertaken with an EGFP antibody. a Significant RARγ ChIP-seq peaks (p.adj < 0.1) were determined with Rsubread and csaw. Cross-profiling of significant RARγ ChIP-seq peaks and the indicated histone modifications also from RWPE-1 (GSE63094) at genomic loci performed using annotatePeaks available from the HOMER (Hypergeometric Optimization of Motif EnRichment) suite. Genomic profiles are centered at enhancer regions (overlapping of H3K27ac and H3K4me1) (left), and TSS loci of all expressed genes in RWPE-1 (right). b Overlap of unstimulated RARγ binding peaks with select publicly available epigenetic data sets from RWPE-1 cells was determined with ChIPpeakAnno using a maximum gap of 500 bp; H3K4me1 and H3K27ac (GSE63094) and DNase sensitivity (GSM1541008). c The negative log10(p values) of the overlaps between data sets determined with ChIPpeakAnno were visualized for RARγ binding peaks and a wider panel of publicly available data; prostate enhancers (FANTOM), LNCaP AR (GSE48308), VCaP AR (GSE84432), ERα (GSE43985) and LNCaP NF-κB (GSE83860) cistromes. d Representative RARγ binding site upstream of the KRT15 TSS showing coincident binding with H3K4me1 and H3K27ac in RWPE-1 cells. The ChromHMM (grass green = low transcription; bright green = active enhancer; red = transcriptional enhancer; blue = active TSS; pale yellow = poised transcription; yellow = poised enhancer), CpG island and DNase sensitivity tracks are also shown. e The impact of RARγ knockdown on KRT15 expression from expression profiling in RWPE-1 cells by microarray (Fig. 1). f Bootstrapping approach (using boot) to test the statistical strength of relationships between genes annotated to be bound by RARγ (±7.5 kb from the TSS) and those modulated by RARγ knockdown (left) or in the presence of CD437 ligand (right) in RWPE-1 cells. The red line is the mean observed fold change for the indicated gene set derived from the microarray data (Fig. 1) and the distribution is simulated data from the same dataset. The significance between the observed and simulated expression of the same number of genes is indicated. g Expression heatmap of annotated RARγ cistrome genes in the TCGA-PRAD cohort (pheatmap). Genes were filtered to identify those that were altered by more than ±2 Z scores in 35% of tumors relative to normal samples. Unsupervised hierarchical clustering grouped tumors that significantly distinguished higher Gleason Grade (Gleason > 7), after adjusting for age (Pearson’s Chi-squared test X2 = 51.187, df = 35). For each gene, Kaplan–Meier curves (survival) were generated as time to tumor recurrence, indicated by biochemical progression, and those genes which identify significantly (p.adj < 0.1) shorter disease-free survival are indicated. h Illustrative Kaplan–Meier curve for CYP11A1 expression depicting the significantly reduced time to 5-year biochemical recurrence post radical prostatectomy
Fig. 5
Fig. 5
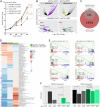
RARγ governs androgen-induced responses in non-malignant HPr1-AR prostate epithelial cells. HPr1-AR cells were stable transfected with shRNA to RARG and the response to DHT measured. a Cell viability of HPr1-AR-shCTL and HPr1-AR-shRARG cells in the absence or presence of 10 nM DHT was measured for up to 96 h. Significance of differences between triplicate experiments between viability of indicated experimental groups at the end of the study is noted. b HPr1-AR-shCTL and HPr1-AR-shRARG cells were treated in triplicate with DHT or vehicle control for 24 h and gene expression profiled via RNA-seq and analyzed with Rsubread/DESeq2. Volcano plot depicting DHT-induced gene expression changes in HPr1-AR-shCTL cells (top). Highlighted genes represent those that display induction (purple) or repression (green) in response to DHT in HPr1-AR-shCTL expression, and which were significantly dampened in HPr1-AR-shRARG cells (bottom); 6 genes are labeled that had the greatest magnitude of dampened response, including a loss in induction of TMEM37 and a loss of repression of FGFBP1. c Venn diagram representing the number of DEGs determined after DHT treatment in HPr1-AR-shCTL and HPr1-AR-shRARG cells. Specifically, 1454 of the 2309 (63.0%, hypergeometric p value < 2e−16) DHT-regulated DEGs were either significantly less induced or had significantly reduced repression in shRARG cells. d Heatmap depicting normalized enrichment scores (NES) of all enriched pathways related to DHT treatment in different comparisons (NES > 1.8, FDR q-value < 0.05). Select meta-groups from keyword enrichment analysis are depicted. e Example of top significantly upregulated (left) and downregulated (right) GSEA pathways upon DHT treatment. Enrichments are shown for each comparison, as well as (f) an expression profile of a representative gene from each gene set (left, TMEM37, right TFB2M)
Fig. 6
Fig. 6
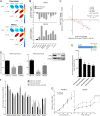
MicroRNA-96 directly targets and regulates RARG in prostate cells. a Cross-correlation matrices depicting the relationships between RARG and miR-96 cluster member expression in PCa samples from MSKCC and TCGA-PRAD cohorts (corrplot). b Relative expression of miR-96 (bottom) and RARG (top) across 10 prostate cell lines representing different stages of PCa progression. The cell models examined comprised immortalized RWPE-1 and HPr1-AR non-malignant prostate epithelial cells, LNCaP, LAPC4 and EAA006 androgen-sensitive PCa cells, MDAPCa2b, 22Rv1 and LNCaP-C42 CRPC cells, as well as PC3 and DU145 cells derived from distant metastases. c Correlation analyses of RARG with miR-96 expression over the course of palpable tumor (PT) development in TRAMP. The strength and significance of the correlation is indicated. Tumors from 5 mice were examined at each time point and compared to the mean of 10 6-week-old wild-type mice; 2 6-week tumors were dropped due to technical failure to generate high-quality RNA. d RARG mRNA (left) and RARγ protein expression (right) in RWPE-1 cells after 48 h of transfections with miR-96 mimics or siRNA targeting RARG. Significance of difference between targeting and control cells are noted (*p < 0.05). e Luciferase assay assessing direct targeting of miR-96 to the full-length (FL) RARG 3′UTR or individual predicted target sites (t1, t2) within the RARG 3′UTR. Either miR-96 or miR-CTL mimics (30 nM) were transfected into RWPE-1 cells for 48 h along with indicated RSV-pGL3 constructs and pRL-CMV Renilla luciferase expressing vectors, and luciferase activity measured by Dual-Glo Luciferase Assay System in triplicate. Significance of difference between luciferase construct with and without RARG 3′UTR sequences cells are noted (*p < 0.05). f RWPE-1 cells were pretreated with miR-CTL, miR-96 mimic (30 nM), or combination of miR-96 mimic and antagomiR-96 for 48 h prior to CD437 exposure (10 nM) for 24 h, and candidate transcripts measured by RT-qPCR in triplicate. Induction relative to untreated control for each condition is shown, and significance of CD437 induction/repression between miR-CTL and miR-96 groups are indicated (*p < 0.05). g Cell viability of RWPE-1 (left) and LNCaP (right) cells for up to 120 h post transfection with either miR-96 or non-targeting control (NC) mimics was measured in triplicate. Significance of differences between viability of indicated experimental groups at the end of the study is noted
Fig. 7
Fig. 7
The miR-96 targetome centers on a RARγ network. a LNCaP cells were transfected in triplicate with bi-miR-96 or bi-cel-miR-67 (non-targeting control, bi-miR-CTL) (30 nM) for 24 h prior to cell lysis. Input (5% of cell lysate) and streptavidin pulldown RNAs were isolated and analyzed by Illumina microarray (Illumina HT12v4) (DESeq2). Volcano plot depicting the enrichment of all genes in bi-miR-96 pulldown over input in LNCaP cells. Genes marked in red (n = 389) were considered experimentally determined miR-96 direct targets, as they were significantly enriched (FC > 1.2, p.adj < 0.05) in bi-miR-96 pulldown but not in bi-miR-CTL pulldown. b Venn diagram representing the overlap of miR-96 targetomes in LNCaP and RWPE-1 cells. c The top significantly enriched GSEA pathway from unbiased enrichment analysis of bi-miR-96 samples in LNCaP cells (pulldown/input) (top), and summary of top miRNA seed sequence matches in 3′UTR regions of experimentally determined miR-96 targets using the GSEA-MSigDB microRNA targets tool (bottom). d Either bi-miR-96 or non-biotinylated miR-96 mimics or respective control mimics were transfected (30 nM) in LNCaP cells for 48 h and target gene expression examined in triplicate. CDH1 was assessed as a negative control, and specific targets were chosen as they were either previously validated (FOXO1, RARG) and/or were significantly enriched in bi-miR-96 pulldown profiling. Significance of difference in target transcript level between biotinylated and non-biotinylated miR-96 relative to respective controls is noted (*p < 0.05). e Cumulative distribution plot comparing the correlations (Pearson’s r) between miR-96 and all detectable genes from bi-miR-pulldown assay (n = 10,827, black) in TCGA-PRAD cohort samples compared to the correlations between miR-96 and identified miR-96 targets (n = 389, red) across the same samples. Significant difference between distributions is determined by Kolmogorov–Smirnov test. f Heatmap depicting expression of annotated miR-96 targetome genes in the TCGA-PRAD cohort (pheatmap). Genes were filtered to identify those genes that were altered by more than ±2 Z scores in 35% of tumors relative to normal samples. Functional relationship of identified miR-96 target genes to the previously established RARγ network are indicated
Fig. 8
Fig. 8
A miR-96/RARγ/TACC1 network associates with recurrent prostate cancer. a For each of the seven miR-96/RARγ network-associated genes (EIF4G2, ONECUT2, PRKAR1A, RARG, TACC1, YAP1, ZIC2) plus FOXA1 the Pearson's r correlation was determined against all expressed genes within upper quartile of miR-96 expressing TCGA-PRAD tumors (miR-96high, n = 123) and separately within the lower quartile (miR-96low, n = 122). Significant correlations (q-value < 0.1) were selected for those genes that were RARγ dependent in either RWPE-1 (Fig. 3) or HPr1-AR (Fig. 5). The shift in the strength of the correlation between miR-96low compared to miR-96high tumors was calculated, the correlations in miR-96low tumors are visualized indicating if the correlation was strengthened, weakened or switched direction between miR-96low compared to miR-96high. A t-test (Welch two-sample t-test) assessed the difference of the statistical strength of correlations between those that were positive and strengthened, compared to those correlations that were negative and weakened between miR-96low and miR-96high tumors. Genes that displayed the most significant change in correlation between miR-96low and miR-96high tumors are indicated in each panel. There were fewer than 50 significant correlations with ZIC2 and is omitted. b TCGA-PRAD cohort tumor samples were separated based on expression of RARγ, TACC1 and miR-96 (based on lower/upper quartile expression) to generate RARγ/TACC1low, miR-96high (n = 60) and RARγ/TACC1high, miR-96low (n = 66) tumors and differential expression undertaken. Filtering the 1728 differentially expressed genes between these tumors by Z scores as described in Fig. 7f revealed which genes were most altered in the TCGA-PRAD cohort. Unsupervised hierarchical clustering of gene expression identified a group of tumors that after adjusting for age significantly associated with worse disease-free survival (hazard ratio 2.23, 95% CI 1.58 to 2.88, p = 0.015), and also clustered high Gleason score tumors (p = 0.012) (survival). Individual genes were annotated; RARG Bound are those identified by RARγ ChIP-Seq (Fig. 4); RARG/AR are those displaying RARγ-dependent DHT regulation (Fig. 5); and enrichment in the Liu prostate cancer gene set (Liu_Down). c Representative image of the SOX15 locus, which is a RARγ-dependent AR-regulated target, is bound by RARγ and also shows a significantly stronger correlation with RARγ in miR-96low tumors relative to miR-96high tumors (a, upper panel). ChromHMM (cyan = TSS flanking; grass green = low transcription; bright green = active enhancer; red = transcriptional enhancer; blue = active TSS; pale yellow = poised transcription), CpG island, histone (GSE63094) and DNase sensitivity (GSM1541008) tracks are also shown

Comment in

Similar articles

Cited by

References

    1. Kerr JF, Wyllie AH, Currie AR. Apoptosis: a basic biological phenomenon with wide-ranging implications in tissue kinetics. Br J Cancer. 1972;26:239–57. - PMC - PubMed
    1. Malinen M, Niskanen EA, Kaikkonen MU, Palvimo JJ. Crosstalk between androgen and pro-inflammatory signaling remodels androgen receptor and NF-kappaB cistrome to reprogram the prostate cancer cell transcriptome. Nucleic Acids Res. 2017;45:619–30. - PMC - PubMed
    1. Zhang J, Gonit M, Salazar MD, Shatnawi A, Shemshedini L, Trumbly R, et al. C/EBPalpha redirects androgen receptor signaling through a unique bimodal interaction. Oncogene. 2010;29:723–38. - PMC - PubMed
    1. Olokpa E, Moss PE, Stewart LV. Crosstalk between the androgen receptor and PPAR gamma signaling pathways in the prostate. PPAR Res. 2017;2017:9456020. - PMC - PubMed
    1. Sun J, Wang Y, Li Y, Zhao G. Downregulation of PPARgamma by miR-548d-5p suppresses the adipogenic differentiation of human bone marrow mesenchymal stem cells and enhances their osteogenic potential. J Transl Med. 2014;12:168. - PMC - PubMed

Publication types

MeSH terms