

Review
doi: 10.1007/s00395-018-0696-8.
Practical guidelines for rigor and reproducibility in preclinical and clinical studies on cardioprotection
Affiliations
- PMID: 30120595
- PMCID: PMC6105267
- DOI: 10.1007/s00395-018-0696-8
Item in Clipboard
Review
Practical guidelines for rigor and reproducibility in preclinical and clinical studies on cardioprotection
Basic Res Cardiol.
.
No abstract available
Conflict of interest statement
HEB and MRS are shareholders in CellAegis Inc. PF is founder and CEO of Pharmahungary, a Group of R&D companies.
Figures
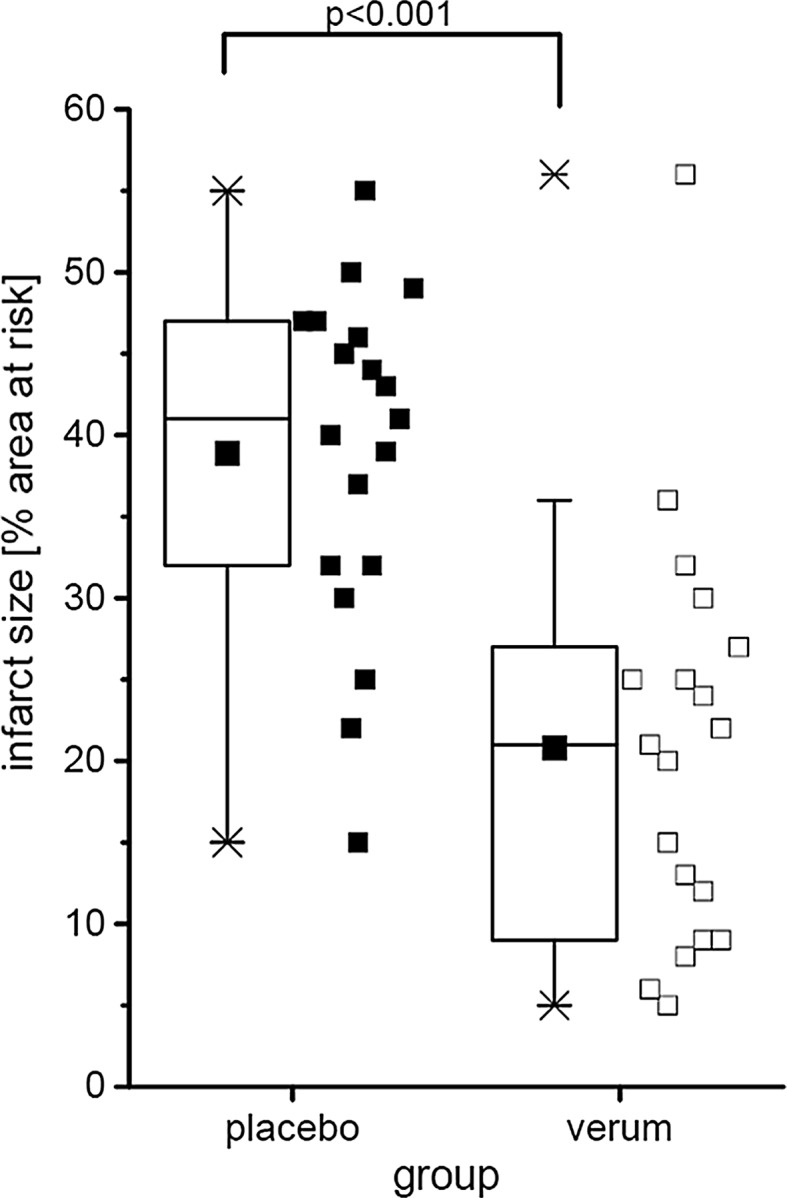
Virtually created data on infarct size as percent of area at risk. For two groups, placebo vs. verum, data are presented as minimum and maximum (crosses), interquartile range from 25 to 75% (box), mean (square), and median (line) in a box plot. The maximum value of the verum group is identified as outlier. All single values (squares) are depicted. P value as the result of a two-sided Student t test
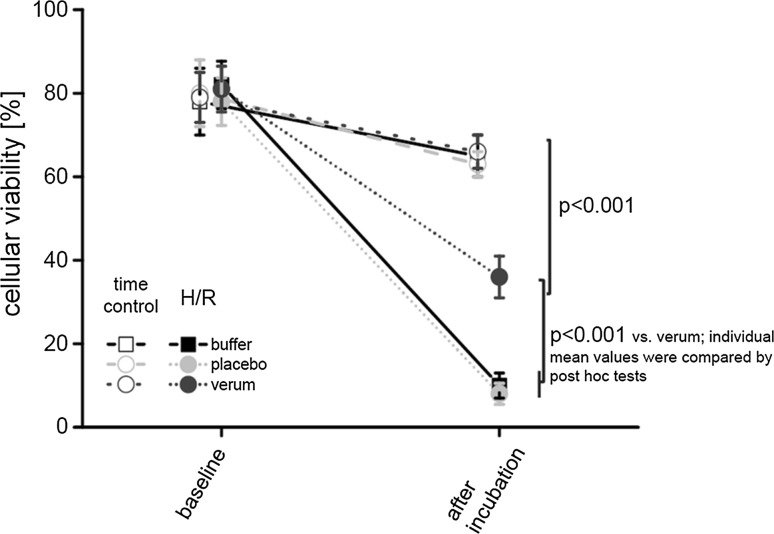
Virtually created data on cellular viability. Sequential data are analyzed throughout the time course (baseline and after incubation) of the different experimental groups (time control and hypoxia/reoxygenation (H/R) with buffer, placebo, and verum, respectively). Data are presented as mean ± standard deviation. P values as the result of two-way repeated-measures ANOVA (group, time) with subsequent post hoc tests are reported
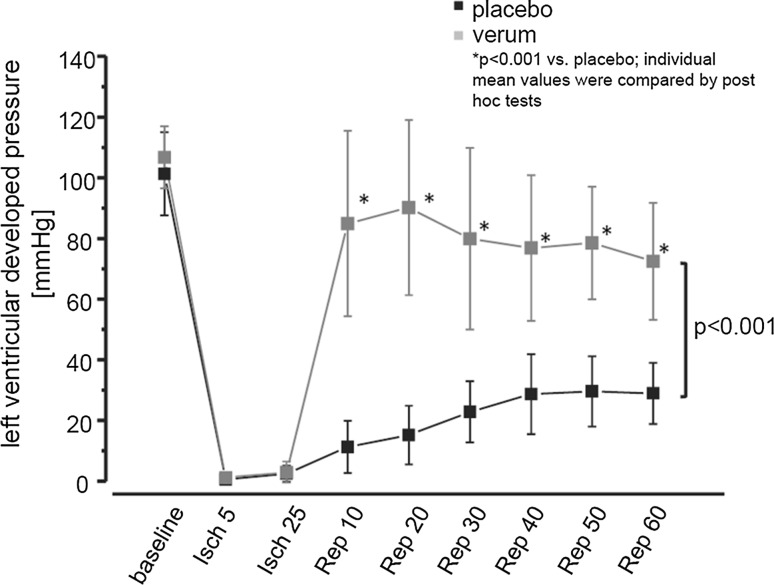
Virtually created data on left ventricular developed pressure during ischemia (Isch) and reperfusion (Rep). For two groups, placebo vs. verum, data are presented as mean ± standard deviation. P values as the result of two-way repeated-measures ANOVA (group, time) with subsequent post hoc tests are reported
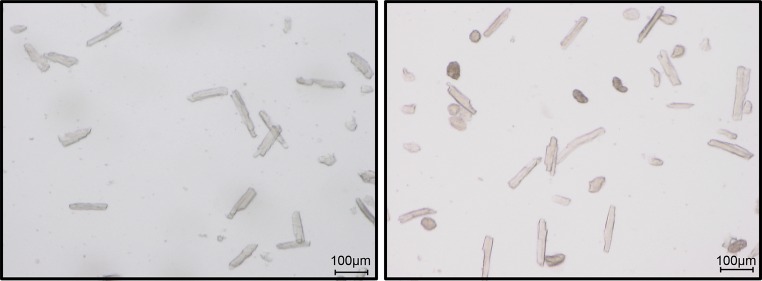
Representative figure of a good cell preparation (left) and a bad preparation (right). Please note the difference in the number of rod-shaped cells
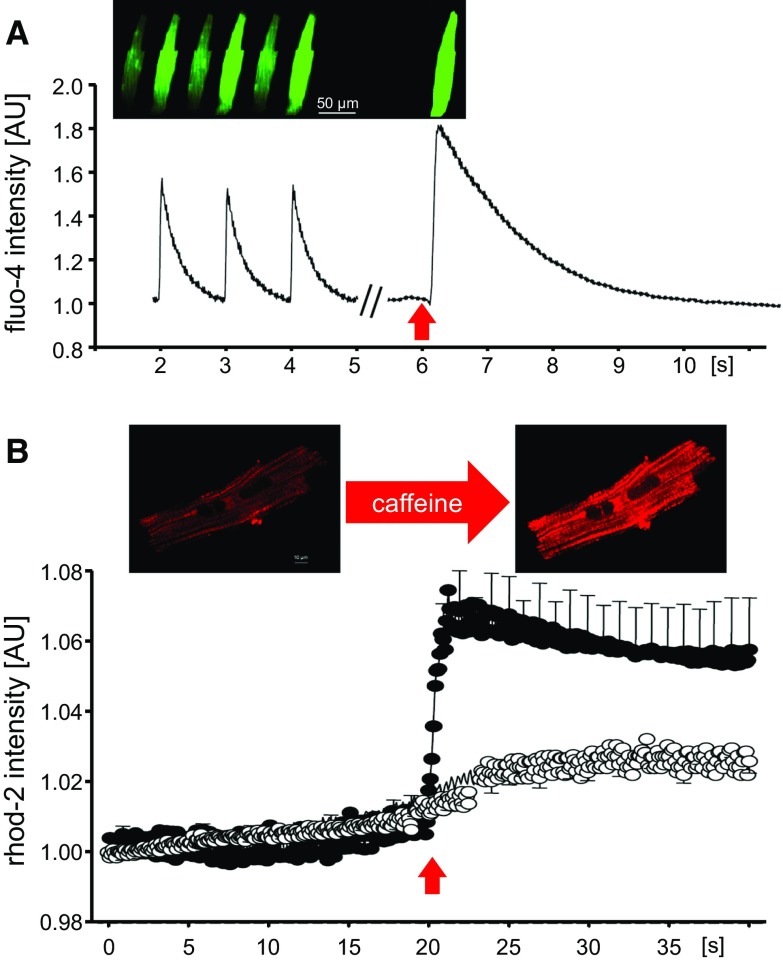
a Calcium transient recording in a fluo-4 loaded rat cardiomyocyte submitted to field stimulation (1 Hz, acquisition set at 40 images/s). After a period of stabilization, the cardiomyocyte is subjected to a single pulse of 10 mmol/L caffeine (red arrow) to induce maximal SR calcium release. The sequence of images shows diastolic and systolic calcium levels during pacing and after caffeine pulse. b Mitochondrial Ca2+ uptake throughout time in response to sarcoplasmic reticulum Ca2+ release (induced by a single pulse of 10 mmol/L caffeine, red arrow) in digitonin-permeabilized rhod-2 loaded mouse cardiomyocytes, under control conditions (black circles) or in the presence of 10 µmol/L of the mitochondrial calcium uniporter blocker Ru360 (white circles). Data correspond to mean ± standard error of the mean of n = 8 cardiomyocytes per group. Images correspond to a sarcolemmal-permeabilized cardiomyocyte loaded with rhod-2, before and after caffeine addition
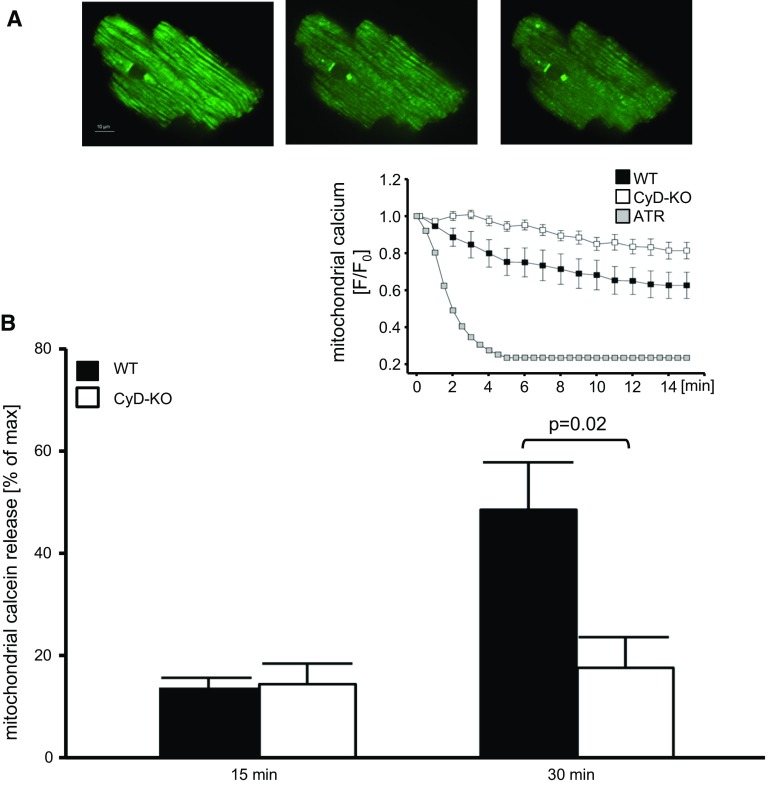
a Sequence of a calcein-loaded mouse cardiomyocyte with rigor contracture during the first 5 min of reperfusion (60 × magnification). Because calcein is entrapped in mitochondria, the decay of green fluorescence reflects mitochondrial permeabilization. b Quantification of total mitochondrial calcein release at 15 min reperfusion, with respect to maximal mitochondrial calcein release achieved after the addition of atractyloside (ATR), in isolated cardiomyocytes from wild-type (WT) and cyclophilin-D knock-out (CyD-KO) mouse hearts, previously submitted to either 15 or 25 min ischemia. The inset shows mitochondrial calcein kinetics [changes in fluorescence with respect to the initial value, F/F0)] throughout reperfusion, indicating mitochondrial permeability transition pore (mPTP) opening in the different groups of cells. Maximal mitochondrial calcein release was induced in WT cardiomyocytes treated with 20 µmol/L atractyloside. Data are expressed as mean ± SEM of 5–6 cardiomyocytes per group. Modified from [358]
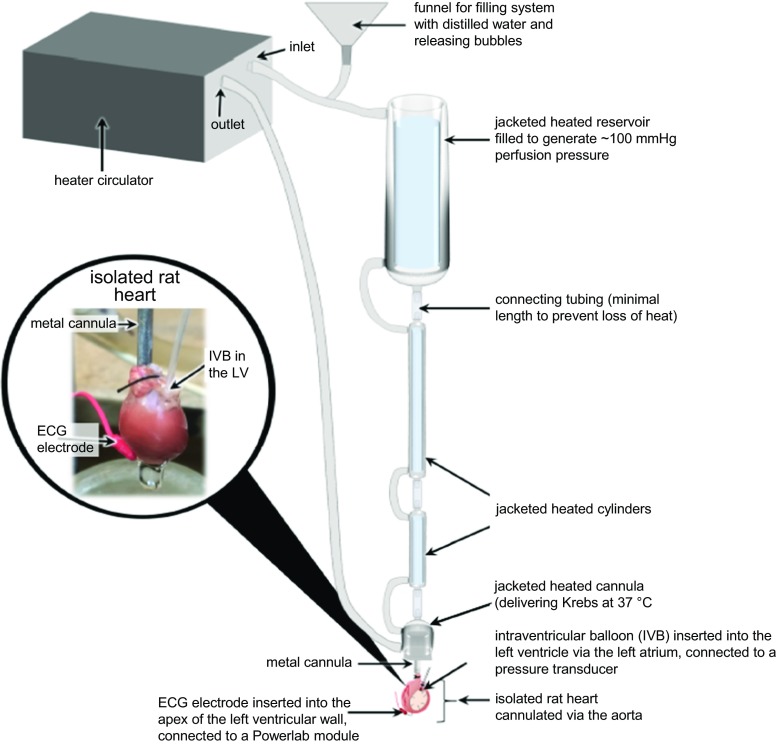
Diagram of a gravitational Langendorff perfused heart rig with an isolated rat heart
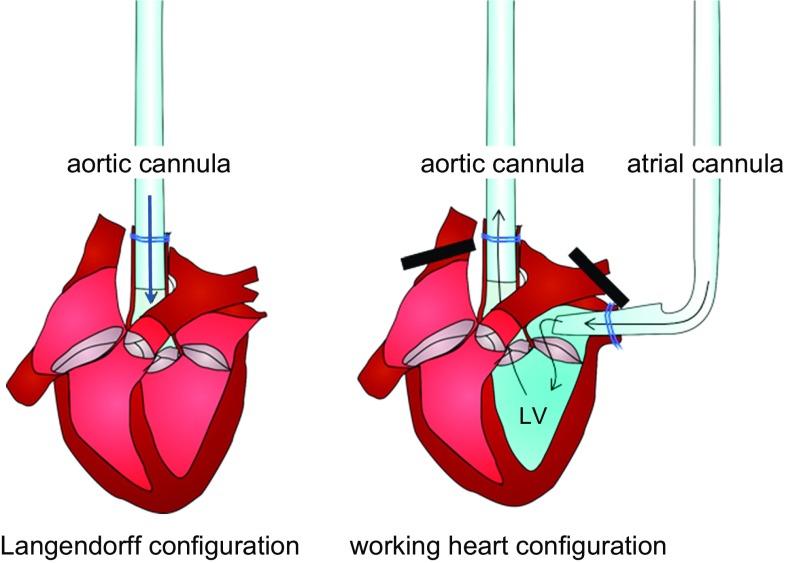
In the Langendorff configuration, buffer from the aortic cannula is prevented by the aortic valve from entering the heart, and passes instead through the coronary arteries (not shown), which originate from the base of the aorta. In the working heart configuration, buffer enters the left atrium via the atrial cannula, passes through the mitral valve to the left ventricle (LV), then is ejected during systole through the aortic valve into the aortic cannula
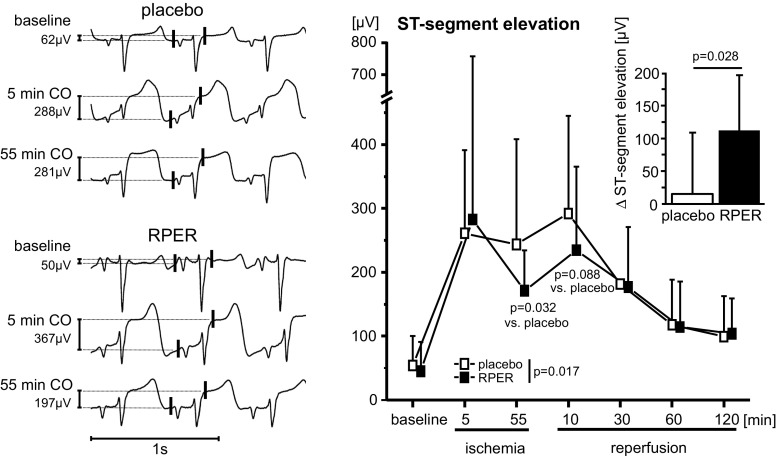
Original ECG recorded in one pig undergoing remote ischemic perconditioning (RPER) and one undergoing placebo intervention (PLA). ST-segment elevation is displayed as amplitude difference between two points (vertical red lines) 30 ms before the P wave and 20 ms after the J-point, respectively [252]
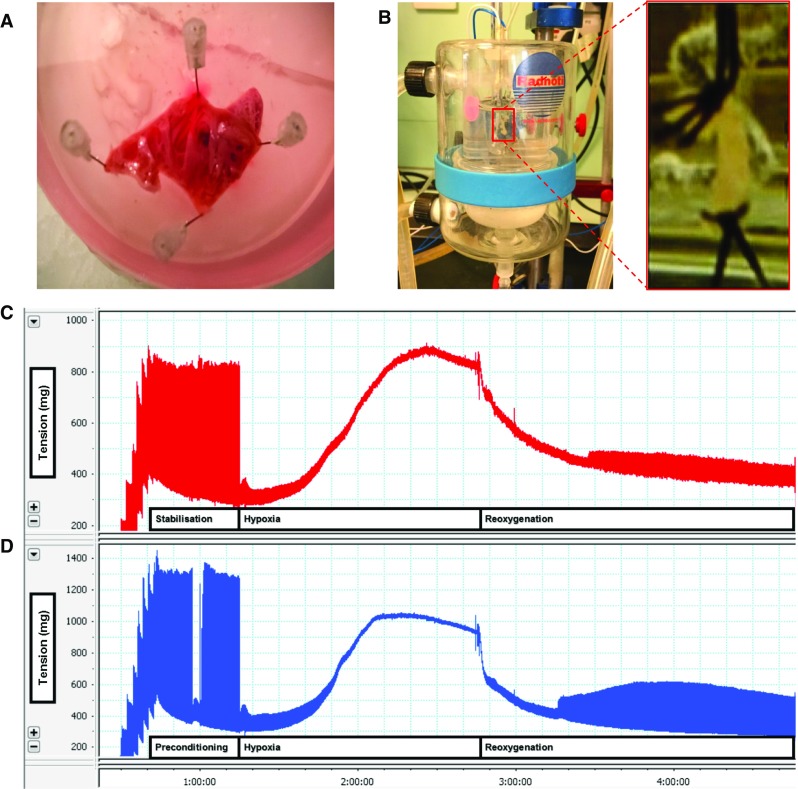
a Atrial trabeculae on the surface of the appendage being dissected. b Atrial trabecula mounted between two platinum pacing electrodes. c Functional readout from the atrial trabecula showing the change in contractile function (difference in tension) during hypoxia and reoxygenation. d The recovery of contractile function at the end of the experiment is greater in an atrial trabecula that had been preconditioned prior to hypoxia and reoxygenation
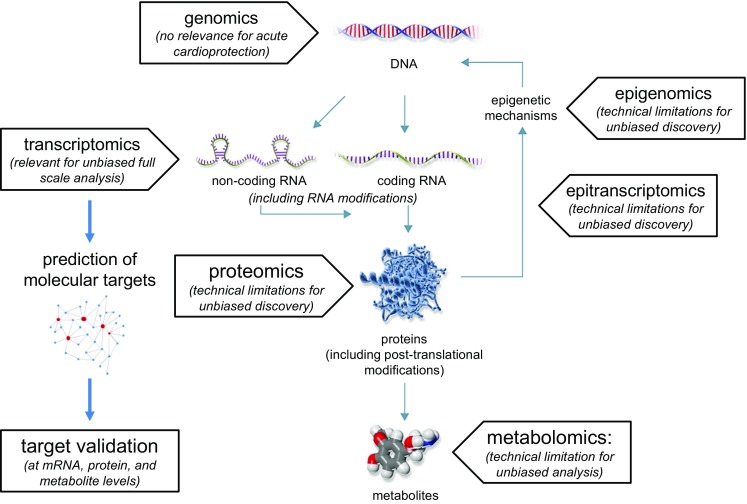
Different omics approaches from the genome to metabolome. Current technologies so far allow unbiased analysis of all genes and transcripts. Based on transcriptomic fingerprints, in silico prediction of molecular targets can be achieved. Predicted targets must always be validated at the protein level. Other omics technologies are rapidly emerging; however, their use is currently limited to assess only fractions of the total epigenetic/transcriptomic, proteomic and metabolomic pool
References
-
- (CHMP) CfMPfHU (2010) Guideline on missing data in confirmatory clinical trials. http://www.ema.europa.eu/docs/en_GB/document_library/Scientific_guidelin.... Accessed 6 Aug 2018
Publication types
MeSH terms
Substances
Grants and funding
LinkOut - more resources
Full Text Sources
Other Literature Sources
Medical
