. 2018 Nov;172(2):327-338.
doi: 10.1007/s10549-018-4889-5. Epub 2018 Aug 17.

Comparison of central laboratory assessments of ER, PR, HER2, and Ki67 by IHC/FISH and the corresponding mRNAs (ESR1, PGR, ERBB2, and MKi67) by RT-qPCR on an automated, broadly deployed diagnostic platform

Affiliations

Comparison of central laboratory assessments of ER, PR, HER2, and Ki67 by IHC/FISH and the corresponding mRNAs (ESR1, PGR, ERBB2, and MKi67) by RT-qPCR on an automated, broadly deployed diagnostic platform

Natalie C Wu et al. Breast Cancer Res Treat. 2018 Nov.

Abstract

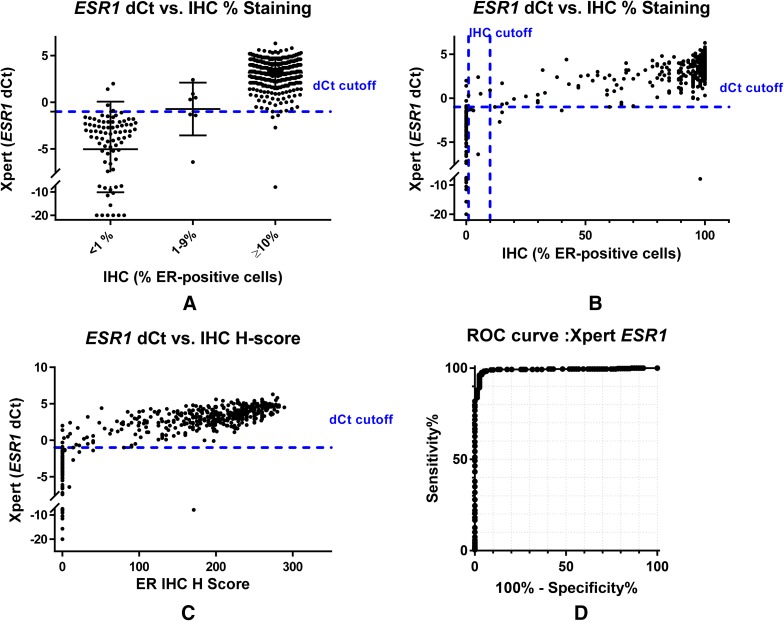
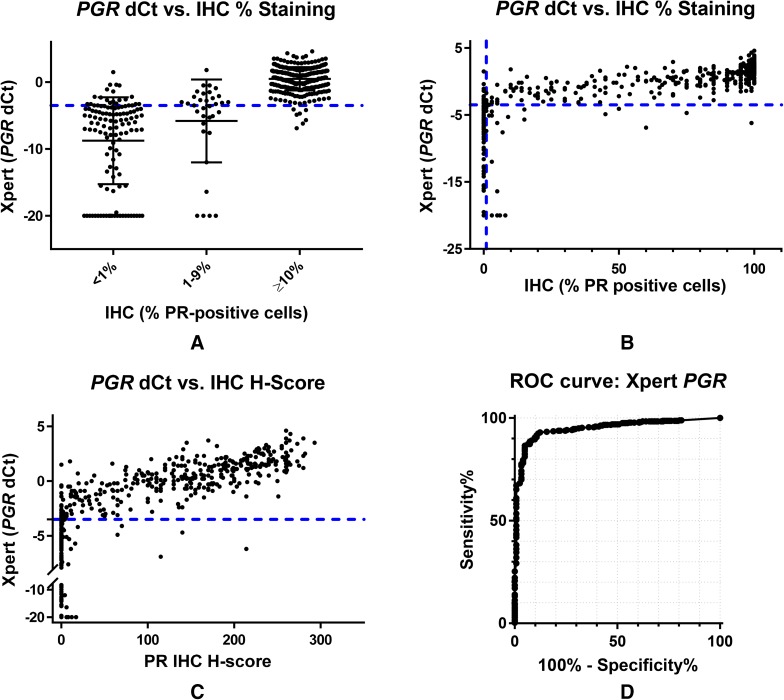
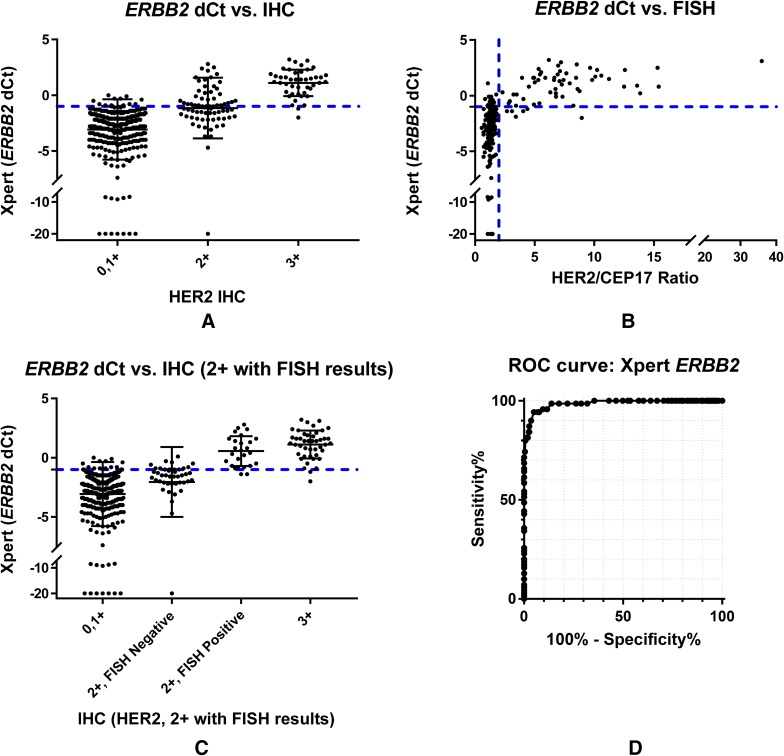
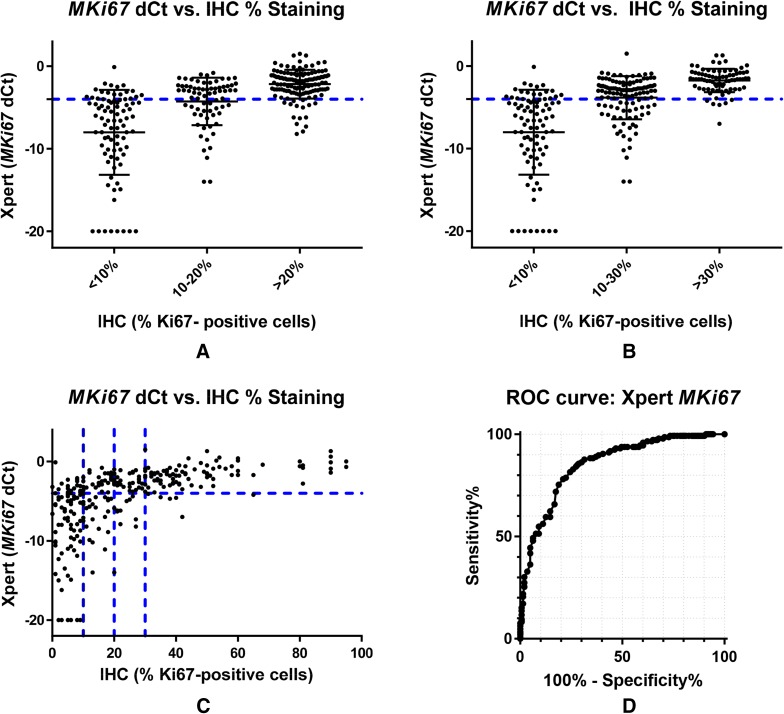
Purpose: The methods (IHC/FISH) typically used to assess ER, PR, HER2, and Ki67 in FFPE specimens from breast cancer patients are difficult to set up, perform, and standardize for use in low and middle-income countries. Use of an automated diagnostic platform (GeneXpert®) and assay (Xpert® Breast Cancer STRAT4) that employs RT-qPCR to quantitate ESR1, PGR, ERBB2, and MKi67 mRNAs from formalin-fixed, paraffin-embedded (FFPE) tissues facilitates analyses in less than 3 h. This study compares breast cancer biomarker analyses using an RT-qPCR-based platform with analyses using standard IHC and FISH for assessment of the same biomarkers.

Methods: FFPE tissue sections from 523 patients were sent to a College of American Pathologists-certified central reference laboratory to evaluate concordance between IHC/FISH and STRAT4 using the laboratory's standard of care methods. A subset of 155 FFPE specimens was tested for concordance with STRAT4 using different IHC antibodies and scoring methods.

Results: Concordance between STRAT4 and IHC was 97.8% for ESR1, 90.4% for PGR, 93.3% for ERBB2 (IHC/FISH for HER2), and 78.6% for MKi67. Receiver operating characteristic curve (ROC) area under the curve (AUC) values of 0.99, 0.95, 0.99, and 0.85 were generated for ESR1, PGR, ERBB2, and MKi67, respectively. Minor variabilities were observed depending on the IHC antibody comparator used.

Conclusion: Evaluation of breast cancer biomarker status by STRAT4 was highly concordant with central IHC/FISH in this blinded, retrospectively analyzed collection of samples. STRAT4 may provide a means to cost-effectively generate standardized diagnostic results for breast cancer patients in low- and middle-income countries.

Keywords: Breast cancer biomarker assays; Estrogen receptor; FISH; Human epidermal growth factor receptor 2; IHC; Progesterone receptor; STRAT4; Tumor proliferation rate.


Conflict of interest statement

Conflict of interest

Authors NCW, WW, KEH, VCC, and AR declared themselves to be employees of Cepheid and have received remuneration from Cepheid. Author SD declared no conflict of interest. Author DK declared no conflict of interest. Author RM declared no conflict of interest. Author JJ declared being a consultant for Bristol-Myers-Squib and G1 Therapeutics. Author RD declared no conflict of interest. Author WB declared no conflict of interest. Author BR declared no conflict of interest. Author TF declared no conflict of interest. Author JLK and MS are employees of Molecular Pathology Laboratory Network, Inc. and declared receiving remuneration from Molecular Pathology Laboratory Network, Inc. Author SC declared no conflict of interest. Author HJ declared remuneration and stock ownership from Indivumed. Authors JMW and MB declared receiving remuneration from Cepheid and stock ownership from Danaher. Author MFP declared consulting for Brogent International LLC and his institution has received research grants for his laboratory from Cepheid, Eli Lilly and Company, Novartis Pharmaceuticals Corporation, Pfizer Inc, F. Hoffmann-La Roche Ltd, and Zymeworks.

Ethical approval

All procedures performed in studies involving human participants were in accordance with the ethical standards of the respective institutional and/or national research committee and with the 1964 Helsinki declaration and its later amendments or comparable ethical standards. This article does not contain any studies with animals performed by any of the authors.

Informed consent

Informed consent was obtained from individual participants included in the study by Indivumed.

Figures

Fig. 1
Fig. 1
Comparison of estrogen receptor status determined by immunohistochemistry and RT-qPCR (STRAT4 or [STRAT4 (Xpert)]) assays. a Graph of STRAT4 ESR1 dCt values by ER IHC result categorized as negative (0%), low positive (1–9%), or positive (≥ 10%). Among ER-positive and ER-negative breast cancers according to IHC assessment, there is also a clear separation by ESR1 mRNA by RT-qPCR into high and low expression subgroups. In contrast, those breast cancers with from 1 to 9% ER-positive carcinoma cells have predominantly ESR1 mRNA quantities near the RT-qPCR cut-off separating “positive” from “negative”. b Comparison of STRAT4 ESR1 dCt values according to ER IHC % staining alone. The plot of ER IHC percentage positive tumor cell immunohistochemical staining demonstrated a strong correlation with ESR1 mRNA quantity. c Graph of STRAT4 ESR1 dCt values by ER IHC H-Score. H-Score is defined as [3(% of tumor staining 3+)] + [2(% of tumor staining 2+)] + [1(% of tumor staining 1+)]. Quantitative stratification of the IHC protein assessment by combining percentage of immunostained tumor cells with intensity of immunohistochemical staining demonstrated an improved correlation with ESR1 mRNA determined by RT-qPCR. d The ROC curve for STRAT4 ESR1 including all samples in the analysis. The area under the curve (AUC) is 0.99
Fig. 2
Fig. 2
Comparison of progesterone receptor status determined by immunohistochemistry (IHC) and RT-qPCR (STRAT4) assays. a Graph of STRAT4 PGR dCt values by PR IHC result categorized as negative (0%), low positive (1–9%), or positive (≥ 10%). Among PR-positive and PR-negative breast cancers according to IHC assessment, there is also a relatively good separation by PGR mRNA by RT-qPCR into high and low expression subgroups. In contrast, the majority of those breast cancers with 1–9% PR-positive carcinoma cells have predominantly PGR mRNA quantities near the RT-qPCR cut-off separating “positive” from “negative”. b Graph of STRAT4 PGR dCt values by PR IHC % staining. The plot of the percentage of PR-positive tumor cells by immunohistochemical staining demonstrated a strong correlation with PGR mRNA quantity which was improved only slightly by consideration of tumor cell IHC staining intensity as shown in c. c Graph of STRAT4 PGR dCt values by PR IHC H-Score. H-Score is defined as [3(% of tumor staining 3+)] + [2(% of tumor staining 2+)] + [1(% of tumor staining 1+)]. Quantitative stratification of the IHC protein assessment by combining percentage of immunostained tumor cells with intensity of immunohistochemical staining demonstrated a slightly improved correlation with PGR mRNA determined by RT-qPCR. d The ROC curve for STRAT4 PGR including all samples in the analysis. The area under the curve (AUC) is 0.95
Fig. 3
Fig. 3
Comparison of human epidermal growth factor receptor 2 determined by either RT-qPCR or by immunohistochemistry with or without FISH assessment of IHC2+. a Graph of STRAT4 ERBB2 dCt values by HER2 IHC result categorized as negative (0–1+), equivocal (2+), or positive (3+). There is a significant correlation between HER2 status determined by IHC and ERBB2 mRNA determined by RT-qPCR with IHC 0/1+ showing low-level expression of ERBB2 mRNA and IHC 3+ showing high-level ERBB2 mRNA expression. The IHC 2+ breast cancers appear to have a level of ERBB2 mRNA intermediate between that of the IHC 0/1+ and IHC 3+ subgroups. b Graph of STRAT4 ERBB2 dCt values by HER2/CEP17 Ratio by the FISH assay. Increasing levels of gene amplification determined by FISH (increasing HER2/CEP17 ratio) are associated with increasing levels of ERBB2 mRNA expression, as expected. c Graph of STRAT4 ERBB2 dCt values by IHC plus FISH where FISH was used to resolve the IHC 2+ equivocals into HER2-positive or HER2-negative status. Although the IHC 2+ breast cancers appear to have a level of ERBB2 mRNA intermediate between that of the IHC 0/1+ and IHC 3+ subgroups (as illustrated in A above), further stratification can be achieved by the use of FISH in this group to determine which cases are HER2-amplified and which are not. Those IHC 2+ breast cancers with HER2-amplification by FISH have ERBB2 mRNA expression levels similar to IHC 3+ breast cancers. In contrast, those IHC 2+ breast cancers that are HER2-not-amplified by FISH have ERBB2 mRNA expression levels similar to IHC 1+ breast cancers. d The ROC curve for STRAT4 ERBB2 including all samples in the analysis. The area under the curve (AUC) is 0.99
Fig. 4
Fig. 4
Comparison of Ki67 proliferation rate determined by either RT-qPCR or immunohistochemistry. a Graph of STRAT4 MKi67 dCt values by Ki67 IHC % staining where the IHC high proliferation rate cutoff is defined as 20% and the intermediate proliferation rate is defined as 10–20% with < 10% considered a low proliferation rate. There is some overlap in MKi67 mRNA values between the high (> 20%) and low (< 10%) proliferation rate groups, with the intermediate group (10–20%) showing intermediate mRNA values by RT-qPCR, but with substantial overlap with both the high and low proliferation rate groups. MKi67 as measured by RT-qPCR appears as a continuum without a clear cutoff evident from the distributions when compared to Ki67 levels measured by IHC. b Graph of STRAT4 MKi67 dCt values by Ki67 IHC % staining where the IHC positivity cutoff is defined as 30% and the equivocal zone is defined as 10–30%. Raising the IHC cutoff for the determination of high proliferation rate has no appreciable impact on the correlation between RT-qPCR and IHC methods. The MKi67 distribution still shows a continuum of values without a clear cutoff. c Graph of STRAT4 MKi67 dCt values by Ki67 IHC % staining. There appears to be a discernable correlation between the percentage of tumor cells with immunochemical staining for Ki67 with MKi67 mRNA levels by RT-qPCR, especially at levels above 40%. d The ROC curve for STRAT4 MKi67 where all samples were included in the analysis. The area under the curve (AUC) is 0.85

References

    1. Akuoko CP, Armah E, Sarpong T, Quansah DY, Amankwaa I, Boateng D. Barriers to early presentation and diagnosis of breast cancer among African women living in sub-Saharan Africa. PLoS ONE. 2017;12(2):e0171024. doi: 10.1371/journal.pone.0171024. - DOI - PMC - PubMed
    1. Jedy-Agba E, McCormack V, Adebamowo C, dos-Santos-Silva I. Stage at diagnosis of breast cancer in sub-Saharan Africa: a systematic review and meta-analysis. Lancet Glob Health. 2016;4(12):e923–e935. doi: 10.1016/s2214-109x(16)30259-5. - DOI - PMC - PubMed
    1. Stefan DC. Cancer care in Africa: an overview of resources. J Glob Oncol. 2015;1(1):30–36. doi: 10.1200/jgo.2015.000406. - DOI - PMC - PubMed
    1. Anderson BO. Breast cancer–thinking globally. Science. 2014;343(6178):1403. doi: 10.1126/science.1253344. - DOI - PubMed
    1. Edge J, Buccimazza I, Cubasch H, Panieri E. The challenges of managing breast cancer in the developing world: a perspective from sub-Saharan Africa. S Afr Med J. 2014;104(5):377–379. doi: 10.7196/SAMJ.8249. - DOI - PubMed