. 2018 Dec:177:181-190.
doi: 10.1016/j.exer.2018.08.003. Epub 2018 Aug 16.

Correlation of spectral domain optical coherence tomography with histology and electron microscopy in the porcine retina

Affiliations

Correlation of spectral domain optical coherence tomography with histology and electron microscopy in the porcine retina

Wankun Xie et al. Exp Eye Res. 2018 Dec.

Abstract

Spectral domain optical coherence tomography (SD-OCT) is used as a non-invasive tool for retinal morphological assessment in vivo. Information on the correlation of SD-OCT with retinal histology in the porcine retina, a model resembling the human retina, is limited. Herein, we correlated the hypo- and hyper-reflective bands on SD-OCT with histology of the lamellar architecture and cellular constituents of the porcine retina. SD-OCT images were acquired with the Heidelberg Spectralis HRA + OCT. Histological analysis was performed using epoxy resin embedded tissue and transmission electron microscopy. Photomicrographs from the histologic sections were linearly scaled to correct for tissue shrinkage and correlated with SD-OCT images. SD-OCT images correlated well with histomorphometric data. A hyper-reflective band in the mid-to-outer inner nuclear layer correlated with the presence of abundant mitochondria in horizontal cell processes and adjacent bipolar cells. A concentration of cone nuclei corresponded to a relative hypo-reflective band in the outer portion of the outer nuclear layer. The presence of 3 hyper-reflective bands in the outer retina corresponded to: 1) the external limiting membrane; 2) the cone and rod ellipsoid zones; and 3) the interdigitation zone of photoreceptor outer segments/retinal pigment epithelium (RPE) apical cell processes and the RPE. These correlative and normative SD-OCT data may be employed to characterize and assess the in vivo histologic changes in retinal vascular and degenerative diseases and the responses to novel therapeutic interventions in this large animal model.

Keywords: Anatomy; Eye; Pig; Retinal imaging.


Conflict of interest statement

Declarations of interest: none

Figures

Figure 1.
Figure 1.. SD-OCT Imaging of the Porcine Retina
OCT vertical scan (A, B) through the superior optic nerve head and retina and schematic depiction (boxed area) of the 10 longitudinal adjacent pixel lines from which reflectivity profiles were extracted. Note the small retinal blood vessels (arrowheads) intersected by the green line/arrow indicating the scanned retina in the infrared image (A) and the corresponding hyperreflectivity (arrowheads) on the OCT image (B). Higher magnification of the boxed area in the OCT image (C) shows the retinal layers (left panel) and correlation with the OCT reflectivity profile (right panel). Note the increased reflectivity of the nerve fiber and plexiform layers in the OCT scan (left panel) and the corresponding grayscale reflectivity (right panel). See Figure 2 for OCT-histology correlation.
Figure 2.
Figure 2.. Correlation of Retinal SD-OCT and Light Microscopy
Cross-sectional OCT image of the porcine superior retina at 3000 μm from the superior margin of the optic nerve head in the vertical direction (A). Toluidine blue-stained epoxy resin embedded section (B) obtained from the corresponding retina. From the internal (top) to the external (bottom) retina, alternating light and dark bands of signal in the OCT image directly correlate with the retinal layers. Note that the discontinuous OCT hyper-reflective band (arrows) within the INL corresponds to the abundant cytoplasm of the horizontal cells on light microscopy and that the relative hypo-reflective band in the outer aspect of the ONL corresponds to the cone nuclei (CN). Note also longitudinal sectioning through a deep retinal capillary (arrowhead) in the INL. A thick hyper-reflective band (EZ) corresponds to the ellipsoid zones of the cones (more internal) and rods (more external) (see TEM, Figure 6). Abbreviations: NFL, nerve fiber layer; GCL, ganglion cell layer; IPL, inner plexiform layer; INL, inner nuclear layer; OPL, outer plexiform layer; ONL, outer nuclear layer; CN, cone nuclei; ELM, external limiting membrane; EZ, ellipsoid zone; IZ/RPE, interdigitation zone/retinal pigment epithelium complex CC, choriocapillaris; CH, choroid; S, sclera. Scale bar: 50 microns.
Figure 3.
Figure 3.. Correlation of Histology and SD-OCT in the Inner Nuclear Layer of the Porcine Retina
Immunodetection of calbindin D-28 (marker for horizontal cells) (arrowheads) in the porcine retina with immunofluorescence (A) and immunohistochemistry (B). Note the apical distribution of the cytoplasm in the horizontal cells (red arrowheads) and the nuclear and cytoplasmic staining of horizontal cells. Note that A is not in alignment with B and C due to differential tissue expansion and shrinkage with varying tissue processing methods (e.g., frozen sectioning in A and paraffin embedding in B). The hyper-reflective band in the INL correlates with the horizontal cell cytoplasm (C). Abbreviations: IPL, inner plexiform layer; INL, inner nuclear layer; HCC, horizontal cell cytoplasm; HCN, horizontal cell nucleus; OPL, outer plexiform layer; ONL, outer nuclear layer; RPE, retinal pigment epithelium. Scale bar: 20 microns.
Figure 4.
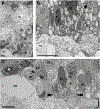
Figure 4.. TEM of the Inner Plexiform Layer (IPL) and Inner Nuclear Layer (INL) of the Porcine Retina
Endothelial cells (EC) and fibrous astrocyte (FA) in the middle of the IPL (A, also see Xie et al., 2018 [Figure 2] for higher magnification electron micrographs) corresponded to discontinuous relative hypo-reflectivity in the IPL on SD-OCT. Various cell types are identifiable in the INL, including amacrine cells (AC), Müller cells (MC), bipolar cells (BC) and horizontal cells (HC). Numerous mitochondria are present in the bipolar cells (between arrowheads). Note the deep retinal capillary (asterisk) in the INL. The region between the arrowheads and in the boxed area in A is shown at higher magnification in B and C. Note the horizontal cell (HC) with a long cytoplasmic process (bracket) containing numerous mitochondria (B). Adjacent bipolar cells (BC) also contain abundant mitochondria (between arrowheads (B). The boxed area in C is shown at high magnification in Xie et al., 2018 [Figure 5]. The presence of abundant mitochondria in this region of the INL correlates with a hyper-reflective band on SD-OCT. Scale bar: 5 microns.
Figure 5.
Figure 5.. TEM of the Outer Nuclear Layer of the Porcine Retina
Note the concentration of cone nuclei (CN) in the outer aspect of the outer nuclear layer (ONL), immediately internal to the external limiting membrane (ELM) (A). This finding corresponded to a relative hypo-reflective layer in the outer portion of the ONL on SD-OCT imaging (B) as demonstrated in the reflectivity profile (C). The boxed area in the OCT image (D) is shown at higher magnification in B and correlated with the electron micrograph (A). Other abbreviations: outer plexiform layer, OPL; cone myoid, CM; cone ellipsoid, CE. Scale bar: 10 microns.
Figure 6.
Figure 6.. TEM of the Photoreceptor Inner and Outer Segments
The extent of the cone (CE) and rod (RE) ellipsoid zones with numerous mitochondria are demarcated by the dotted lines (A). The RE extend quite distally in the inner/outer segment region (arrowheads). This broad expanse of the CE and RE corresponds to the thickest of the 3 hyper-reflective bands in the outer retina on SD-OCT (B) as demonstrated in the reflectivity profile (C). The boxed area in the OCT image (D) is shown at higher magnification in B and correlated with the electron micrograph (A). Higher magnification (E) of the boxed area in A shows overlapping of the RE with the CE, cone outer segments (COS), and rod outer segments (ROS). Other abbreviations: CN, cone nuclei; RPE, retinal pigment epithelium; RM, rod myoid; CM, cone myoid. Scale bar: 5 microns.
Figure 7.
Figure 7.. TEM of the Retinal Pigment Epithelium (RPE) and the RPE-Photoreceptor Outer Segment Interdigitation Zone (IZ)
RPE apical cell processes and photoreceptor outer segments (A) are intimately associated in the interdigitation zone (IZ) (see also Xie et al., 2018 [Figure 6]). The melanin pigment granules are concentrated in the apical RPE cytoplasm. Note the abundant endoplasmic reticulum (asterisks), mitochondria (arrows), and basal cytoplasmic membrane infoldings (arrowhead). These membranous profiles and the IZ appeared to correspond with the third hyper-reflective band on SD-OCT. The curved arrow indicates the RPE basement membrane. The boxed area is shown at higher magnification in B and shows extensive profiles of smooth (arrows) and rough (asterisk) endoplasmic reticulum and mitochondria (M). Note also the membrane-bound melanin pigment granules. A high magnification electron micrograph (C) of another RPE cell discloses several mitochondria (M), smooth (arrowhead) and rough (arrow) endoplasmic reticulum, and melanin pigment granules adjacent to the nucleus (N) in the basal cytoplasm. Note the basal cytoplasmic membrane infoldings (BI) and basement membrane (BM). Scale bars: A, 5 microns; B and C, 1 micron.
Figure 8.
Figure 8.. Correlation of Porcine Retinal Thickness Measured by SD-OCT and Histology
Porcine retinal thickness was measured at 200 μm intervals along the vertical meridian from the optic nerve head in histologic sections and across the full length of SD-OCT scans (8000 μm). Scatter plot of retinal thickness (A) along the vertical meridian of the superior retina measured from the optic nerve head to the midperipheral retina by SD-OCT and histology, and the regression plot (B) revealed significant correlation (R2=0.9886) of retinal thickness measurements by SD-OCT and histology. Vertical bars represent ± SEM.

References

    1. Abbott CJ, McBrien NA, Grunert U, Pianta MJ, 2009. Relationship of the optical coherence tomography signal to underlying retinal histology in the tree shrew (Tupaia belangeri). Invest Ophthalmol Vis Sci. 50, 414–423. - PubMed
    1. Adekunle AN, Adkins A, Wang W, Kaplan HJ, de Castro JF, Lee SJ, Huie P, Palanker D, McCall M, Pardue MT, 2015. Integration of perforated subretinal prostheses with retinal tissue. Transl Vis Sci Technol. 4, 5. - PMC - PubMed
    1. Alamouti B, Funk J, 2003. Retinal thickness decreases with age: an OCT study. Br J Ophthalmol. 87, 899–901. - PMC - PubMed
    1. Anger EM, Unterhuber A, Hermann B, Sattmann H, Schubert C, Morgan JE, Cowey A, Ahnelt PK, Drexler W, 2004. Ultrahigh resolution optical coherence tomography of the monkey fovea. Identification of retinal sublayers by correlation with semithin histology sections. Exp Eye Res. 78, 1117–1125. - PubMed
    1. Asami T, Terasaki H, Ito Y, Sugita T, Kaneko H, Nishiyama J, Namiki H, Kobayashi M, Nishizawa N, 2016. Development of a fiber-optic optical coherence tomography probe for intraocular use. Invest Ophthalmol Vis Sci. 57, 568–574. - PubMed

Publication types