. 2018 Sep 6;174(6):1537-1548.e29.
doi: 10.1016/j.cell.2018.07.022. Epub 2018 Aug 16.

Uridylation by TUT4/7 Restricts Retrotransposition of Human LINE-1s

Affiliations

Uridylation by TUT4/7 Restricts Retrotransposition of Human LINE-1s

Zbigniew Warkocki et al. Cell. .

Abstract

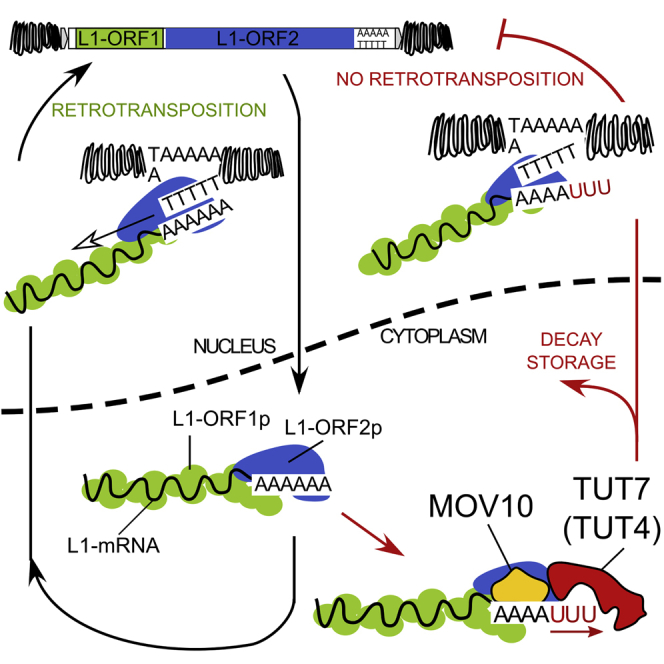
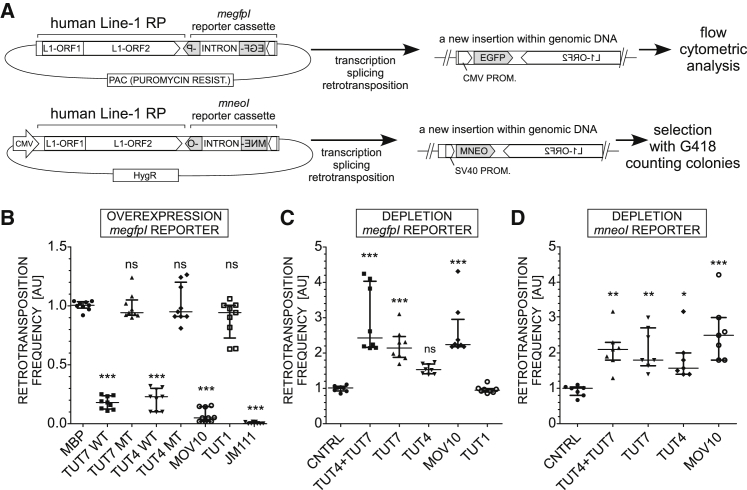
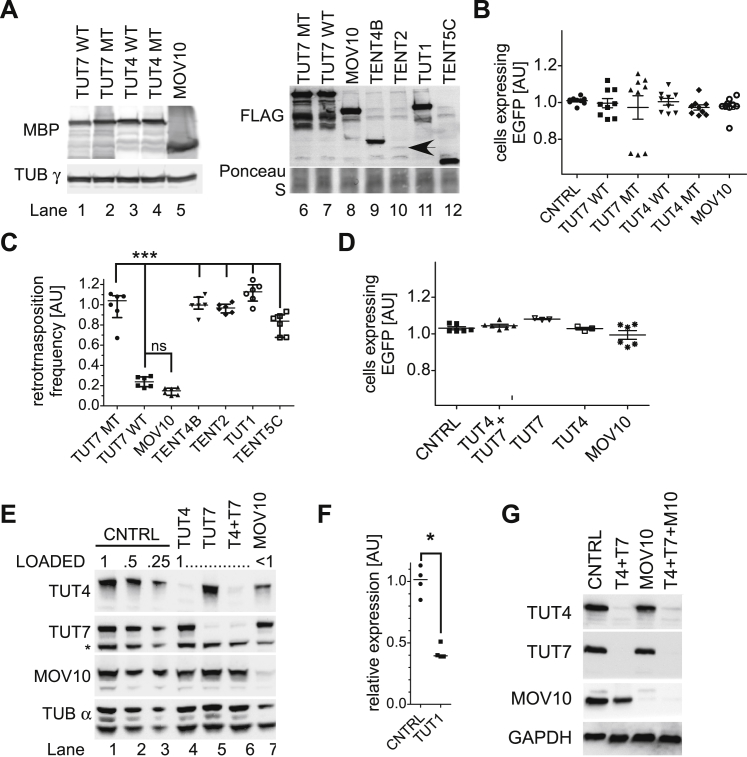
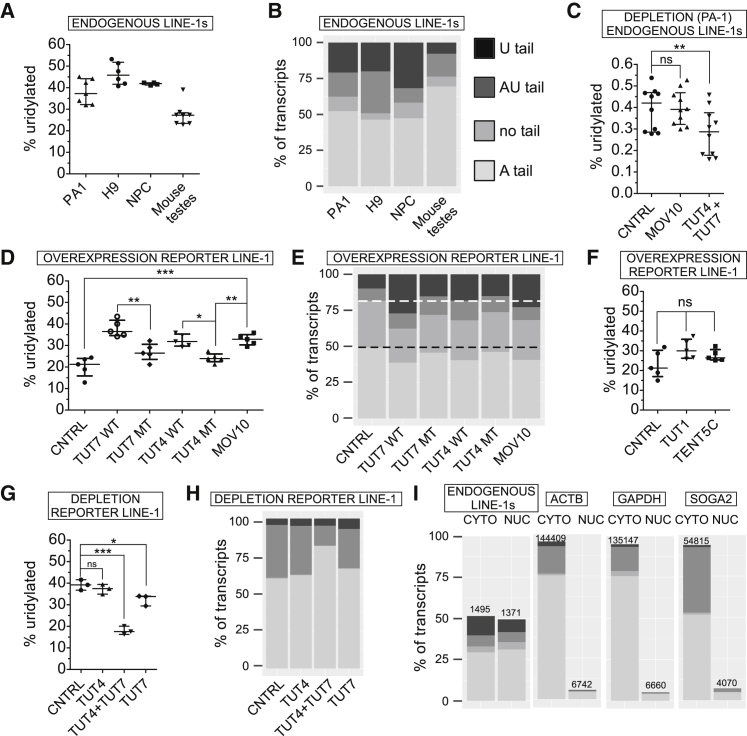
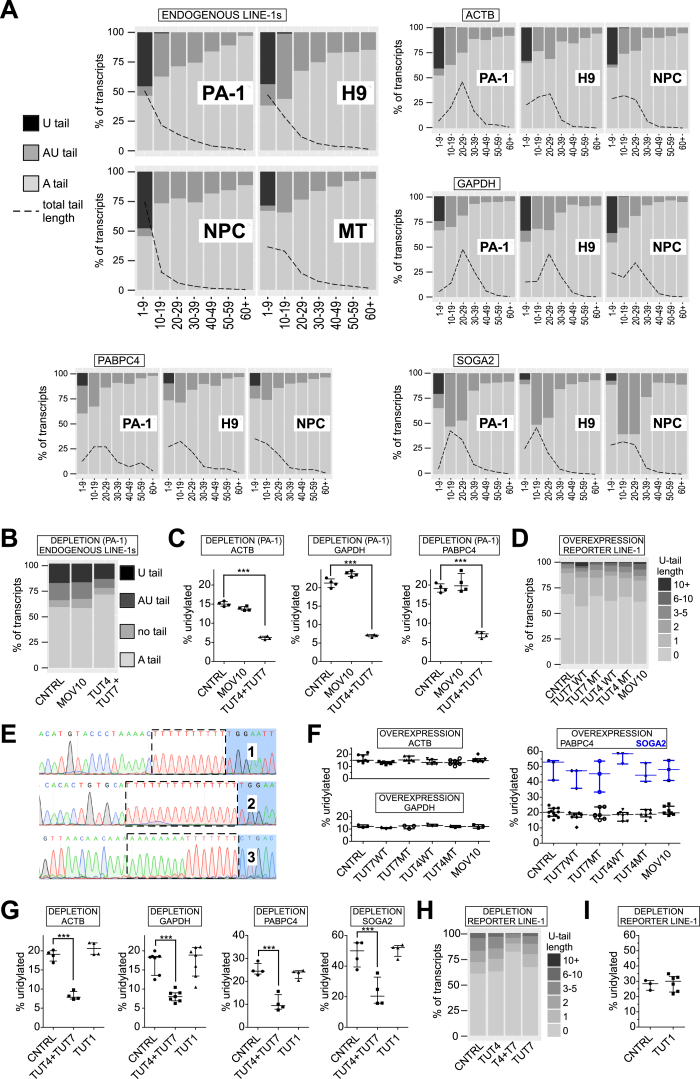
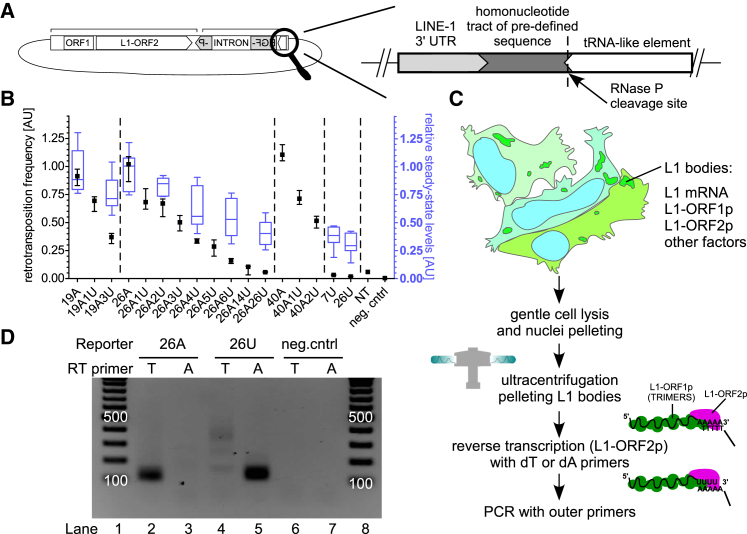
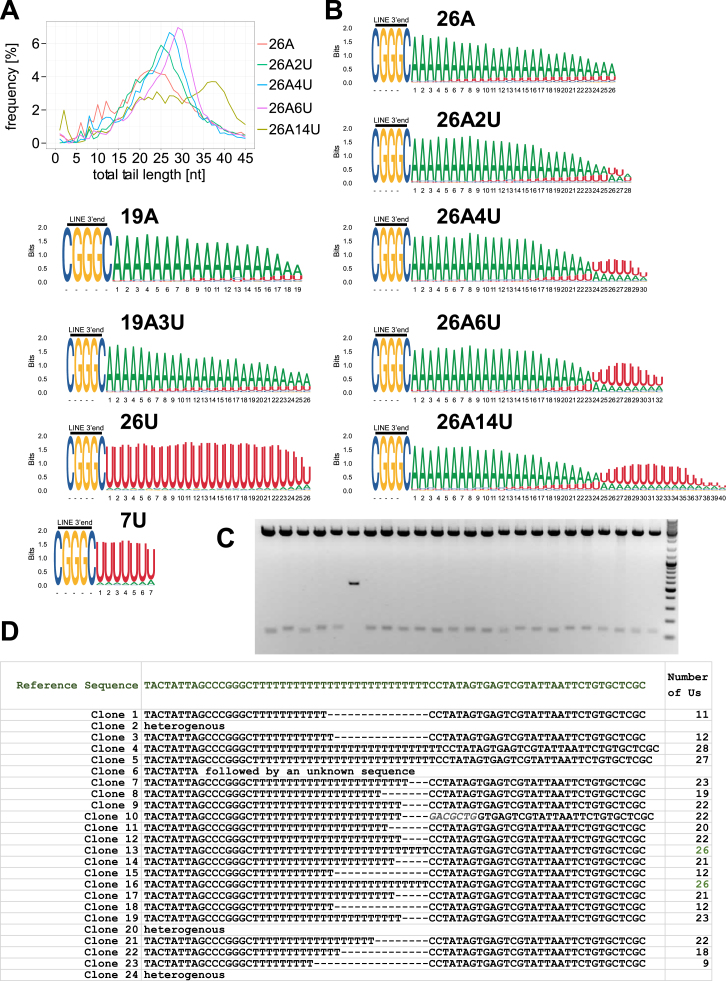
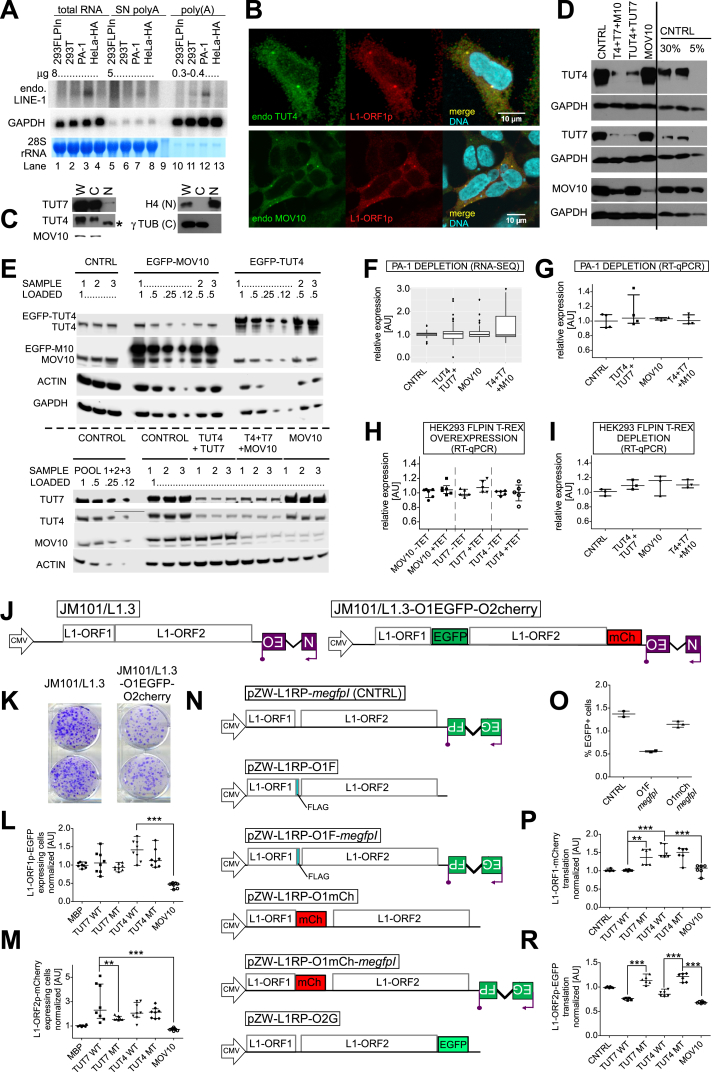
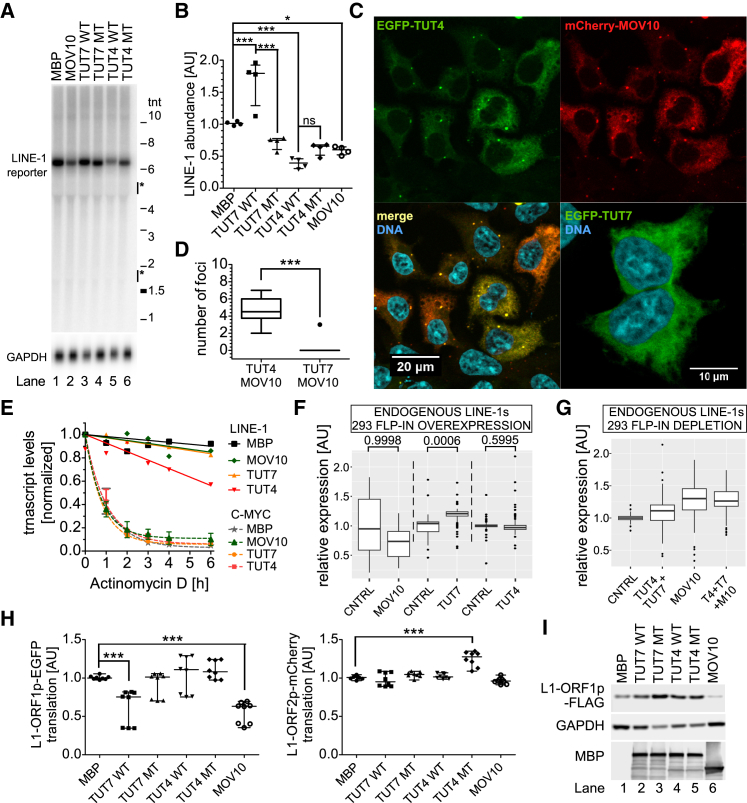
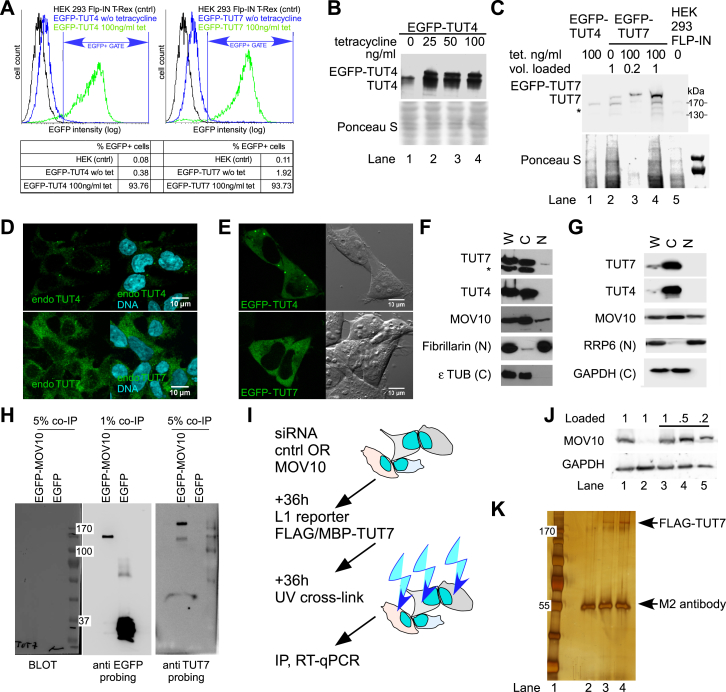
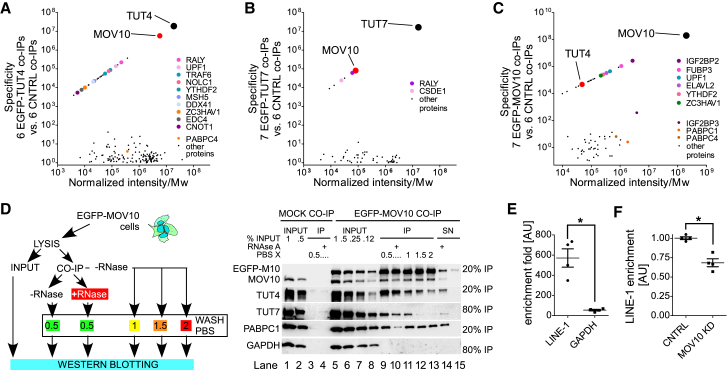
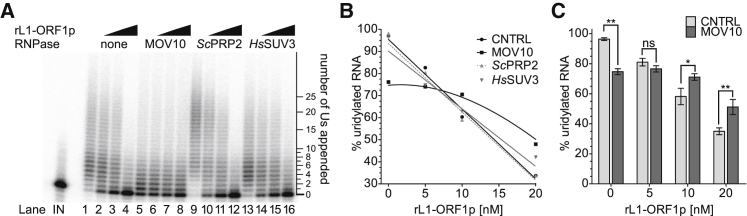
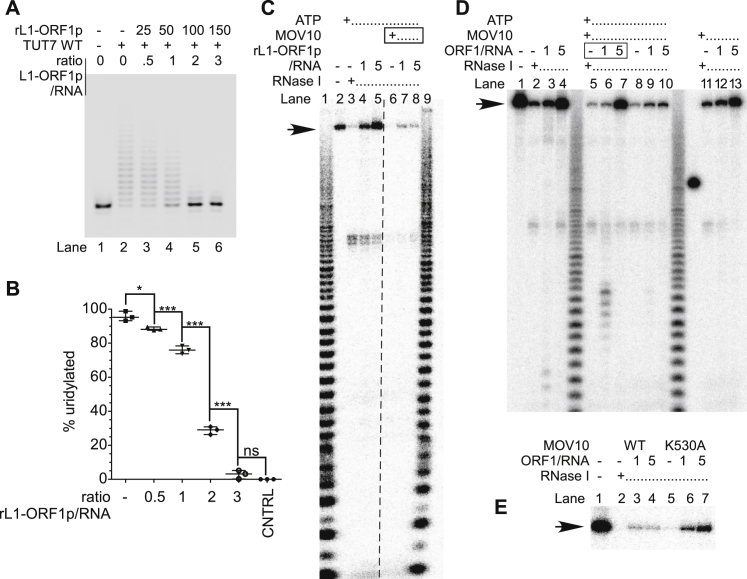
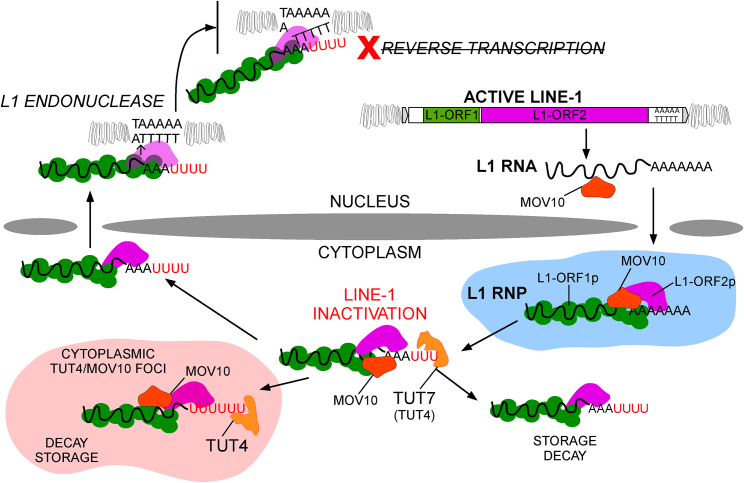
LINE-1 retrotransposition is tightly restricted by layers of regulatory control, with epigenetic pathways being the best characterized. Looking at post-transcriptional regulation, we now show that LINE-1 mRNA 3' ends are pervasively uridylated in various human cellular models and in mouse testes. TUT4 and TUT7 uridyltransferases catalyze the modification and function in cooperation with the helicase/RNPase MOV10 to counteract the RNA chaperone activity of the L1-ORF1p retrotransposon protein. Uridylation potently restricts LINE-1 retrotransposition by a multilayer mechanism depending on differential subcellular localization of the uridyltransferases. We propose that uridine residues added by TUT7 in the cytoplasm inhibit initiation of reverse transcription of LINE-1 mRNAs once they are reimported to the nucleus, whereas uridylation by TUT4, which is enriched in cytoplasmic foci, destabilizes mRNAs. These results provide a model for the post-transcriptional restriction of LINE-1, revealing a key physiological role for TUT4/7-mediated uridylation in maintaining genome stability.

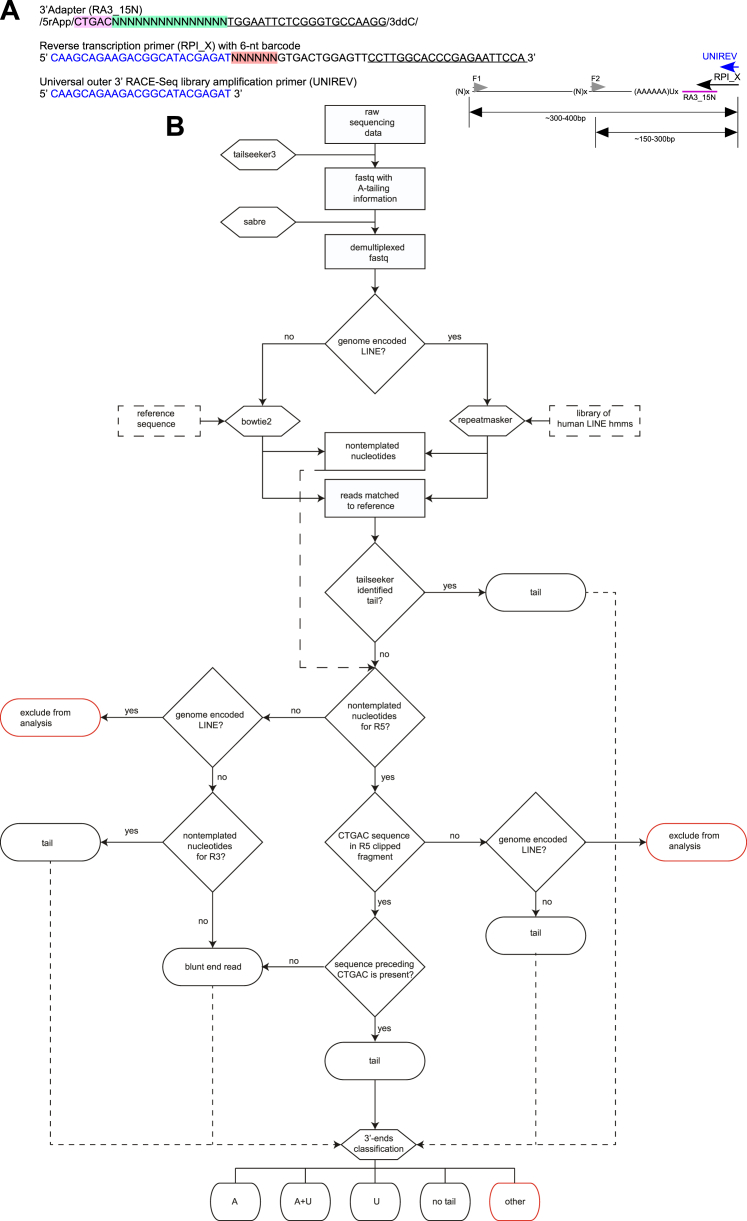
Keywords: 3′ RACE-seq; L1-ORF1p; L1-ORF2p; LINE-1; MOV10; TUT4; TUT7; poly(A); retrotransposition; uridylation.


Figures

None
Graphical abstract
Figure 1
Figure 1
TUT4 and TUT7 Restrict L1 Retrotransposition (A) Flowchart of the plasmid-based L1 retrotransposition assays that allow assessment of retrotransposition events by either flow cytometry-based monitoring of cellular EGFP fluorescence (megfpI reporter) or counting drug-resistant colonies (mneoI reporter). (B) Effects of overexpression of either WT or mutant (MT) TUT4 or TUT7 or WT TUT1, MOV10, or MBP (control) (each point = biological replicate) on L1 retrotransposition in HEK293T cells. Negative control (JM111): a retrotransposition-defective reporter (L1-ORF1pR261A/R262A). The results of independent experiments were normalized relative to the control (MBP). Statistical significance was calculated using one-way ANOVA and Tukey’s multiple comparison test (∗∗∗p < 0.001; ∗∗p < 0.01; and p < 0.05, in comparison to MBP). (C) Retrotransposition assay in HEK293T cells depleted of TUT7, TUT4 (alone or combined), MOV10, or TUT1 using siRNAs. A control with a non-targeting siRNA was included (CNTRL). Normalization was done relative to CNTRL. Statistical analysis was performed like in (B) (comparison to CNTRL shown). There is no significant difference between CNTRL and TUT1, and a comparison to TUT1 instead of CNTRL gives the same statistical significances. (D) L1 retrotransposition assays in HeLa-HA cells using mneoI L1 retrotransposition reporter assay. The results were normalized, relative to the control non-targeting siRNA (CNTRL). Statistical analysis is the same as that performed in (B). Shown are comparisons to CNTRL. Normalization was done to CNTRL. Data in (B)–(D) are represented as medians with individual points and interquartile ranges. See also Figure S1.
Figure S1
Figure S1
Control Experiments for Plasmid-Based L1 Retrotransposition Assays, Related to Figure 1 (A) Western blotting to show expression of N’-MBP-tagged WT and MT TUT4, TUT7, MOV10 (lanes 1-5), N’-FLAG-tagged MT and WT TUT7 and MOV10 (lanes 6-8), C’-FLAG-tagged TENT4B, TENT2, TUT1 and TENT5C (lanes 9-12). Blots were probed with mouse monoclonal antibodies against MBP or rabbit polyclonal antibodies against FLAG. A probing for γ-tubulin and ponceau S staining were added as loading controls. A black arrow points to weakly expressed TENT2-FLAG in lane 10. (B and D) A plasmid encoding EGFP was used to test transfection efficiencies and toxicity (EGFP expression) concomitantly with co-transfection of a plasmid overexpressing wild-type or mutant TUT4, TUT7, MOV10 or MBP (CNTRL, B) or concomitantly with siRNA-directed depletion of both TUT4/7, TUT4, TUT7, MOV10 or non-targeting control (CNTRL, D). Data for 9 biological replicates (three independent experiments; panel B) and 3–6 biological replicates (two independent experiments, D) were normalized to controls. Means with SEM are plotted. No significant differences were observed as assessed by one-way ANOVA and Tukey’s multiple comparison test. (C) L1 retrotransposition assay in HEK293T cells with L1-megfpI reporters and concomitant overexpression of the indicated protein (as in panel A). Normalization was done to TUT7 MT. Statistical significance was calculated using one-way ANOVA and Tukey’s multiple comparison test. Statistical significance of TUT7 WT condition versus TUT7 mutant and the TENTs is shown (∗∗∗p < 0.001). (E) Western blotting to test depletion of endogenous TUT4, TUT7, both TUTases or MOV10 by siRNAs (probed with specific antibodies; probing with α-tubulin was used as a loading control). Cells were co-transfected with the L1 megfpI reporter concomitantly with siRNAs. Cells were collected on day 4 post-transfection and split for flow-cytometry and western blotting. An asterisk marks an unspecific band detected by the anti-TUT7 antibodies (the band can be used to assess loading). Probing with the anti-α-tubulin mouse monoclonal antibodies showed 2 bands and was not used in other blots in the paper. (F) RT-qPCR estimation of TUT1 depletion at mRNA level by siRNAs at day 3 post-transfection (in cells co-transfected with the L1 megfpI reporter). Expression was normalized to control. (G) Western blotting to test depletion of TUT4 and TUT7, MOV10 or both TUTases and MOV10 in HeLa-HA cells under conditions used for retrotransposition assay with the mneoI reporter. Cells were collected at day 3 post-transfection (after co-transfection with L1-mneoI plasmids). Data on panels C and F are presented as medians with individual points and interquartile ranges shown. The western blotting exposures were done either to a film and scanned by an Epson scanner and bottom scanning option (panel G) or by a CCD camera (panels A and E). The singnals in the images acuired with a CCD camera were digitally enhanced by using ‘adjust levels’ option for the entire images.
Figure 2
Figure 2
3′ RACE-Seq of L1 and Control mRNAs (A) Fraction of uridylated endogenous L1 mRNAs in human embryonic carcinoma cells (PA-1), human embryonic stem cells (H9-hESCs), human neuronal progenitor cells (derived from hESCs, NPC) and in mouse testes (of P10 young mice; 4 mice, 8 testes). (B) Distribution of 3′ tails in endogenous L1 mRNAs. The tails were assigned to one of four classes: U-tail (mono- and oligouridylated, but not adenylated); AU-tail (adenylated and mono- and oligouridylated); “no tail” (neither adenylated nor uridylated, mostly truncated within the 3′ UTR); A-tail (oligo- and polyadenylated). (C) Effect of siRNA-mediated depletion of MOV10 or TUT4 and TUT7 on uridylation of endogenous L1 mRNAs in PA-1. Statistical significance was calculated using one-way ANOVA and Tukey’s multiple comparison test. The comparison and significance are shown relative to a non-targeting siRNA control (CNTRL, ∗∗p < 0.01). (D) Uridylation of reporter L1 mRNAs in HEK293 cells under overexpression of MBP (CNTRL), WT, and MT TUT7, TUT4, or MOV10 as indicated. Statistical significance was calculated like in (C). (E) Distribution of 3′ tails in reporter L1 mRNAs, visualized like in (B) under MBP, TUT4, TUT7, or MOV10 overexpression conditions as indicated. White-dashed line and black-dashed line indicate control sample levels of uridylated (U+AU-tails) and adenylated L1 mRNAs, respectively. (F) Effects of overexpression of TUT1 and TENT5C on uridylation of reporter L1 mRNAs in HEK293 cells. Statistical significance was calculated like in (C). (G) Effects of depleting TUT4, TUT7, or both TUTases using siRNAs in HEK293 cells on uridylation of reporter L1 mRNAs. Statistical significance was calculated like in (C). (H) Distribution of 3′ tails in reporter L1 mRNAs, visualized like in (B) under TUT4, TUT4, and TUT7 or TUT7 depletion conditions in HEK293 cells as indicated. (I) Distribution of endogenous L1 and control mRNAs’ (ACTB, GAPDH, and SOGA2) 3′ ends in the cytoplasmic and nuclear compartments of PA-1 cells. The numbers of sequenced 3′ RACE reads are indicated and plotted assuming cyto+nuc = 100%. Qualities of the mRNAs’ 3′ ends are color-coded like in (B). Data in (A), (C), (D), (F), and (G) are medians with individual points and interquartile ranges shown. See also Figures S2 and S7 and Tables S1 and S2.
Figure S2
Figure S2
3′ RACE-Seq of Endogenous and Reporter L1 mRNAs and of Control Cellular mRNAs, Related to Figure 2 (A) Distribution of U-tails, AU-tails and A-tails in endogenous L1, ACTB, GAPDH, PABPC4 and SOGA2 mRNAs (as indicated) possessing non-templated 3′ end nucleotides in the indicated cells/organs: PA-1 cells, human embryonic stem cells (H9), human neuronal progenitor cells (NPC) and in mouse testes (MT). The fraction of transcript 3′ ends is shown in the y axis with total set to 100%. Tails were binned in 10-nucleotide bins (but 1-9 and 60+) according to their length and are visualized in x axis. A black dashed line overlaid onto the graphs and represents total tail-length distribution, normalized to 100% and shown as % of total transcripts (y axis). (B) Distribution of 3′ tails in endogenous L1 mRNAs in PA-1 cells transfected with control non-targeting siRNA (CNTRL) or siRNAs against MOV10 or TUT4 and TUT7. The tails were assigned to one of four classes: U-tail (mono- and oligouridylated, but not adenylated); AU-tail (adenylated and mono- and oligouridylated); “no tail” (neither adenylated nor uridylated, mostly truncated within the 3′ UTR); A-tail (oligo- and polyadenylated). (C) Uridylation of control mRNAs: ACTB, GAPDH and PABPC4 (as indicated) in PA-1 cells transfected with control non-targeting siRNA (CNTRL) or siRNAs against MOV10 or TUT4 and TUT7. Statistical significance was calculated using one-way ANOVA and Tukey’s multiple comparison test significance (∗∗∗p < 0.001). No statistical significance was reported between CNTRL and MOV10 depletion. (D) Distribution of U-tail lengths in reporter L1 mRNAs in HEK293 cells under overexpression of the indicated proteins. The U-tails were grouped according to the number of uridines. Data were normalized to all mRNAs for a given condition. (E) Examples of 3′ RACE clones with reporter L1 mRNAs, to show the presence of oligouridylated (1,2) and oligoadenylated and oligouridylated 3′ ends (3). Dashed lined boxes indicate the presence of non-templated nucleotides. Blue background indicates 5′ end of the 3′ adaptor used (different for 1, 2 and 3). (F) Uridylation of control mRNAs: ACTB, GAPDH, PABPC4 and SOGA2 (as indicated) in HEK293 cells overexpressing MBP (CNTRL), wild-type or mutant TUT4/7 and MOV10. Statistical tests were performed as in panel C. No statistically significant changes were observed. (G) Uridylation of control mRNAs: ACTB, GAPDH, PABPC4 and SOGA2 (as indicated) in HEK293 cells depleted of TUT4 and TUT7 or TUT1 (as indicated). Statistical significance was calculated as in panel C and is shown where applicable. (H) Distribution of U-tail lengths on reporter L1 mRNAs in HEK293 cells under depletion of the indicated proteins. The U-tails were grouped according to the number of uridines. Data were normalized to all mRNAs for a given condition. (I) Uridylation of L1 reporter mRNAs in control HEK293 cells (transfected with non-targeting siRNAs, CNTRL) and in cells depleted of TUT1. Data on panels C, F, G, and I are represented as medians with individual points and interquartile ranges shown.
Figure 3
Figure 3
Uridylation of L1 mRNA Abolishes Retrotransposition (A) Scheme of the L1 retrotransposition megfpI reporters used in this study. Immediately downstream of a reporter’s 3′ UTR, there is a defined sequence encoding a non-uridylated or differentially uridylated poly(A) (19A, 19A1U, 19A3U, 26A, 26A1U, 26A2U, 26A3U, 26A4U, 26A5U, 26A6U, 26A14U, 26A26U, 40A, 40A1U, 40A2U), 7U, 26U, or the sequence is missing (“no-tail”; NT), all followed by a sequence encoding a tRNA-like element. (B) Retrotransposition frequency (black) and steady-state reporter mRNA levels (blue) with the reporters described in (A). For retrotransposition assays medians with interquartile ranges are shown (4 to 12 biological replicates). Blue boxes plus whiskers (Tukey’s) represent mRNA abundance (8 biological replicates) for the indicated reporters. Normalizations were done using the 26A reporter. One-way ANOVA and Tukey’s multiple comparison test were used to calculate statistics. All uridylated reporters support significantly (p < 0.001) lower levels of retrotransposition than their non-uridylated counterparts. Steady states: 19A versus 19A3U – ns, 26A versus 26A2U – ns, 26A versus 26A4U/6U/26U, 7U, 26U – p < 0.001. (C) Scheme of the LEAP procedure with description. (D) LEAP assays using plasmids carrying LINE-1 reporters ending with a defined sequence (26As or 26Us). The reporter used is indicated at the top, and the RT primer used in each LEAP reaction is indicated below (RT primer). Lanes 1 and 8, a DNA ladder (100 bp to 1,000 bp with 100-bp increments). The 100- and 500-bp bands are labeled. Negative controls (neg.cntrl) without RNPs were also included. See also Figure S3.
Figure S3
Figure S3
3′ RACE-Seq and LEAP Products Sequencing of the L1 Reporters with Defined 3′ Ends, Related to Figure 3 (A) Graphs showing distribution of total tails’ lengths in 3′ RACE-seq data of L1 reporters designed to possess at their 3′ ends either of: 26A, 26A2U, 26A4U, 26A6U or 26A14U. The respective reporters are color coded as indicated. (B) Logos representing the 3′ RACE-seq data for the indicated reporters. Shown is the CGGC sequence common to all reporters and specific sequences. Probability of a given nucleotide and of the position occupancy in general is calculated in bits and depicted accordingly. (C) Plasmids (24), whose inserts’ sequencing is shown in panel D, were cut with XbaI and XhoI Fast digest restriction enzymes, yielding fragments of expected length (approximately 130bp). Lanes from left to right correspond to clones 1-24 in the table in panel D. A molecular weight ladder was included, with the two fastest migrating bands corresponding to 100 and 200bp, respectively. (D) Validation of genuine reverse transcription of uridylated L1 mRNAs by L1-ORF2p. LEAP products seen in Figure 3D lane 5 were cloned into pJET 1.2 blunt plasmid, and single bacterial colonies used for preparation of plasmids. Clones were sequenced and the results are summarized in the table. One clone (10) possessed a chimeric sequence comprising a short stretch of the L1 reporter plasmid-encoded sequence (in italics) followed by the genuine 3′ LEAP adaptor sequence. 3 clones had a heterogenous sequence cloned (2, 20 and 24), while clone 6 had the expected L1 3′end followed by a 0.7Kb long sequence of unknown origin.
Figure S4
Figure S4
Effects of TUT4/7 and MOV10 on L1 mRNA Steady-State Levels, Stability, and Translational Competence, Related to Figure 4 (A) Northern blotting to detect endogenous L1 mRNAs in HEK293 (FLP-IN T-Rex), HEK293T, PA-1 and HeLa-HA cells as indicated. Total RNA (lanes 1-4), unbound RNA fraction retrieved after selecting for poly(A) (SN, using PolyA Purist MAG from Ambion; lanes 5-8) and poly(A) RNA (lanes 10-13). The amount of RNA loaded is indicated (μg). The same blot was re-probed for GAPDH and stained with methylene blue prior to any probing, and results are shown below (i.e., loading controls). Substantial fraction of unbound L1 mRNAs likely represents oligouridylated or truncated mRNAs. (B) Confocal microscopy pictures (maximal projections in z) showing mostly cytoplasmic localization of L1-ORF1p-FLAG (stained with rabbit anti-Flag monoclonal antibodies and secondary Alexa 488 coupled antibodies) and of endogenous TUT4 and MOV10 proteins. (C) Rapid cell fractionation following the protocol described by Suzuki et al. (2010) and subsequent western blotting to assess subcellular localization of TUT7, TUT4, MOV10 in PA-1 cells. Blotting for cytoplasmic (γ-tubulin) and nuclear (histone H4) markers were also performed. W – whole cell, C – cytoplasmic compartment, N – nuclei. An asterisk denotes an unspecific band. (D) Western blot analysis of proteins in PA-1 cells after siRNA-mediated depletion of TUT4 and TUT7 or MOV10, as indicated at the top of the panel. CNTRL denotes non-targeting siRNAs. A total of 30% (2x) and 5% of the control sample were loaded as indicated at the top, to assess depletion efficiency. Blots were probed with rabbit polyclonal antibodies as indicated on the left. GAPDH was used as a loading control. Superfluous lanes irrelevant to the study were removed (indicated with the black line). (E) Western blot validation of overexpression (upper panel) and knock-down (lower panel) in HEK293 (FLP-IN T-Rex) cells used for RNA-seq experiments to analyze endogenous L1 mRNA steady-state levels. Cells (triplicates) were split for RNA isolation and western blots. Blots were probed with rabbit polyclonal antibodies for the detection of MOV10, TUT7, TUT4, GAPDH and actin. The latter two proteins were used as loading controls. Different volumes of lysates were loaded to help assess overexpression and depletion efficiencies. Samples and loading volumes are indicated. (F) RNA-seq-based estimation of endogenous L1 expression in PA-1 cells transiently depleted of TUT4 and TUT7, MOV10 or all three proteins as indicated, using siRNAs (see panel D). Uniquely mapped reads for 76 Homo sapiens-specific L1s were calculated and normalized to respective controls as indicated. None of the observed changes is statistically significant. (G–I) Estimation of endogenous L1-Ta mRNAs by RT-qPCR using probes as described in Coufal et al. (2009), in PA-1 (G), and HEK293 FLP-IN T-Rex stable cell lines (in which indicated proteins were overexpressed by addition of tetracycline, and normalized to cells without tetracycline; H) or in HEK293 FLP-In T-Rex cells depleted of the indicated protein/s (I). Three to six biological replicates including those used in the RNA-seq were analyzed. (J) Plasmid JM101/L1.3-O1EGFP-O2mcherry contains a full-length L1 L1.3 (Sassaman et al., 1997) element producing L1-ORF1p-EGFP and L1-ORF2p-mCherry. Additionally, the plasmid contains the mneoI cassette (Moran et al., 1996) to monitor retrotransposition. (K) A retrotransposition test with the JM101/L1.3-O1EGFP-O2mcherry and parental JM101/L1.3. Addition of both fluorescent proteins in L1 ORFs does not severely compromise its retrotransposition potential. (L and M) HEK293T cells were co-transfected with JM101/L1.3-O1EGFP-O2mcherry and plasmids overexpressing the indicated TUTases or MOV10. The percentage of cells expressing L1-ORF1p-EGFP (L) and L1-ORF2p-mCherry (M) were estimated in the total cell populations using FC. Normalized values from 8 biological replicates (3 independent experiments) are shown. Statistical significances were calculated using one-way ANOVA and Tukey’s multiple comparison test (∗∗∗p < 0.001, ∗∗p < 0.01, comparison to MBP). (N) Plasmids of the pZW-L1RP series containing a full-length L1 (L1RP, Kimberland et al., 1999) element in a modified pcDNA5 FRT/TO backbone producing L1-ORF1p and L1-ORF2p with either an epitope FLAG tag or fluorescent EGFP or mCherry tags as indicated. All but pZW-L1RP-O2G were produced without or with the megfpI L1 retrotransposition reporter cassette. (O) Retrotransposition test with pZW-L1RP-O1F-megfpI and pZW-L1RP-O1mCh-megfpI reporters. The presence of either tag does not prevent L1 retrotransposition. (P) Translation of L1-ORF1p-mCherry encoded in pZW-L1RP-O1mCh plasmid. Cells expressing mCherry over background levels (HEK293T cells transfected with control L1 plasmid not encoding any fluorescent tag) were considered. Median mCherry intensity was calculated and used as a measure of L1-ORF1p-mCherry translation. (R) Translation of L1-ORF2p-EGFP encoded on the pZW-L1RP-O2G plasmid was estimated as in (P) except for EGFP. Six to nine biological replicates (2 or 3 independent experiments) were analyzed. Statistical significances in (P) and (R) were calculated as in panel (L). Data on panels G, H, I, L, M, O, P, and R are presented as medians with individual points and interquartile ranges shown. The western blotting exposures were done either to a film and scanned by an Epson scanner and bottom scanning option (panels C and D) or by a CCD camera (panel E). The singnals in the images acuired with a CCD camera were digitally enhanced by using ‘adjust levels’ option for the entire images.
Figure 4
Figure 4
Differential Effects of TUT4 and TUT7 on L1 mRNA Abundance, Stability, and Translatability (A) Northern blot of full-length reporter L1 mRNAs, expressed from a plasmid encoding a full-length L1.3 lacking a reporter cassette (JM101/L1.3 no marker) under overexpression of MBP or N’MBP-tagged TUT4, TUT7, and MOV10 as indicated. GAPDH served as a loading control. Marks on the right indicate positions of the RNA reference ladder (in thousands of nucleotides) and the position of 28S and 18S rRNAs is indicated. (B) Quantification of four northern blots like in (A) (four biological replicates, three independent experiments) normalized relative to the GAPDH signals and the MBP sample. One-way ANOVA and Tukey’s multiple comparison test were used to calculate statistical significance (p < 0.05; ∗∗∗p < 0.001). (C) Confocal microscopy pictures (maximal projections in z) depicting HEK293 cells transfected with plasmids encoding EGFP-TUT4 (top-left panel) and mCherry-MOV10 (top right, merge on bottom-left panel) or EGFP-TUT7 (bottom right) to assess the subcellular localization of proteins. DNA was stained with Hoechst (cyan). Scale bars represent 10 or 20 μm as indicated. (D) Quantitation of MOV10 containing foci in HEK293 cells that also contain TUT4 or TUT7 (based on co-transfection experiments and confocal microscopy like in C). For each condition (TUT4 vs. TUT7), 30 cells were analyzed. Statistical significance was calculated using a Wilcoxon signed-rank test (p < 0.0001). (E) Decay of L1 reporter and endogenous MYC mRNAs normalized to GAPDH mRNA. Actinomycin D was added to cell aliquots for 1–6 hr to block transcription, followed by RNA retrieval and estimation of RNA levels by RT-qPCR using multiplexing and Taq-Man probes. Results of three (MYC) or four (L1) independent biological replicates (time-course assays) are shown (mean values). (F and G) RNA-seq-based estimation of endogenous L1s expressed in HEK293 cells overexpressing TUT4, TUT7 (stable cell lines), or MOV10 (transient transfection) (F) or siRNA-depleted of these proteins (G). Uniquely mapped reads for 76 Homo sapiens-specific L1s (after Repbase) were calculated and normalized to respective controls as indicated. Statistical significances were calculated by DESeq2 for each respective condition pair using summarized counts of each L1 subfamily and are shown above each pair in (F). No significant changes could be observed in (G). (H) Analytical flow cytometry of cell populations co-transfected with a pJM101/L1.3-O1EGFP-O2mCherry plasmid and plasmids overexpressing the indicated proteins. The pJM101/L1.3-O1EGFP-O2mCherry contains a full-length L1.3 element from which the fluorescent EGFP and mCherry cDNAs were cloned in-frame in the C terminus of L1-ORF1p and L1-ORF2p, respectively. Normalized EGFP and mCherry intensities for data from 8 biological replicates (3 independent experiments) are shown. Statistical significance was calculated like in (B). (I) Western blot analysis of FLAG-tagged L1-ORF1p, translated from a full-length L1 without a reporter cassette (pZW-L1RP-O1F; Figure S4N). Co-transfected plasmids are indicated at the top of the panel. Membranes were probed with anti-FLAG, anti-GAPDH and anti-MBP antibodies to detect respectively: overexpressed L1-ORF1p-FLAG, GAPDH (loading control), and MBP-tagged proteins. Note that MBP migrates faster than any tagged protein, and it is beyond the blot and thus not detected. Data in (B), (D), and (H) are medians with individual points and interquartile ranges shown. See also Figure S4 and Tables S3, S4, and S5.
Figure S5
Figure S5
Stable Cell Line Validation and Co-IP Experiments, Related to Figure 5 (A) Flow cytometry profiles of parental HEK293 FLP-IN T-Rex (black traces) and stable cell lines expressing EGFP-TUT4 or EGFP-TUT7 in the absence of (blue traces) or following induction of transgene expression with 100 ng/ml tetracycline (green traces). “EGFP+ GATE” denotes the region with cells showing higher EGFP fluorescence than ∼99.9% of the control cells that do not express EGFP. The histograms were obtained using Flowing software. The table below the histograms summarizes the percentage of EGFP+ cells within each experimental population. (B) Western blot validation of the EGFP-TUT4-expressing stable cell line. Cells were grown for 48 h without tetracycline or with addition of 25, 50 or 100 ng/ml tetracycline in the medium. Proteins were separated by SDS-PAGE, followed by transfer to nitrocellulose membranes and Ponceau S staining (lower panel) to control for protein loading. The upper panel shows results after probing with a TUT4-specific rabbit polyclonal antibody. (C) Western blot validation of the EGFP-TUT7-expressing stable cell line as in (B). Lanes 1 and 5 are reference lanes with material from the EGFP-TUT4 cell line and parental HEK293 FLP-IN T-Rex cells, respectively, to show antibody specificity. An asterisk denotes an unspecific band. (D) HEK293 FLP-In T-Rex cells were fixed with formaldehyde and stained for endogenous TUT4 (upper panel) or TUT7 (lower panel) with rabbit polyclonal antibodies and Alexa 488-coupled secondary goat anti-rabbit antibodies. Nuclei were visualized by Hoechst DNA staining (cyan). Maximal projection images of z stacks are shown. White bars, 10 μm (E) Single z-slides (epifluorescent – left, and bright field – right) of live cells from stable cell lines expressing either EGFP-TUT4 (upper panel) or EGFP-TUT7 (lower panel). White bars, 10 μm (F and G) Rapid cell fractionation following the protocol described by Suzuki et al. (2010) and subsequent western blotting to independently assess subcellular localization of TUT7, TUT4, MOV10. Blotting for cytoplasmic (tubulins or GAPDH) and nuclear (fibrillarin, RRP6 nuclear exosome complex exoribonuclease) markers were also performed. Cells were either parental HEK293 FLP-IN T-Rex (F), or HeLa-HA used in L1 mneoI reporter assays (G). An asterisk denotes an unspecific band. (H) Western blotting of proteins associated with either EGFP-MOV10 or EGFP showed are: blot for TUT7 probing (left), probing with monoclonal αEGFP antibody (middle; 1% co-IP), and polyclonal anti-TUT7 antibodies (right, 5% co-IP, blot before probing depicted on the left). Visible is TUT7 in EGFP-MOV10 co-IP and not in control EGFP co-IP. In TUT7-probed blot some cross-reactivity toward overrepresented EGFP-MOV10 but not EGFP can also be seen. (I) Flow-chart of the workflow of the RNA co-IP with FLAG-TUT7. (J) western blotting showing efficient depletion of MOV10 in HEK293T cells used for in vivo UV-crosslinking and co-IP with FLAG-TUT7. Shown are western blotting results after probing with polyclonal antibodies against MOV10 and GAPDH (loading control). Cells were transfected with: Lane 1 – control non-targeting siRNA then plasmids encoding L1 reporter and MBP-TUT7; lane 2 – MOV10 targeting siRNA then plasmids encoding L1 reporter and FLAG-TUT7; lane 3 – control non-targeting siRNA then plasmids encoding L1 reporter and FLAG-TUT7; lanes 4 and 5 – as in lane 3 but 0.5 and 0.2 of the material seen in lane 3 was loaded (control to compare with lane 2). (K) SDS-PAGE and silver staining of proteins recovered in the MBP- and FLAG-TUT7 co-IP after in vivo UV-crosslinking. Visible are bands representing FLAG-TUT7 (lanes 2 and 3, indicated with an asterisk) and M2 antibody stripped off the beads (lanes 2-4). Loaded were ca. 10% recovered material (lanes 2, 4) and ∼6% recovered material (lane 3). Lane 1 – molecular weight ladder (170 and 55 kDa bands are indicated); lane 2 – IP with MBP-TUT7 (control); lane 3 – IP with FLAG-TUT7 from MOV10-depleted cells; lane 4 – IP with FLAG-TUT7 from control cells. The western blotting exposures were done either to a film and scanned by an Epson scanner and either top or bottom scanning options (panels B and F respectively) or by a CCD camera (C, G, H, J panels). The signals in the C, G, H and J panels were digitally enhanced by using ‘adjust levels’ option for the entire images (but for the middle H panel).
Figure 5
Figure 5
RNA-Dependent Association of TUT4 and TUT7 with MOV10 (A) Mass spectrometry of coIPs with EGFP-TUT4 (6) and controls (6). Normalized mean intensity (semiquantitative measure of protein abundance) and specificity (quotient of mean intensity in EGFP-TUT4 coIP and in control coIP) are plotted. Only hits identified in at least 3 of 6 EGFP-TUT4 coIPs are shown. (B) Mass spectrometry of coIPs with EGFP-TUT7 (7) depicted like in (A). Only hits identified in at least 4 of 7 EGFP-TUT7 coIPs are shown. (C) Mass spectrometry of coIPs with EGFP-MOV10 (7) depicted like in (A). Only hits identified in at least 3 of 7 EGFP-MOV10 coIPs are shown. (D) Flowchart of experiments used to study RNA-dependence and stability of the TUT4 and TUT7 interactions with MOV10 (left panel) and results of the respective experiment (right panel). CoIP was done with EGFP-MOV10 as bait. Lanes 1–4: input and coIP with lysates from control EGFP-expressing cells; lanes 5–13: coIP with lysates from EGFP-MOV10-expressing cells; lanes 5–8: input proteins; lanes 9–13: enriched proteins without (lanes 9 and 11–13) or with RNase A (lane 10), washed with increasing salt concentrations as indicated (lanes 11–13). Supernatants after incubation with (lane 14) or without (lane 15) RNase A. Blots were probed for MOV10, TUT4, TUT7, PABPC1, and GAPDH as indicated. Probing for GAPDH and control coIP was done to show the absence of non-specific interactions. (E) TUT7 coIP with RNA after in vivo UV-crosslinking using monoclonal anti-FLAG antibodies and lysates from cells expressing reporter L1 RNAs and either FLAG-TUT7 or control MBP-TUT7. Enrichment fold was calculated by 2ˆΔΔCt method, dividing enriched L1 or GAPDH mRNAs in FLAG-TUT7 coIP by their amounts non-specifically enriched in MBP-TUT7 coIP. (F) Result of RNA coIP after in vivo UV-crosslinking with FLAG-TUT7 from control cells (transfected with control non-targeting siRNA, CNTRL) or cells depleted of MOV10 (by siRNA), both transfected with plasmids encoding L1 reporter and FLAG-TUT7. L1 enrichment was calculated by 2ˆΔΔCt method of L1 mRNAs enriched in each condition and normalized to GAPDH recovered in each condition. (E and F) Results of four independent biological experiments are shown. Statistical significance was calculated using a two-tailed Mann-Whitney test. Median values, with individual points and interquartile ranges are shown. See also Figure S5 and Tables S6 and S7.
Figure 6
Figure 6
MOV10 Facilitates Uridylation by Competing with L1-ORF1p (A) RNA uridylation assay on a 5′ 32P-labeled synthetic RNA by recombinant TUT4 in the absence or presence of recombinant L1-ORF1p and the indicated helicase/RNPase (HsMOV10, ScPRP2 or HsSUV3). Lane IN – input RNA; lanes 1–4: uridylation in the absence (1) or presence of increasing concentrations of rL1-ORF1p (2–4); lanes 5–8: like in lanes 1–4 but in the presence of HsMOV10; lanes 9–12: like in lanes 1–4 but in the presence of ScPRP2; and lanes 13–16: like in lanes 1–4 but in the presence of HsSUV3. The ladder on the right of the panel indicates appended Us. (B) RNA uridylation levels in the absence or the presence of the indicated helicase proteins were plotted as functions of rL1-ORF1p concentration. Medians of four independent replicates like in (A). (C) Results of 5 independent RNA uridylation experiments like in (A) in the absence or presence of MOV10. Statistical significances were calculated using two-way ANOVA and Bonferroni multiple comparison test. Mean values with SD are shown. See also Figure S6.
Figure S6
Figure S6
MOV10 Prevents Binding of L1-ORF1p to L1-RNA, Related to Figure 6 (A) A 5′-FAM-labeled RNA was incubated with increasing amounts of recombinant L1-ORF1p in the presence of TUT7 WT purified from human cells and UTP (lanes 2-6). A reaction containing only the RNA (lane 1) was included as a control. Another reaction containing the RNA, UTP and WT TUT7 but no L1-ORF1p was also included (lane 2). On lanes 3-6, increasing amounts of recombinant L1-ORF1p were added (as indicated at the top), changing the molar ratio of L1-ORF1p to the RNA from 0 to 3-fold. Reactions were stopped, purified and separated by PAGE. (B) Quantification of the RNA present in the reactions shown in panel (A). Note that the graph contains the results of three independent experiments. Measured values were corrected for background, assuming no elongation in the control samples. Medians, ranges and individual points are shown. Statistical significances were calculated using one-way ANOVA and Tukey’s multiple comparison test (∗∗∗p < 0.001, ∗∗p < 0.01). (C) RNase I footprinting assay. An in vitro transcribed L1-3′UTR RNA was labeled randomly by the incorporation of α32P UTP and incubated alone (lane 2), or was incubated in the presence of Mg2+ATP (lanes 3-8), without (lanes 3 and 6) or with recombinant L1-ORF1p in the indicated molar ratio to RNA (lanes 4, 5 and 7, 8) or with MOV10 purified from human cells (lanes 6-8). Note that MOV10 was added prior to L1-ORF1p addition. Lanes 1 and 9, alkaline hydrolysis ladders used as RNA mobility makers. An arrow points to full length L1 RNA. (D) RNase I footprinting assay as in panel C. The in vitro transcribed L1-3′UTR RNA (lane 1) was incubated in a buffer supplemented with Mg2+ and with ATP and increasing concentrations of L1-ORF1p (lanes 2-4); followed by incubation with MOV10 (lanes 5-7); or preceded by incubation with MOV10 (lanes 8-10); or preceded by incubation with MOV10 but without ATP (lanes 11-13). Finally, all the samples (excluding lane 1) were depleted of Mg2+, subjected to RNase I footprinting, purified and separated by denaturing PAGE. Visible is lack of L1-ORF1p displacement in lanes 12 and 13 as compared to lanes 9 and 10. Visible is effect of MOV10 addition after L1-ORF1p in lanes 6 and 7 that might suggest kinetic competition of MOV10 and L1-ORF1p in binding to RNA. The arrow points to full length L1 RNA. (E) RNase I footprinting assay as in panel C but with either wild-type (lanes 2-4) or mutant (K530A) MOV10 (lanes 5-7). Visible is increased protection of the RNA in mutant MOV10 condition, which suggests less effective competition/removal of L1-ORF1p of the RNA by the mutant protein. The arrow points to full length L1 RNA.
Figure 7
Figure 7
Model of Restriction of L1 Retrotransposition by Uridylation
Figure S7
Figure S7
Graphical Visualization of the 3′ RACE-Seq Approach, Related to Figure 2 (A) Graphical representation of 3′ RACE-seq library preparation and the oligonucleotides used. First, the 3′ adaptor RA3_15N was joined to the 3′ end of RNA by enzymatic ligation. The adaptor has: (i) 5′ rApp modification for efficient and specific ligation by the truncated T4 RNA ligase 2, (ii) delimiter sequence to be used in bioinformatics analyses to exclude RT and PCR artifacts (CTGAC, highlighted in violet), (iii) unique 15N barcode for individual transcript barcoding (highlighted in green), (iv) anchor sequence to pair with the reverse transcription primer (underlined) and (v) dideoxyC on the 3′ end to prevent concatamer formation. The RNA ligated to the adaptor sequence was purified from excess adaptor and reverse transcription was performed with the RT primer, which is compatible with Illumina sequencing and has: (i) sequences to base-pair with the adaptor (underlined), (ii) 6-nucleotide barcode for sample barcoding (highlighted in red), (iii) sequences that base pair with the universal outer primer for nested PCR (blue). Libraries were generated by nested PCR with 2 outer forward primers (F1 and F2) and a single universal reverse primer (uni rev). PCR amplicons of first and second PCRs were purified from excess primers on AmPure beads (Agencourt) before beginning the next step. (B) Flowchart of the bioinformatics approach to 3′ RACE-seq data analysis. The procedure starts at the top. Datasets are shown in rectangles. Software used is depicted in hexagons.

Comment in

  • TUT-TUTting retrotransposons.
    Strzyz P. Strzyz P. Nat Rev Mol Cell Biol. 2018 Oct;19(10):618. doi: 10.1038/s41580-018-0058-2. Nat Rev Mol Cell Biol. 2018. PMID: 30158668 No abstract available.

References

    1. Alisch R.S., Garcia-Perez J.L., Muotri A.R., Gage F.H., Moran J.V. Unconventional translation of mammalian LINE-1 retrotransposons. Genes Dev. 2006;20:210–224. - PMC - PubMed
    1. Arjan-Odedra S., Swanson C.M., Sherer N.M., Wolinsky S.M., Malim M.H. Endogenous MOV10 inhibits the retrotransposition of endogenous retroelements but not the replication of exogenous retroviruses. Retrovirology. 2012;9:53. - PMC - PubMed
    1. Beck C.R., Garcia-Perez J.L., Badge R.M., Moran J.V. LINE-1 elements in structural variation and disease. Annu. Rev. Genomics Hum. Genet. 2011;12:187–215. - PMC - PubMed
    1. Branciforte D., Martin S.L. Developmental and cell type specificity of LINE-1 expression in mouse testis: implications for transposition. Mol Cell Biol. 1994;14:2584–2592. - PMC - PubMed
    1. Callahan K.E., Hickman A.B., Jones C.E., Ghirlando R., Furano A.V. Polymerization and nucleic acid-binding properties of human L1 ORF1 protein. Nucleic Acids Res. 2012;40:813–827. - PMC - PubMed

Publication types

MeSH terms